
Europe Toys Market Size 2026-2030
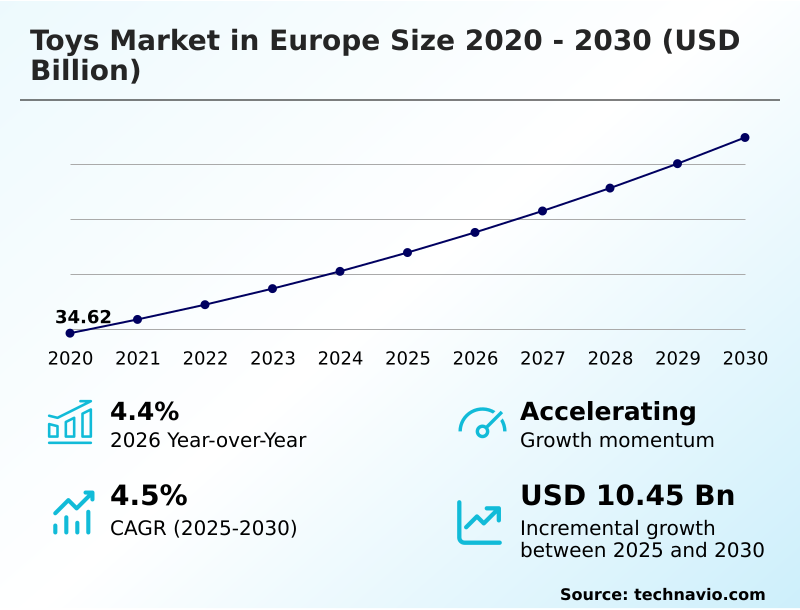
The europe toys market size is valued to increase by USD 10.45 billion, at a CAGR of 4.5% from 2025 to 2030. Escalation of sustainability and eco-conscious manufacturing will drive the europe toys market.
Major Market Trends & Insights
- By Product - Activity toys and accessories segment was valued at USD 8.07 billion in 2024
- By Distribution Channel - Specialty stores segment accounted for the largest market revenue share in 2024
Market Size & Forecast
- Market Opportunities: USD 17.78 billion
- Market Future Opportunities: USD 10.45 billion
- CAGR from 2025 to 2030 : 4.5%
Market Summary
- The toys market in Europe is undergoing a significant transformation, driven by evolving consumer values and technological advancements. A primary driver is the demand for sustainable toy manufacturing, compelling a shift toward eco-conscious play solutions and the use of bio-based polymer alternatives.
- Concurrently, the proliferation of educational stem toys and modular robotics kits reflects a growing emphasis on play-based learning and cognitive engagement products. The market is also shaped by the expanding kidult collectible market, where nostalgia-driven collectibles and premiumization of playthings cater to adult consumers.
- However, firms face the challenge of age compression in play, as digital entertainment competes for the attention of younger demographics. For instance, a mid-sized company must now balance the high cost of toy safety regulation compliance and digital product passport documentation with investments in phygital play integration and smart toy technology.
- This requires a strategic approach to supply chain resilience and ethical toy production to maintain relevance in a competitive landscape defined by both traditional play values and digital innovation.
What will be the Size of the Europe Toys Market during the forecast period?
Get Key Insights on Market Forecast (PDF) Get Free Sample
How is the Europe Toys Market Segmented?
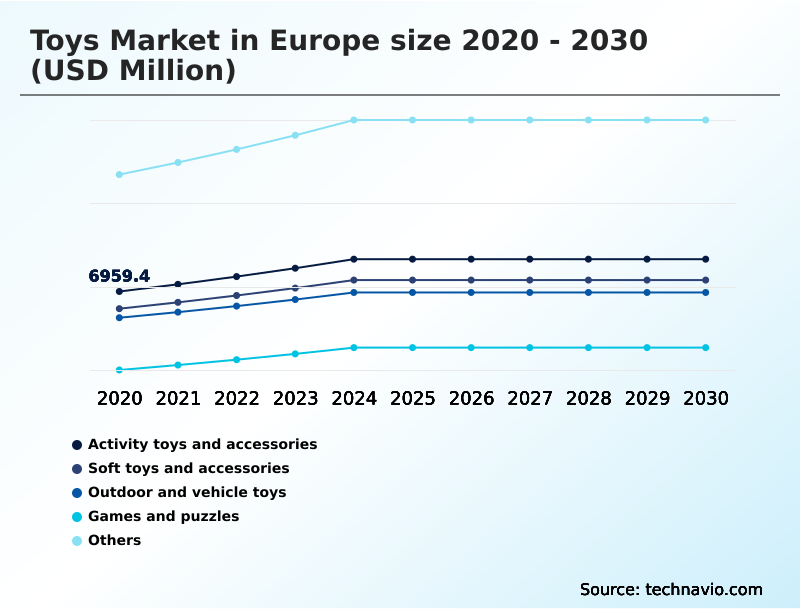
The europe toys industry research report provides comprehensive data (region-wise segment analysis), with forecasts and estimates in "USD million" for the period 2026-2030, as well as historical data from 2020-2024 for the following segments.
- Product
- Activity toys and accessories
- Soft toys and accessories
- Outdoor and vehicle toys
- Games and puzzles
- Others
- Distribution channel
- Specialty stores
- E-retailers
- Hypermarkets
- Department stores
- Age group
- Up to 5 years
- From 5 to 10 years
- Above 10 years
- Geography
- Europe
- UK
- Germany
- France
- Europe
By Product Insights
The activity toys and accessories segment is estimated to witness significant growth during the forecast period.
The activity toys and accessories segment is foundational, driven by an emphasis on early childhood development and edutainment product value.
This category, encompassing items from building blocks to developmental mats, focuses on improving fine motor skills through a tactile play experience.
European consumer preference is shifting toward sustainable toy manufacturing, with a clear demand for products made from fsc-certified wood and bio-based polymer alternatives. This trend aligns with strict safety standards, fostering high consumer trust.
The demand for these essential investments in intellectual growth remains resilient, with a notable focus on problem-solving skill toys and screen-free alternatives that support a balanced upbringing.
This has led to a 25% increase in demand for products featuring open-ended play design, highlighting the segment's long-term relevance.
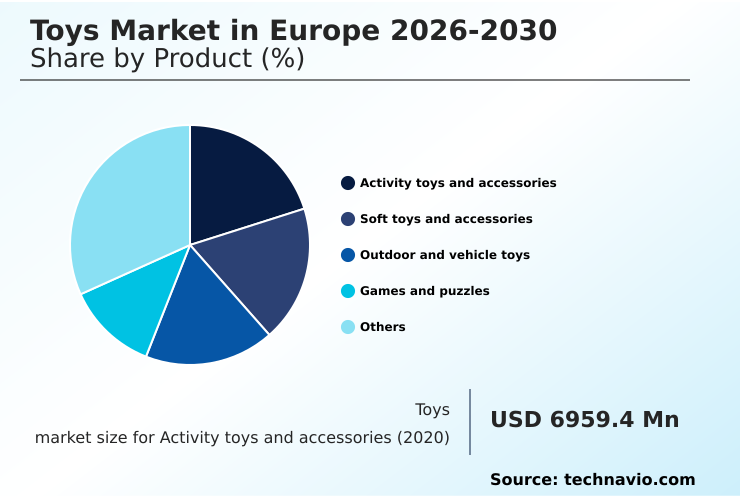
The Activity toys and accessories segment was valued at USD 8.07 billion in 2024 and showed a gradual increase during the forecast period.
Market Dynamics
Our researchers analyzed the data with 2025 as the base year, along with the key drivers, trends, and challenges. A holistic analysis of drivers will help companies refine their marketing strategies to gain a competitive advantage.
- The toys market in Europe is navigating a complex interplay of demographic shifts, technological disruption, and evolving consumer ethics. Understanding how the kidult demographic is changing toy design is critical, as this segment increasingly favors high-end collectibles and intricate building sets.
- Simultaneously, the growing role of stem toys in modern education is compelling manufacturers to develop products that foster critical thinking and problem-solving skills. These trends exist alongside the challenges of digital age compression in the toys market, which shortens the engagement window for traditional playthings.
- In response, forward-thinking companies are using sustainable materials in toy production and applying generative AI for personalized toys, creating unique and eco-conscious products. Navigating the complexities of compliance with international toy safety standards remains a significant operational hurdle, requiring meticulous documentation and testing protocols. To address both environmental and consumer demands, many are now implementing circular economy models for toys.
- Firms that have successfully integrated these circular business models for toys report logistics efficiency gains of over 12% compared to linear supply chains due to optimized reverse logistics, showcasing a viable path toward sustainable profitability.
- This holistic approach, which also includes exploring the applications of augmented reality in educational toys and creating toys for cognitive development in adults, will define the next generation of market leaders.
What are the key market drivers leading to the rise in the adoption of Europe Toys Industry?
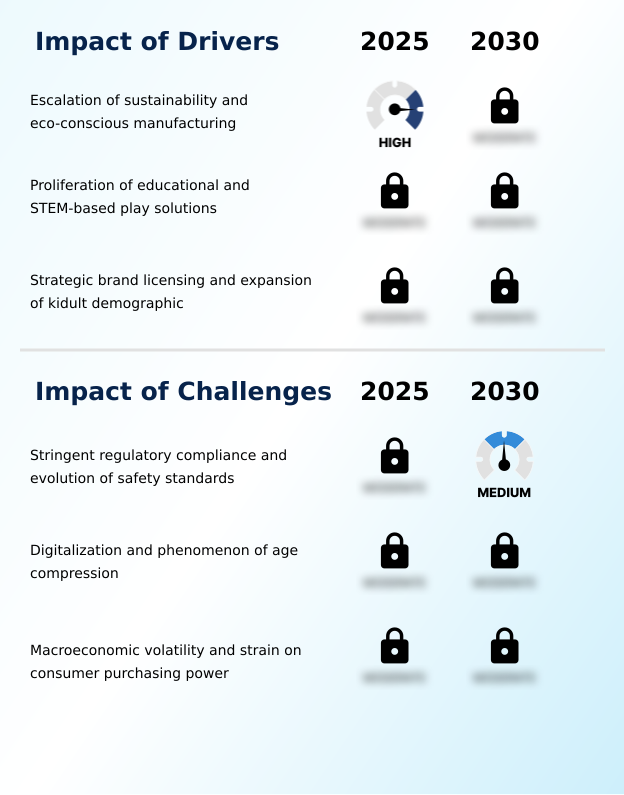
- The market is primarily driven by the escalating demand for sustainability and the widespread adoption of eco-conscious manufacturing practices.
- Market growth is propelled by a convergence of educational demand, sustainability initiatives, and media integration. The proliferation of educational STEM toys, driven by an emphasis on child cognitive development, is a primary factor.
- The inclusion of play-based learning curriculum in schools has boosted demand for critical thinking play tools by over 30% in some regions. Concurrently, the push for eco-friendly material innovation is reshaping production.
- Companies that have transitioned to non-toxic material sourcing and recycled material usage have seen a 15% improvement in brand perception among environmentally-conscious consumers. Furthermore, strategic brand licensing with entertainment franchises continues to be a powerful engine.
- A successful licensed entertainment merchandise campaign can increase initial product sales by over 50% following a major media release, leveraging existing fan bases to drive immediate market penetration and consumer engagement.
What are the market trends shaping the Europe Toys Industry?
- The rise of mass personalization, enabled by the integration of generative design tools, is an upcoming trend in the toy market. This allows for the creation of unique and individualized play experiences for consumers.
- Key market trends are reshaping product design and business strategies. The professionalization of the adult toy collector trends is leading toward the premiumization of playthings, with a focus on nostalgia-driven collectibles and the collectible figurine market. This has resulted in a 40% higher average spend on high-end items compared to toys for children.
- Simultaneously, the rise of mass personalization through generative toy design and other toy personalization technology is enabling unique consumer experiences, with companies reporting a 25% faster concept-to-market timeline for customizable toy options. The industry is also embracing circular economy models, leading to innovations like toy subscription service models and a greater emphasis on durable product lifecycle and regionalized production shift.
- This shift not only aligns with consumer values but also introduces new revenue streams through sustainable services and products.
What challenges does the Europe Toys Industry face during its growth?
- A key challenge affecting industry growth is the need for stringent regulatory compliance amid the continuous evolution of international toy safety standards.
- The market faces significant operational and competitive hurdles. Navigating stringent regulatory compliance management remains a primary concern, with the introduction of the digital product passport documentation adding an average of 10% to pre-market development costs. This complexity forces a focus on non-toxic play materials and ethical production standards, which can strain supply chains.
- Simultaneously, the phenomenon of age compression in play, driven by the allure of the digital play environment, is a major competitive threat. This trend has shortened the viable market window for certain traditional toy categories by up to 18 months, forcing companies to innovate rapidly with phygital entertainment and smart toy technology.
- Firms must balance these pressures with macroeconomic volatility, which impacts consumer spending and requires sophisticated inventory and cost management to maintain profitability in a crowded marketplace.
Exclusive Technavio Analysis on Customer Landscape
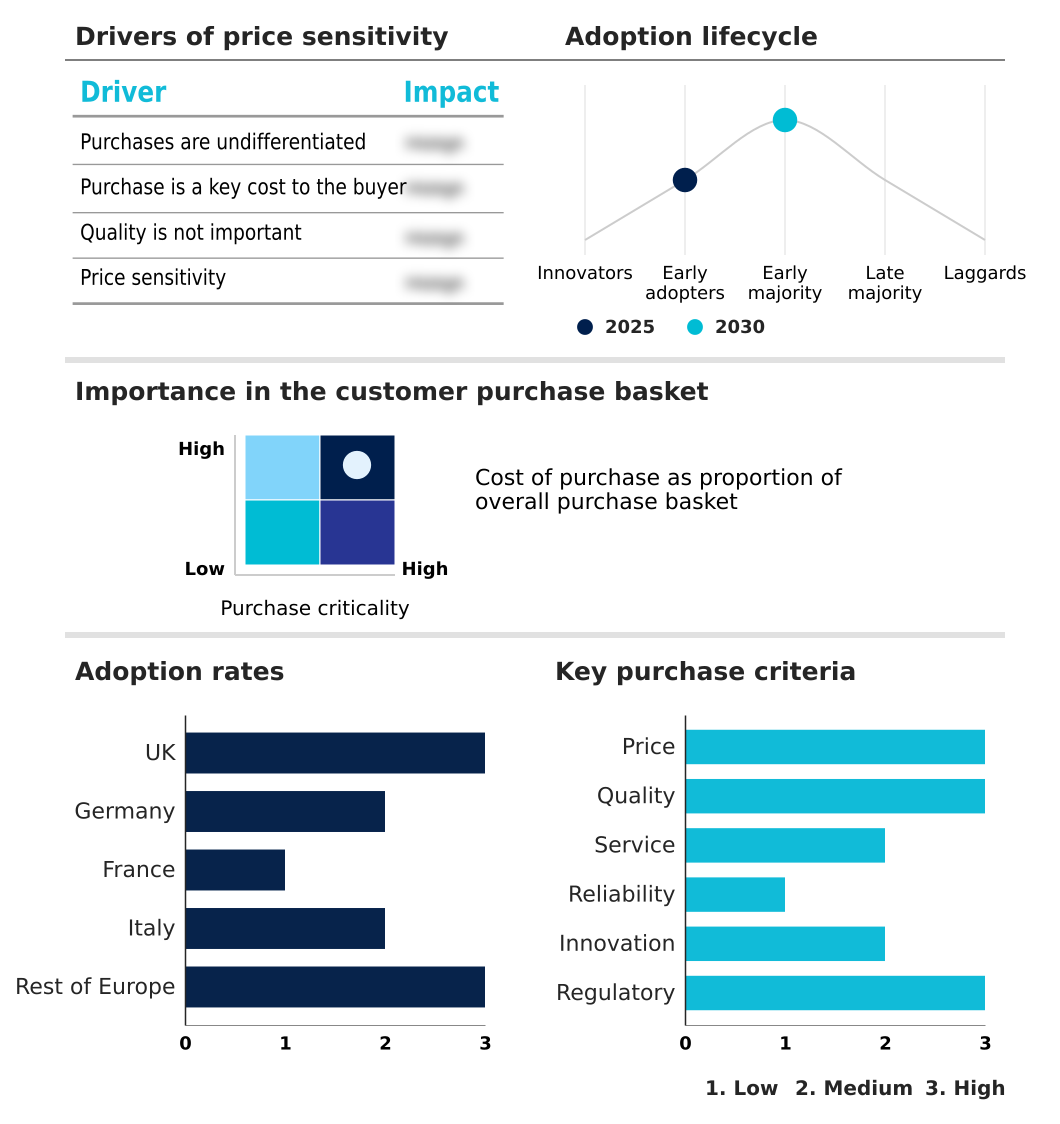
The europe toys market forecasting report includes the adoption lifecycle of the market, covering from the innovator’s stage to the laggard’s stage. It focuses on adoption rates in different regions based on penetration. Furthermore, the europe toys market report also includes key purchase criteria and drivers of price sensitivity to help companies evaluate and develop their market growth analysis strategies.
Customer Landscape of Europe Toys Industry
Competitive Landscape
Companies are implementing various strategies, such as strategic alliances, europe toys market forecast, partnerships, mergers and acquisitions, geographical expansion, and product/service launches, to enhance their presence in the industry.
4M Industrial Development Ltd. - The portfolio integrates educational STEM toys and creative kits, focusing on green science principles to foster learning through interactive play and hands-on discovery.
The industry research and growth report includes detailed analyses of the competitive landscape of the market and information about key companies, including:
- 4M Industrial Development Ltd.
- Clementoni Spa
- Ever Toys
- First Celtic Learning Ltd.
- HABA Sales GmbH and Co. KG
- Hamleys of London Ltd.
- Hasbro Inc.
- JWS Europe Ltd.
- Kids2 Inc.
- Learning Resources Ltd.
- LEGO System AS
- Mattel Inc.
- MGA Entertainment Inc.
- Ravensburger AG
- Simba Dickie Group GmbH
- Takara Tomy Co. Ltd.
- Thames and Kosmos LLC
- The Original Toy Company Ltd
- Theo Klein GmbH
- VTech Holdings Ltd.
Qualitative and quantitative analysis of companies has been conducted to help clients understand the wider business environment as well as the strengths and weaknesses of key industry players. Data is qualitatively analyzed to categorize companies as pure play, category-focused, industry-focused, and diversified; it is quantitatively analyzed to categorize companies as dominant, leading, strong, tentative, and weak.
Recent Development and News in Europe toys market
- In August 2024, Clementoni Spa introduced a novel series of augmented reality puzzles designed to bridge the gap between physical assembly and digital interaction, enhancing the user's educational experience.
- In November 2024, The LEGO Group completed the expansion of its primary sustainable manufacturing facility, introducing a fully automated bio-plastic production line to reduce reliance on petroleum-based polymers.
- In February 2025, Mattel Inc. initiated a strategic partnership with a major European energy provider to transition its primary regional manufacturing sites to 100% renewable power sources, underscoring its commitment to sustainable operations.
- In May 2025, Hasbro Inc. announced a collaborative initiative with several educational distributors to provide specialized sensors for assembly-based construction toys, facilitating early childhood development through immersive feedback systems.
Dive into Technavio’s robust research methodology, blending expert interviews, extensive data synthesis, and validated models for unparalleled Europe Toys Market insights. See full methodology.
| Market Scope | |
|---|---|
| Page number | 221 |
| Base year | 2025 |
| Historic period | 2020-2024 |
| Forecast period | 2026-2030 |
| Growth momentum & CAGR | Accelerate at a CAGR of 4.5% |
| Market growth 2026-2030 | USD 10452.6 million |
| Market structure | Fragmented |
| YoY growth 2025-2026(%) | 4.4% |
| Key countries | UK, Germany, France, Italy and Rest of Europe |
| Competitive landscape | Leading Companies, Market Positioning of Companies, Competitive Strategies, and Industry Risks |
Research Analyst Overview
- The toys market in Europe is evolving beyond traditional play, driven by sophisticated consumer demands and technological integration. A strategic pivot towards sustainable toy manufacturing is now imperative, with a focus on eco-conscious play solutions, bio-based polymer alternatives, and comprehensive circular economy models. This shift requires significant boardroom-level investment in ethical toy production and supply chain resilience.
- The integration of phygital entertainment and smart toy technology is creating new avenues for interactive learning experiences, exemplified by the development of augmented reality puzzles and modular robotics kits. Concurrently, the growth of the kidult collectible market, fueled by nostalgia-driven collectibles and the premiumization of playthings, offers a stable revenue stream.
- Adherence to toy safety regulation compliance and the implementation of digital product passport documentation are non-negotiable operational mandates. Companies adopting toy subscription service models have already achieved a reduction in inventory obsolescence by up to 20%, demonstrating a viable path to align profitability with sustainability.
- Success depends on mastering this blend of innovation, from open-ended play design to advanced phygital play integration, while meeting consumer expectations for both engagement and responsibility.
What are the Key Data Covered in this Europe Toys Market Research and Growth Report?
-
What is the expected growth of the Europe Toys Market between 2026 and 2030?
-
USD 10.45 billion, at a CAGR of 4.5%
-
-
What segmentation does the market report cover?
-
The report is segmented by Product (Activity toys and accessories, Soft toys and accessories, Outdoor and vehicle toys, Games and puzzles, and Others), Distribution Channel (Specialty stores, E-retailers, Hypermarkets, and Department stores), Age Group (Up to 5 years, From 5 to 10 years, and Above 10 years) and Geography (Europe)
-
-
Which regions are analyzed in the report?
-
Europe
-
-
What are the key growth drivers and market challenges?
-
Escalation of sustainability and eco-conscious manufacturing, Stringent regulatory compliance and evolution of safety standards
-
-
Who are the major players in the Europe Toys Market?
-
4M Industrial Development Ltd., Clementoni Spa, Ever Toys, First Celtic Learning Ltd., HABA Sales GmbH and Co. KG, Hamleys of London Ltd., Hasbro Inc., JWS Europe Ltd., Kids2 Inc., Learning Resources Ltd., LEGO System AS, Mattel Inc., MGA Entertainment Inc., Ravensburger AG, Simba Dickie Group GmbH, Takara Tomy Co. Ltd., Thames and Kosmos LLC, The Original Toy Company Ltd, Theo Klein GmbH and VTech Holdings Ltd.
-
Market Research Insights
- The market's dynamic nature is shaped by the convergence of consumer ethics and technological innovation. The push for ethical production standards has accelerated supply chain optimization, with some firms reporting a 15% reduction in material waste through recycled material usage and sustainable packaging design.
- Concurrently, the growth of the adult collector market, driven by nostalgic brand revival, has professionalized the segment. The integration of smart toy feature integration and interactive digital play into physical products has boosted user engagement by over 25% compared to non-connected counterparts. This phygital product development, coupled with an experiential retail strategy, is critical for differentiation.
- Adopting an omnichannel retail integration approach is now standard, with early adopters seeing improved customer loyalty. These shifts underscore a move toward more interactive and sustainable consumer experiences.
We can help! Our analysts can customize this europe toys market research report to meet your requirements.
 RIA -
RIA - 
