Transdermal Patches Market Analysis North America, Europe, Asia, Rest of World (ROW) - US, Germany, UK, China, Japan - Size and Forecast 2024-2028

Transdermal Patches Market Analysis North America, Europe, Asia, Rest of World (ROW) - US, Germany, UK, China, Japan - Size and Forecast 2024-2028

Published: Mar 2024 159 Pages SKU: IRTNTR77722

Market Overview at a Glance

$2 B
Market Opportunity
5.65%
CAGR
4.87
YoY growth 2023-2024(%)

Transdermal Patches Market Size 2024-2028 

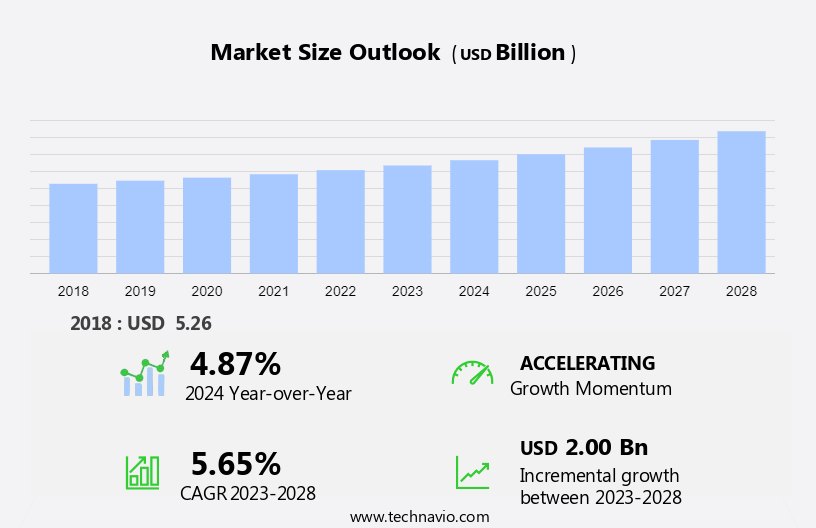
The transdermal patches market size is forecast to increase by USD 2.00 billion at a CAGR of 5.65% between 2023 and 2028. The market is experiencing significant growth due to the increasing demand for non-invasive drug delivery methods. This non-invasive approach offers several advantages, including improved patient compliance, consistent drug delivery, and reduced side effects. Another trend driving market growth is the development of microneedle patches, which enhance drug delivery efficiency by allowing drugs to penetrate deeper into the skin.

However, stringent regulatory approvals for transdermal drug delivery systems by government bodies pose a challenge to market growth. Regulatory agencies require extensive clinical trials and rigorous safety and efficacy testing, which can be time-consuming and costly. Despite these challenges, the market is expected to continue growing due to the numerous benefits offered by transdermal patches over traditional oral and injectable drug delivery methods.

Market Analysis

Transdermal Patches Market Size

 Request Free Sample

Transdermal patches are non-invasive medication delivery systems that provide controlled dosing and prolonged therapeutic effects for various chronic diseases and pain-related conditions. These patches work by delivering medication through the skin directly into the bloodstream, bypassing the digestive system. This method offers several advantages over traditional injections, including reduced healthcare facility costs, improved patient compliance, and fewer medication failures. Technological developments in transdermal patches have led to the creation of electronic and mechanical patches, which offer enhanced features such as real-time monitoring and programmable dosing. Analgesic patches are a common application of transdermal technology, providing effective pain management for conditions such as arthritis and diabetic neuropathy.

The elderly population, who often suffer from multiple chronic diseases, is a significant market for transdermal patches. Chronic diseases such as diabetes, hypertension, and pain-related conditions are major drivers for the growth of the market. The opioid epidemic has also fueled interest in non-invasive pain management methods, further boosting demand for transdermal patches. Adhesives and drug formulations are critical components of transdermal patches, and advancements in these areas are expected to drive innovation in the market. The market for transdermal patches is expected to grow significantly in the coming years, offering opportunities for manufacturers and investors in this space.

Market Segmentation

The market research report provides comprehensive data (region-wise segment analysis), with forecasts and estimates in "USD billion" for the period 2024-2028, as well as historical data from 2018-2022 for the following segments.

  • Application
    • Pain management
    • Central nervous system disorders
    • Hormonal application
    • Cardiovascular diseases
    • Others
  • End-user
    • Homecare
    • Hospitals and clinics
  • Geography
    • North America
      • US
    • Europe
      • Germany
      • UK
    • Asia
      • China
      • Japan
    • Rest of World (ROW)

By Application Insights

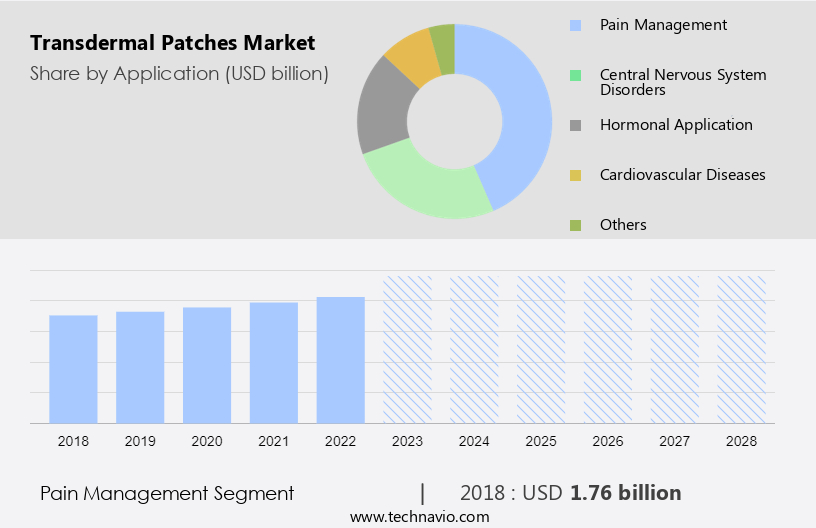
The pain management segment is estimated to witness significant growth during the forecast period. Transdermal patches represent a non-invasive, painless method for medication administration, particularly effective in managing chronic pain conditions. These patches, which deliver analgesic drugs through the skin and into the bloodstream, offer several advantages over traditional injections. Technological developments have led to advancements in adhesive performance, permeability, and skin barriers, ensuring effective drug delivery and minimizing skin irritation. The market for transdermal patches is experiencing growth due to the increasing prevalence of chronic illnesses, such as arthritis, neuropathic pain, and heart disease. Moreover, the opioid epidemic has fueled the demand for alternative, non-addictive pain management techniques. The multi-layer drug-in-adhesive segment is a significant contributor to the market, with various drugs, including opioids, NSAIDs, lidocaine, and antiretroviral drugs for HIV infection, being administered through this technology.

Further, the use of transdermal patches is not limited to pain management; they are also employed in contraceptive applications and for delivering medications to specific body areas, such as the abdomen, buttock, and upper torso, for individuals with a BMI of 30 kg/m2 or higher. The convenience and efficacy of transdermal patches make them an attractive alternative to oral-dosage forms, offering a more consistent dose of medicine and reducing healthcare facility costs.

Transdermal Patches Market Size

Get a glance at the market share of various segments Request Free Sample

The Pain management segment accounted for USD 1.76 billion in 2018 and showed a gradual increase during the forecast period.

Regional Insights

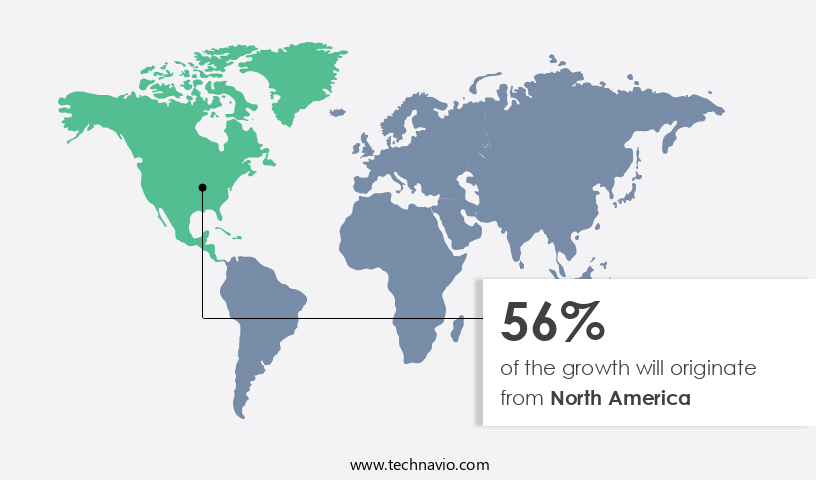
North America is estimated to contribute 56% to the growth of the global market during the forecast period. Technavio's analysts have elaborately explained the regional trends and drivers that shape the market during the forecast period.

Transdermal Patches Market Share by Geography

For more insights on the market share of various regions Request Free Sample

The market is witnessing significant growth, particularly in the treatment of chronic diseases and conditions such as cancer, diabetes, hypertension, and pain-related conditions. North America is a leading region in this market, driven by the increasing prevalence of these conditions in the elderly population. Transdermal patches offer controlled dosing and prolonged therapeutic effects, making them an attractive delivery mechanism for various drug formulations. In North America, the US is the largest market contributor, with Canada and Mexico following suit. The demand for transdermal patches is increasing due to their convenience and effectiveness in managing chronic diseases. Nicotine transdermal patches are also gaining popularity in the region due to the growing number of smokers. Adhesive technology plays a crucial role in ensuring the effective and secure application of transdermal patches. Overall, the market is expected to expand steadily in the coming years, driven by the rising prevalence of chronic diseases and the need for alternative, effective, and convenient drug delivery mechanisms.

Market Dynamics

Our researchers analyzed the data with 2023 as the base year, along with the key drivers, trends, and challenges. A holistic analysis of drivers will help companies refine their marketing strategies to gain a competitive advantage.

Market Driver

Growing demand for non-invasive drug delivery methods is the key driver of the market. The market is witnessing significant growth due to the increasing preference for non-invasive drug delivery methods, particularly in managing chronic illnesses. These patches offer a painless and convenient alternative to traditional injections and oral-dosage forms, making them an attractive option for patients and healthcare providers. Technological developments in transdermal patches have led to advancements in formulation issues, adhesive performance, and permeability, ensuring effective medication delivery through the skin and into the bloodstream. The opioid epidemic has further fueled the demand for non-addictive pain management techniques, making transdermal patches an essential tool in pain relief. However, challenges such as skin irritation and skin barriers remain, prompting drug delivery companies to innovate and develop multi-layer drug-in-adhesive segments to address these concerns.

Transdermal patches are being used to deliver various medications, including analgesics, antiretroviral drugs for HIV infection, and heart disease treatments. The market for these patches is expanding to cover various application sites, including the abdomen, buttock, and upper torso, and is expected to continue growing with technological advances in electronic and mechanical patches. The non-invasive and painless method of drug administration offered by transdermal patches is particularly appealing to individuals with a Body Mass Index (BMI) of 30 kg/m2 or higher, who may find it difficult to adhere to conventional medication regimens.

Market Trends

The development of microneedle patches for enhanced drug delivery efficiency is the upcoming trend in the market. Transdermal patches have emerged as a popular non-invasive method for medication delivery, particularly for managing chronic illnesses such as pain and hormonal imbalances. These patches, which adhere to the skin, deliver medication directly into the bloodstream, bypassing the digestive system and offering a painless, consistent dose. Technological developments in transdermal patch technology have led to the creation of advanced analgesic patches, which address formulation issues and improve adhesive performance, reducing skin irritation. Microneedle patches represent a significant trend in this market, with their ability to penetrate the skin's outer layer and create temporary micropores, enhancing drug delivery efficiency. This non-invasive method is especially beneficial for patients with conditions like HIV infection or heart disease, where traditional injections may not be an option due to healthcare facility costs or medication failure.

The multi-layer drug-in-adhesive segment of the market is expected to grow significantly due to its ability to deliver both small and large molecules, including antiretroviral drugs and vaccines, which may have limited permeability through the intact skin. The development of electronic and mechanical microneedle patches further expands the scope of transdermal therapy, offering potential solutions for various chronic conditions. However, challenges such as BMI limitations and application site selection remain, necessitating ongoing research and innovation in this field.

Market Challenge

Stringent regulatory approvals for transdermal drug delivery systems by government bodies is a key challenge affecting the market growth. Transdermal patches represent a non-invasive method for medication administration, particularly useful for managing chronic illnesses such as pain and hormonal imbalances. These patches, which deliver medication through the skin and into the bloodstream, offer several advantages over traditional injections, including painless application and elimination of healthcare facility costs. Analgesic patches, for instance, are widely used for pain management techniques, addressing formulation issues and skin irritation concerns associated with oral-dosage forms and opioid epidemic. Technological developments have significantly advanced transdermal patch technology, enabling the creation of multi-layer drug-in-adhesive segments, enhancing permeability and overcoming skin barriers. The market for these patches includes various applications, including heart disease, HIV infection, and contraception.

For instance, antiretroviral drugs for HIV infection are increasingly being delivered through transdermal patches to improve patient compliance and reduce the frequency of injections. Despite these benefits, the market faces regulatory challenges. Strict approval processes by government bodies, such as the FDA, necessitate rigorous testing, including biomechanical testing, animal testing, and clinical trials, to ensure safety and efficacy. This lengthy and costly process may delay market entry and limit the potential growth of transdermal patches, particularly for drug delivery companies seeking first-mover advantage. However, the advantages of non-invasive methods and the ongoing technological advances continue to drive the market forward.

These patches are applied to various body parts, including the abdomen, buttock, and upper torso, and are available in electronic, mechanical, and adhesive forms. The adhesive patch, in particular, has gained popularity due to its ease of use and effectiveness. Despite the challenges, the market is expected to grow, driven by the increasing prevalence of chronic illnesses and the need for painless, convenient medication administration methods. However, addressing issues related to adhesive performance, skin irritation, and drug delivery efficiency remains crucial for market expansion.

Exclusive Customer Landscape

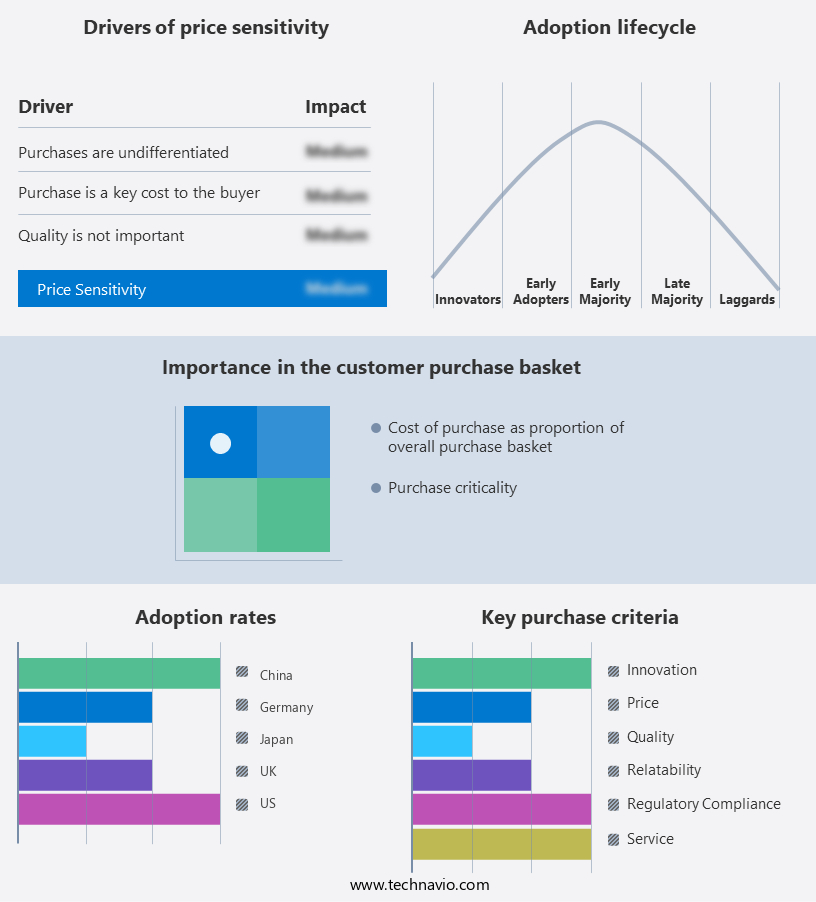
The market forecasting report includes the adoption lifecycle of the market, covering from the innovator's stage to the laggard's stage. It focuses on adoption rates in different regions based on penetration. Furthermore, the report also includes key purchase criteria and drivers of price sensitivity to help companies evaluate and develop their market growth analysis strategies.

Transdermal Patches Market Share by Geography

 Customer Landscape

Key Companies & Market Insights

Companies are implementing various strategies, such as strategic alliances, partnerships, mergers and acquisitions, geographical expansion, and product/service launches, to enhance their presence in the market.

Boehringer Ingelheim International GmbH: The company offers transdermal patches through its Skinfusion transdermal delivery system such as Twirla AG200-15, AG200-ER (SmP), AG200-ER and AG890.

The market research and growth report includes detailed analyses of the competitive landscape of the market and information about key companies, including:

  • Alvogen Iceland ehf
  • Endo International Plc
  • Hisamitsu Pharmaceutical Co. Inc.
  • IontoPatch
  • Johnson and Johnson Services Inc.
  • Lead Chemical Co. Ltd.
  • Luye Pharma Group Ltd.
  • Medherant Ltd.
  • Mundipharma International Ltd.
  • Nitto Denko Corp.
  • Novartis AG
  • Purdue Pharma LP
  • Sparsha Pharma International Pvt. Ltd.
  • Teva Pharmaceutical Industries Ltd.
  • Viatris Inc.
  • AdhexPharma SAS
  • Agile Therapeutics Inc.
  • Bayer AG
  • Evernow Inc.

Qualitative and quantitative analysis of companies has been conducted to help clients understand the wider business environment as well as the strengths and weaknesses of key market players. Data is qualitatively analyzed to categorize companies as pure play, category-focused, industry-focused, and diversified; it is quantitatively analyzed to categorize companies as dominant, leading, strong, tentative, and weak.

Research Analyst Overview

Transdermal patches are non-invasive medication delivery systems that provide an alternative to traditional injections for managing chronic illnesses. These patches work by delivering a consistent dose of medication through the skin and into the bloodstream. Analgesic patches are one of the most common types of transdermal patches, used for pain management. Technological developments in transdermal patch technology have led to advancements in drug delivery, adhesive performance, and permeability, making them a popular choice for patients. The opioid epidemic has led to a growing demand for non-addictive pain management techniques, further fueling the growth of the market. However, formulation issues, skin irritation, and skin barriers are some challenges facing the industry.

Drug delivery companies are investing in research and development to improve the efficacy and safety of transdermal patches. The multi-layer drug-in-adhesive segment is expected to dominate the market due to its ability to deliver multiple drugs simultaneously. Transdermal patches are used to administer various medications, including antiretroviral drugs for HIV infection, heart disease medications, and contraceptives. Transdermal patches can be applied to various body parts such as the abdomen, buttock, and upper torso. The non-invasive and painless method of medication administration is particularly beneficial for patients with a Body Mass Index (BMI) of 30 kg/m2 or higher, who may find it difficult to take oral-dosage forms. Technological advances in electronic and mechanical transdermal patches are also expected to drive market growth.

Market Scope

Report Coverage

Details

Page number

159

Base year

2023

Historic period

2018-2022

Forecast period

2024-2028

Growth momentum & CAGR

Accelerate at a CAGR of 5.65%

Market growth 2024-2028

USD 2.00 billion

Market structure

Fragmented

YoY growth 2023-2024(%)

4.87

Regional analysis

North America, Europe, Asia, and Rest of World (ROW)

Performing market contribution

North America at 56%

Key countries

US, Germany, UK, China, and Japan

Competitive landscape

Leading Companies, Market Positioning of Companies, Competitive Strategies, and Industry Risks

Key companies profiled

Alvogen Iceland ehf, Boehringer Ingelheim International GmbH, Endo International Plc, Hisamitsu Pharmaceutical Co. Inc., IontoPatch, Johnson and Johnson Services Inc., Lead Chemical Co. Ltd., Luye Pharma Group Ltd., Medherant Ltd., Mundipharma International Ltd., Nitto Denko Corp., Novartis AG, Purdue Pharma LP, Sparsha Pharma International Pvt. Ltd., Teva Pharmaceutical Industries Ltd., Viatris Inc., AdhexPharma SAS, Agile Therapeutics Inc., Bayer AG, and Evernow Inc.

Market dynamics

Parent market analysis, market growth inducers and obstacles, market forecast, fast-growing and slow-growing segment analysis, COVID-19 impact and recovery analysis and future consumer dynamics, market condition analysis for the forecast period

Customization purview

If our market report has not included the data that you are looking for, you can reach out to our analysts and get segments customized.

Request Free Sample

What are the Key Data Covered in this Market Research and Growth Report?

  • CAGR of the market during the forecast period
  • Detailed information on factors that will drive the market growth and forecasting between 2024 and 2028
  • Precise estimation of the size of the market  and its contribution of the market in focus to the parent market
  • Accurate predictions about upcoming market growth and trends and changes in consumer behaviour
  • Growth of the market across North America, Europe, Asia, and Rest of World (ROW)
  • Thorough analysis of the market's competitive landscape and detailed information about companies
  • Comprehensive analysis of factors that will challenge the growth of market companies

We can help! Our analysts can customize this market research report to meet your requirements. Get in touch

1 Executive Summary

  • 1.1 Market overview
    • Exhibit 01: Executive Summary – Chart on Market Overview
    • Exhibit 02: Executive Summary – Data Table on Market Overview
    • Exhibit 03: Executive Summary – Chart on Global Market Characteristics
    • Exhibit 04: Executive Summary – Chart on Market by Geography
    • Exhibit 05: Executive Summary – Chart on Market Segmentation by Application
    • Exhibit 06: Executive Summary – Chart on Market Segmentation by End-user
    • Exhibit 07: Executive Summary – Chart on Incremental Growth
    • Exhibit 08: Executive Summary – Data Table on Incremental Growth
    • Exhibit 09: Executive Summary – Chart on Vendor Market Positioning

2 Market Landscape

  • 2.1 Market ecosystem
    • Exhibit 10: Parent market
    • Exhibit 11: Market Characteristics

3 Market Sizing

  • 3.1 Market definition
    • Exhibit 12: Offerings of vendors included in the market definition
  • 3.2 Market segment analysis
    • Exhibit 13: Market segments
  • 3.3 Market size 2023
    • 3.4 Market outlook: Forecast for 2023-2028
      • Exhibit 14: Chart on Global - Market size and forecast 2023-2028 ($ billion)
      • Exhibit 15: Data Table on Global - Market size and forecast 2023-2028 ($ billion)
      • Exhibit 16: Chart on Global Market: Year-over-year growth 2023-2028 (%)
      • Exhibit 17: Data Table on Global Market: Year-over-year growth 2023-2028 (%)

    4 Historic Market Size

    • 4.1 Global transdermal patches market 2018 - 2022
      • Exhibit 18: Historic Market Size – Data Table on global transdermal patches market 2018 - 2022 ($ billion)
    • 4.2 Application Segment Analysis 2018 - 2022
      • Exhibit 19: Historic Market Size – Application Segment 2018 - 2022 ($ billion)
    • 4.3 End User Segment Analysis 2018 - 2022
      • Exhibit 20: Historic Market Size – End User Segment 2018 - 2022 ($ billion)
    • 4.4 Geography Segment Analysis 2018 - 2022
      • Exhibit 21: Historic Market Size – Geography Segment 2018 - 2022 ($ billion)

    5 Five Forces Analysis

    • 5.1 Five forces summary
      • Exhibit 22: Five forces analysis - Comparison between 2023 and 2028
    • 5.2 Bargaining power of buyers
      • Exhibit 23: Chart on Bargaining power of buyers – Impact of key factors 2023 and 2028
    • 5.3 Bargaining power of suppliers
      • Exhibit 24: Bargaining power of suppliers – Impact of key factors in 2023 and 2028
    • 5.4 Threat of new entrants
      • Exhibit 25: Threat of new entrants – Impact of key factors in 2023 and 2028
    • 5.5 Threat of substitutes
      • Exhibit 26: Threat of substitutes – Impact of key factors in 2023 and 2028
    • 5.6 Threat of rivalry
      • Exhibit 27: Threat of rivalry – Impact of key factors in 2023 and 2028
    • 5.7 Market condition
      • Exhibit 28: Chart on Market condition - Five forces 2023 and 2028

    6 Market Segmentation by Application

    • 6.1 Market segments
      • Exhibit 29: Chart on Application - Market share 2023-2028 (%)
      • Exhibit 30: Data Table on Application - Market share 2023-2028 (%)
    • 6.2 Comparison by Application
      • Exhibit 31: Chart on Comparison by Application
      • Exhibit 32: Data Table on Comparison by Application
    • 6.3 Pain management - Market size and forecast 2023-2028
      • Exhibit 33: Chart on Pain management - Market size and forecast 2023-2028 ($ billion)
      • Exhibit 34: Data Table on Pain management - Market size and forecast 2023-2028 ($ billion)
      • Exhibit 35: Chart on Pain management - Year-over-year growth 2023-2028 (%)
      • Exhibit 36: Data Table on Pain management - Year-over-year growth 2023-2028 (%)
    • 6.4 Central nervous system disorders - Market size and forecast 2023-2028
      • Exhibit 37: Chart on Central nervous system disorders - Market size and forecast 2023-2028 ($ billion)
      • Exhibit 38: Data Table on Central nervous system disorders - Market size and forecast 2023-2028 ($ billion)
      • Exhibit 39: Chart on Central nervous system disorders - Year-over-year growth 2023-2028 (%)
      • Exhibit 40: Data Table on Central nervous system disorders - Year-over-year growth 2023-2028 (%)
    • 6.5 Hormonal application - Market size and forecast 2023-2028
      • Exhibit 41: Chart on Hormonal application - Market size and forecast 2023-2028 ($ billion)
      • Exhibit 42: Data Table on Hormonal application - Market size and forecast 2023-2028 ($ billion)
      • Exhibit 43: Chart on Hormonal application - Year-over-year growth 2023-2028 (%)
      • Exhibit 44: Data Table on Hormonal application - Year-over-year growth 2023-2028 (%)
    • 6.6 Cardiovascular diseases - Market size and forecast 2023-2028
      • Exhibit 45: Chart on Cardiovascular diseases - Market size and forecast 2023-2028 ($ billion)
      • Exhibit 46: Data Table on Cardiovascular diseases - Market size and forecast 2023-2028 ($ billion)
      • Exhibit 47: Chart on Cardiovascular diseases - Year-over-year growth 2023-2028 (%)
      • Exhibit 48: Data Table on Cardiovascular diseases - Year-over-year growth 2023-2028 (%)
    • 6.7 Others - Market size and forecast 2023-2028
      • Exhibit 49: Chart on Others - Market size and forecast 2023-2028 ($ billion)
      • Exhibit 50: Data Table on Others - Market size and forecast 2023-2028 ($ billion)
      • Exhibit 51: Chart on Others - Year-over-year growth 2023-2028 (%)
      • Exhibit 52: Data Table on Others - Year-over-year growth 2023-2028 (%)
    • 6.8 Market opportunity by Application
      • Exhibit 53: Market opportunity by Application ($ billion)
      • Exhibit 54: Data Table on Market opportunity by Application ($ billion)

    7 Market Segmentation by End-user

    • 7.1 Market segments
      • Exhibit 55: Chart on End-user - Market share 2023-2028 (%)
      • Exhibit 56: Data Table on End-user - Market share 2023-2028 (%)
    • 7.2 Comparison by End-user
      • Exhibit 57: Chart on Comparison by End-user
      • Exhibit 58: Data Table on Comparison by End-user
    • 7.3 Homecare - Market size and forecast 2023-2028
      • Exhibit 59: Chart on Homecare - Market size and forecast 2023-2028 ($ billion)
      • Exhibit 60: Data Table on Homecare - Market size and forecast 2023-2028 ($ billion)
      • Exhibit 61: Chart on Homecare - Year-over-year growth 2023-2028 (%)
      • Exhibit 62: Data Table on Homecare - Year-over-year growth 2023-2028 (%)
    • 7.4 Hospitals and clinics - Market size and forecast 2023-2028
      • Exhibit 63: Chart on Hospitals and clinics - Market size and forecast 2023-2028 ($ billion)
      • Exhibit 64: Data Table on Hospitals and clinics - Market size and forecast 2023-2028 ($ billion)
      • Exhibit 65: Chart on Hospitals and clinics - Year-over-year growth 2023-2028 (%)
      • Exhibit 66: Data Table on Hospitals and clinics - Year-over-year growth 2023-2028 (%)
    • 7.5 Market opportunity by End-user
      • Exhibit 67: Market opportunity by End-user ($ billion)
      • Exhibit 68: Data Table on Market opportunity by End-user ($ billion)

    8 Customer Landscape

    • 8.1 Customer landscape overview
      • Exhibit 69: Analysis of price sensitivity, lifecycle, customer purchase basket, adoption rates, and purchase criteria

    9 Geographic Landscape

    • 9.1 Geographic segmentation
      • Exhibit 70: Chart on Market share by geography 2023-2028 (%)
      • Exhibit 71: Data Table on Market share by geography 2023-2028 (%)
    • 9.2 Geographic comparison
      • Exhibit 72: Chart on Geographic comparison
      • Exhibit 73: Data Table on Geographic comparison
    • 9.3 North America - Market size and forecast 2023-2028
      • Exhibit 74: Chart on North America - Market size and forecast 2023-2028 ($ billion)
      • Exhibit 75: Data Table on North America - Market size and forecast 2023-2028 ($ billion)
      • Exhibit 76: Chart on North America - Year-over-year growth 2023-2028 (%)
      • Exhibit 77: Data Table on North America - Year-over-year growth 2023-2028 (%)
    • 9.4 Europe - Market size and forecast 2023-2028
      • Exhibit 78: Chart on Europe - Market size and forecast 2023-2028 ($ billion)
      • Exhibit 79: Data Table on Europe - Market size and forecast 2023-2028 ($ billion)
      • Exhibit 80: Chart on Europe - Year-over-year growth 2023-2028 (%)
      • Exhibit 81: Data Table on Europe - Year-over-year growth 2023-2028 (%)
    • 9.5 Asia - Market size and forecast 2023-2028
      • Exhibit 82: Chart on Asia - Market size and forecast 2023-2028 ($ billion)
      • Exhibit 83: Data Table on Asia - Market size and forecast 2023-2028 ($ billion)
      • Exhibit 84: Chart on Asia - Year-over-year growth 2023-2028 (%)
      • Exhibit 85: Data Table on Asia - Year-over-year growth 2023-2028 (%)
    • 9.6 Rest of World (ROW) - Market size and forecast 2023-2028
      • Exhibit 86: Chart on Rest of World (ROW) - Market size and forecast 2023-2028 ($ billion)
      • Exhibit 87: Data Table on Rest of World (ROW) - Market size and forecast 2023-2028 ($ billion)
      • Exhibit 88: Chart on Rest of World (ROW) - Year-over-year growth 2023-2028 (%)
      • Exhibit 89: Data Table on Rest of World (ROW) - Year-over-year growth 2023-2028 (%)
    • 9.7 US - Market size and forecast 2023-2028
      • Exhibit 90: Chart on US - Market size and forecast 2023-2028 ($ billion)
      • Exhibit 91: Data Table on US - Market size and forecast 2023-2028 ($ billion)
      • Exhibit 92: Chart on US - Year-over-year growth 2023-2028 (%)
      • Exhibit 93: Data Table on US - Year-over-year growth 2023-2028 (%)
    • 9.8 China - Market size and forecast 2023-2028
      • Exhibit 94: Chart on China - Market size and forecast 2023-2028 ($ billion)
      • Exhibit 95: Data Table on China - Market size and forecast 2023-2028 ($ billion)
      • Exhibit 96: Chart on China - Year-over-year growth 2023-2028 (%)
      • Exhibit 97: Data Table on China - Year-over-year growth 2023-2028 (%)
    • 9.9 Germany - Market size and forecast 2023-2028
      • Exhibit 98: Chart on Germany - Market size and forecast 2023-2028 ($ billion)
      • Exhibit 99: Data Table on Germany - Market size and forecast 2023-2028 ($ billion)
      • Exhibit 100: Chart on Germany - Year-over-year growth 2023-2028 (%)
      • Exhibit 101: Data Table on Germany - Year-over-year growth 2023-2028 (%)
    • 9.10 UK - Market size and forecast 2023-2028
      • Exhibit 102: Chart on UK - Market size and forecast 2023-2028 ($ billion)
      • Exhibit 103: Data Table on UK - Market size and forecast 2023-2028 ($ billion)
      • Exhibit 104: Chart on UK - Year-over-year growth 2023-2028 (%)
      • Exhibit 105: Data Table on UK - Year-over-year growth 2023-2028 (%)
    • 9.11 Japan - Market size and forecast 2023-2028
      • Exhibit 106: Chart on Japan - Market size and forecast 2023-2028 ($ billion)
      • Exhibit 107: Data Table on Japan - Market size and forecast 2023-2028 ($ billion)
      • Exhibit 108: Chart on Japan - Year-over-year growth 2023-2028 (%)
      • Exhibit 109: Data Table on Japan - Year-over-year growth 2023-2028 (%)
    • 9.12 Market opportunity by geography
      • Exhibit 110: Market opportunity by geography ($ billion)
      • Exhibit 111: Data Tables on Market opportunity by geography ($ billion)

    10 Drivers, Challenges, and Trends

    • 10.1 Market drivers
      • 10.2 Market challenges
        • 10.3 Impact of drivers and challenges
          • Exhibit 112: Impact of drivers and challenges in 2023 and 2028
        • 10.4 Market trends

          11 Vendor Landscape

          • 11.1 Overview
            • 11.2 Vendor landscape
              • Exhibit 113: Overview on Criticality of inputs and Factors of differentiation
            • 11.3 Landscape disruption
              • Exhibit 114: Overview on factors of disruption
            • 11.4 Industry risks
              • Exhibit 115: Impact of key risks on business

            12 Vendor Analysis

            • 12.1 Vendors covered
              • Exhibit 116: Vendors covered
            • 12.2 Market positioning of vendors
              • Exhibit 117: Matrix on vendor position and classification
            • 12.3 Agile Therapeutics Inc.
              • Exhibit 118: Agile Therapeutics Inc. - Overview
              • Exhibit 119: Agile Therapeutics Inc. - Product / Service
              • Exhibit 120: Agile Therapeutics Inc. - Key offerings
            • 12.4 Alvogen Iceland ehf
              • Exhibit 121: Alvogen Iceland ehf - Overview
              • Exhibit 122: Alvogen Iceland ehf - Product / Service
              • Exhibit 123: Alvogen Iceland ehf - Key offerings
            • 12.5 Bayer AG
              • Exhibit 124: Bayer AG - Overview
              • Exhibit 125: Bayer AG - Business segments
              • Exhibit 126: Bayer AG - Key news
              • Exhibit 127: Bayer AG - Key offerings
              • Exhibit 128: Bayer AG - Segment focus
            • 12.6 Boehringer Ingelheim International GmbH
              • Exhibit 129: Boehringer Ingelheim International GmbH - Overview
              • Exhibit 130: Boehringer Ingelheim International GmbH - Business segments
              • Exhibit 131: Boehringer Ingelheim International GmbH - Key news
              • Exhibit 132: Boehringer Ingelheim International GmbH - Key offerings
              • Exhibit 133: Boehringer Ingelheim International GmbH - Segment focus
            • 12.7 Endo International Plc
              • Exhibit 134: Endo International Plc - Overview
              • Exhibit 135: Endo International Plc - Business segments
              • Exhibit 136: Endo International Plc - Key news
              • Exhibit 137: Endo International Plc - Key offerings
              • Exhibit 138: Endo International Plc - Segment focus
            • 12.8 Hisamitsu Pharmaceutical Co. Inc.
              • Exhibit 139: Hisamitsu Pharmaceutical Co. Inc. - Overview
              • Exhibit 140: Hisamitsu Pharmaceutical Co. Inc. - Product / Service
              • Exhibit 141: Hisamitsu Pharmaceutical Co. Inc. - Key offerings
            • 12.9 IontoPatch
              • Exhibit 142: IontoPatch - Overview
              • Exhibit 143: IontoPatch - Key offerings
            • 12.10 Johnson and Johnson Services Inc.
              • Exhibit 144: Johnson and Johnson Services Inc. - Overview
              • Exhibit 145: Johnson and Johnson Services Inc. - Business segments
              • Exhibit 146: Johnson and Johnson Services Inc. - Key news
              • Exhibit 147: Johnson and Johnson Services Inc. - Key offerings
              • Exhibit 148: Johnson and Johnson Services Inc. - Segment focus
            • 12.11 Lead Chemical Co. Ltd.
              • Exhibit 149: Lead Chemical Co. Ltd. - Overview
              • Exhibit 150: Lead Chemical Co. Ltd. - Product / Service
              • Exhibit 151: Lead Chemical Co. Ltd. - Key offerings
            • 12.12 Luye Pharma Group Ltd.
              • Exhibit 152: Luye Pharma Group Ltd. - Overview
              • Exhibit 153: Luye Pharma Group Ltd. - Business segments
              • Exhibit 154: Luye Pharma Group Ltd. - Key offerings
              • Exhibit 155: Luye Pharma Group Ltd. - Segment focus
            • 12.13 Nitto Denko Corp.
              • Exhibit 156: Nitto Denko Corp. - Overview
              • Exhibit 157: Nitto Denko Corp. - Business segments
              • Exhibit 158: Nitto Denko Corp. - Key offerings
              • Exhibit 159: Nitto Denko Corp. - Segment focus
            • 12.14 Novartis AG
              • Exhibit 160: Novartis AG - Overview
              • Exhibit 161: Novartis AG - Business segments
              • Exhibit 162: Novartis AG - Key news
              • Exhibit 163: Novartis AG - Key offerings
              • Exhibit 164: Novartis AG - Segment focus
            • 12.15 Purdue Pharma LP
              • Exhibit 165: Purdue Pharma LP - Overview
              • Exhibit 166: Purdue Pharma LP - Product / Service
              • Exhibit 167: Purdue Pharma LP - Key offerings
            • 12.16 Teva Pharmaceutical Industries Ltd.
              • Exhibit 168: Teva Pharmaceutical Industries Ltd. - Overview
              • Exhibit 169: Teva Pharmaceutical Industries Ltd. - Business segments
              • Exhibit 170: Teva Pharmaceutical Industries Ltd. - Key news
              • Exhibit 171: Teva Pharmaceutical Industries Ltd. - Key offerings
              • Exhibit 172: Teva Pharmaceutical Industries Ltd. - Segment focus
            • 12.17 Viatris Inc.
              • Exhibit 173: Viatris Inc. - Overview
              • Exhibit 174: Viatris Inc. - Business segments
              • Exhibit 175: Viatris Inc. - Key news
              • Exhibit 176: Viatris Inc. - Key offerings
              • Exhibit 177: Viatris Inc. - Segment focus

            13 Appendix

            • 13.1 Scope of the report
              • 13.2 Inclusions and exclusions checklist
                • Exhibit 178: Inclusions checklist
                • Exhibit 179: Exclusions checklist
              • 13.3 Currency conversion rates for US$
                • Exhibit 180: Currency conversion rates for US$
              • 13.4 Research methodology
                • Exhibit 181: Research methodology
                • Exhibit 182: Validation techniques employed for market sizing
                • Exhibit 183: Information sources
              • 13.5 List of abbreviations
                • Exhibit 184: List of abbreviations

              Research Methodology

              Technavio presents a detailed picture of the market by way of study, synthesis, and summation of data from multiple sources. The analysts have presented the various facets of the market with a particular focus on identifying the key industry influencers. The data thus presented is comprehensive, reliable, and the result of extensive research, both primary and secondary.

              INFORMATION SOURCES

              Primary sources

              • Manufacturers and suppliers
              • Channel partners
              • Industry experts
              • Strategic decision makers

              Secondary sources

              • Industry journals and periodicals
              • Government data
              • Financial reports of key industry players
              • Historical data
              • Press releases

              DATA ANALYSIS

              Data Synthesis

              • Collation of data
              • Estimation of key figures
              • Analysis of derived insights

              Data Validation

              • Triangulation with data models
              • Reference against proprietary databases
              • Corroboration with industry experts

              REPORT WRITING

              Qualitative

              • Market drivers
              • Market challenges
              • Market trends
              • Five forces analysis

              Quantitative

              • Market size and forecast
              • Market segmentation
              • Geographical insights
              • Competitive landscape

              Interested in this report?

              Get your sample now to see our research methodology and insights!

              Download Now

              Frequently Asked Questions

              Transdermal Patches market growth will increase by $ 2.00 bn during 2024-2028.

              The Transdermal Patches market is expected to grow at a CAGR of 5.65% during 2024-2028.

              Transdermal Patches market is segmented by Application( Pain management, Central nervous system disorders, Hormonal application, Cardiovascular diseases, Others) End-user( Homecare, Hospitals and clinics, clinics)

              Alvogen Iceland ehf, Boehringer Ingelheim International GmbH, Endo International Plc, Hisamitsu Pharmaceutical Co. Inc., IontoPatch, Johnson and Johnson Services Inc., Lead Chemical Co. Ltd., Luye Pharma Group Ltd., Medherant Ltd., Mundipharma International Ltd., Nitto Denko Corp., Novartis AG, Purdue Pharma LP, Sparsha Pharma International Pvt. Ltd., Teva Pharmaceutical Industries Ltd., Viatris Inc., AdhexPharma SAS, Agile Therapeutics Inc., Bayer AG, Evernow Inc. are a few of the key vendors in the Transdermal Patches market.

              North America will register the highest growth rate of 56% among the other regions. Therefore, the Transdermal Patches market in North America is expected to garner significant business opportunities for the vendors during the forecast period.

              US, Germany, UK, China, Japan

              • Growing demand for non-invasive drug delivery methodsThe growing demand for non-invasive drug delivery methods serves as a significant driver for the global transdermal patches market. As patients and healthcare providers increasingly seek alternatives to traditional oral medications and invasive procedures is the driving factor this market.
              • transdermal patches have emerged as a preferred option due to their convenience is the driving factor this market.
              • effectiveness is the driving factor this market.
              • and patient-friendly nature. One of the primary reasons driving the demand for non-invasive drug delivery methods is the desire to minimize discomfort and inconvenience associated with conventional routes of administration is the driving factor this market.
              • such as injections or oral tablets. Transdermal patches offer a painless and hassle-free method of drug delivery is the driving factor this market.
              • eliminating the need for needles or frequent dosing while providing sustained release of medication over an extended period. Transdermal patches offer greater control over drug delivery is the driving factor this market.
              • ensuring consistent blood levels of the medication and reducing the risk of fluctuations that can occur with oral medications. This controlled release mechanism enhances therapeutic outcomes and improves patient compliance is the driving factor this market.
              • particularly for individuals with chronic conditions requiring long-term medication management. Additionally is the driving factor this market.
              • the non-invasive nature of transdermal patches makes them suitable for a wide range of patient populations is the driving factor this market.
              • including children is the driving factor this market.
              • elderly individuals is the driving factor this market.
              • and those with needle phobias or difficulty swallowing oral medications. This broad applicability further contributes to the growing demand for transdermal patches across various therapeutic areas. Hence is the driving factor this market.
              • the increase in the adoption of non-invasive drug delivery systems will boost the growth of the global transdermal patches market during the forecast period. is the driving factor this market.

              The Transdermal Patches market vendors should focus on grabbing business opportunities from the Pain management segment as it accounted for the largest market share in the base year.