
Transformers For Renewable Energy Market Size 2025-2029
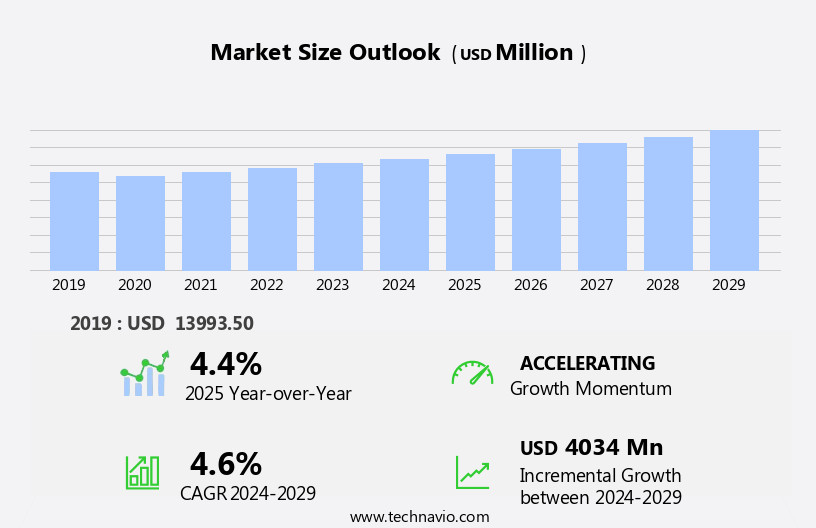
The transformers for renewable energy market size is forecast to increase by USD 4.03 billion at a CAGR of 4.6% between 2024 and 2029.
- The market is experiencing significant growth, driven by the global shift towards renewable energy sources and the increasing number of offshore wind farm installations. Governments worldwide are prioritizing green power to reduce and mitigate climate change, leading to a swell in demand for transformers that can effectively manage the unique power requirements of sustainable energy systems. However, the market growth is not without challenges. The high cost of upgrading electricity distribution networks to accommodate the intermittent nature of renewable energy sources poses a significant barrier to market expansion.
- Moreover, the need for advanced transformer technologies that can efficiently handle the varying power output of renewable energy sources is crucial to ensure grid stability and reliability. Companies seeking to capitalize on this market opportunity must focus on developing cost-effective, efficient, and reliable transformer solutions that cater to the unique needs of the sustainable energy sector. Navigating these challenges and meeting the evolving demands of the market requires strategic planning, technological innovation, and a deep knowledge of the regulatory landscape.
What will be the Size of the Market during the forecast period?
- The market is experiencing significant growth as the global shift towards sustainable energy sources continues. Renewable energy systems, including hydro, wind, solar, and unconventional sources, require full electrical infrastructure to convert and transmit electricity. Transformers play a crucial role in this process, enabling efficient power transmission and distribution. The market's size is expanding due to the increasing availability of sustainable energy and the need to integrate these sources into the power grid infrastructure. Dry-type transformers, known for their fire resistance and environmental friendliness, are gaining popularity in this sector. The construction advancement of sustainable energy and the expansion of built-up infrastructure in rural and remote places further fuel market growth.
- Renewable energy transformers contribute to reducing carbon emissions and minimizing the environmental impact of energy production. They are essential components of sustainable energy systems, facilitating the integration of sustainable energy sources into the power grid and ensuring electricity availability for consumers. Transmission routes and distribution networks are being upgraded to accommodate the increasing demand for sustainable energy, providing opportunities for market expansion.
How is this Transformers For Renewable Energy Industry segmented?
The transformers for renewable energy industry research report provides comprehensive data (region-wise segment analysis), with forecasts and estimates in "USD billion" for the period 2025-2029, as well as historical data from 2019-2023 for the following segments.
- Application
- Solar PV
- Wind farm
- Indication
- Dry insulation
- Liquid immersed insulation
- Type
- Distribution transformers
- Power transformers
- Others
- Capacity
- 5 MVA to 100 MVA
- 100 MVA to 500 MVA
- 500 MVA and Above
- Geography
- APAC
- Australia
- China
- India
- Japan
- South Korea
- Europe
- France
- Germany
- UK
- North America
- US
- Canada
- South America
- Middle East and Africa
- APAC
By Application Insights
The solar PV segment is estimated to witness significant growth during the forecast period. The renewable energy transformers market is experiencing significant growth due to the increasing adoption of renewable energy sources, such as solar power and wind power, in response to climate change concerns and the depletion of fossil fuel reserves. Renewable energy systems, including solar power plants and wind farms, require electrical infrastructure to transmit and distribute the energy they generate. Transformers play a crucial role in this process, converting voltage levels and facilitating bidirectional power transmission for grid stability. Renewable energy projects, such as commercial end-user industries, private organizations, educational institutions, storage facilities, department stores, and urban areas, are increasingly investing in sustainable energy solutions to reduce their carbon footprint and meet sustainability goals.
The integration of sustainable energy technologies into the power grid infrastructure is essential for the successful implementation of these projects. Transformers used in sustainable energy systems must be designed to withstand severe weather conditions and meet the voltage demands and load profiles of various environmental circumstances. Specialized equipment, such as liquid-immersed transformers and dry-type transformers, are used in offshore wind farms and large transformer installations to ensure optimal performance and grid stability. Eco-friendly transformers, made from insulating materials and magnetic cores with minimal environmental impact, are becoming increasingly popular in the market. The market's growth is further driven by the declining production costs of sustainable energy sources and the increasing public awareness of the need for clean energy sources to mitigate greenhouse gas emissions and reduce energy consumption.
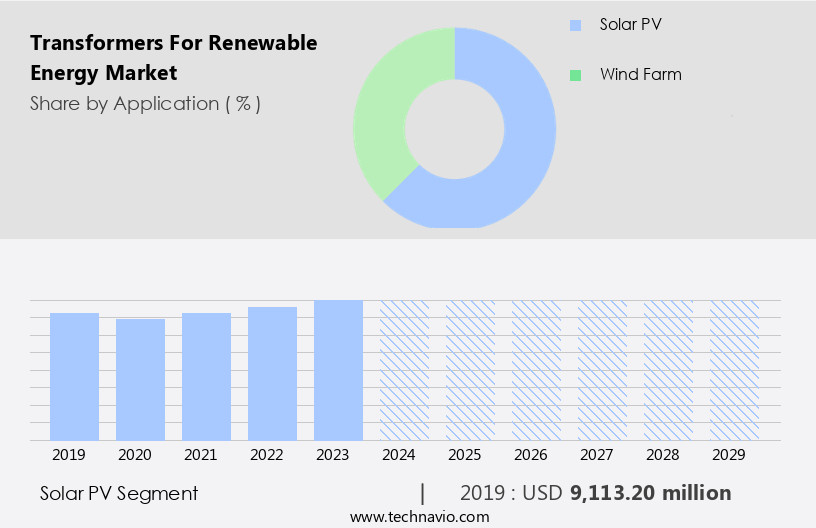
Get a glance at the market report of share of various segments Request Free Sample
The solar PV segment was valued at USD 9.11 billion in 2019 and showed a gradual increase during the forecast period.
Regional Analysis
APAC is estimated to contribute 74% to the growth of the global market during the forecast period.Technavio's analysts have elaborately explained the regional trends and drivers that shape the market during the forecast period.

For more insights on the market size of various regions, Request Free Sample
The APAC region is experiencing significant growth in the sustainable energy transformers market due to increasing demand for sustainable energy sources and high electricity consumption. Countries like India are prioritizing renewable power generation with ambitious goals, driving market expansion. Urbanization and improved living standards in major economies, such as China and India, are escalating electricity demand. Private organizations are increasingly operating utility companies to ensure efficient electricity production and distribution. Renewable energy systems, including wind farms and solar power plants, are integral to this transition, reducing carbon impact and contributing to sustainable energy systems. Grid stability is crucial in integrating sustainable energy facilities, necessitating advanced transformer technologies.
Transmission power, bidirectional power transmission, and smart grid solutions are essential for managing energy generated from renewable sources. Key sectors, including commercial end-users, educational institutions, storage facilities, department stores, and residential and commercial properties, are adopting sustainable energy solutions to reduce their carbon footprint and meet sustainability goals. Insulating materials, magnetic cores, and environmental effect designs are crucial considerations for specialized transformers in severe weather conditions and large transformer installations. The market for renewable energy technologies, including solar power, wind power, and hydropower generation, is expanding, necessitating the development of eco-friendly transformers for grid integration and energy efficiency.
Market Dynamics
Our researchers analyzed the data with 2024 as the base year, along with the key drivers, trends, and challenges. A holistic analysis of drivers will help companies refine their marketing strategies to gain a competitive advantage.
What are the key market drivers leading to the rise in the adoption of Transformers For the Renewable Energy Industry?
- The shift in focus of government bodies toward renewable energy is the key driver of the market. The market is experiencing significant growth due to increasing global awareness of the benefits of clean energy sources. Renewable power generation capacity is expanding, with China projected to grow at a steady rate year over year until 2035. This expansion is primarily occurring in the renewable energy sector as countries shift towards reducing their carbon emissions and decreasing reliance on fossil fuels.
- End-users are embracing sustainable energy sources, such as wind and solar, in place of traditional power generators. This trend is driven by both environmental concerns and the depletion of fossil fuel resources. The transition to sustainable energy is a critical step towards sustainable energy production and consumption.
What are the market trends shaping the Transformers For Renewable Energy Industry?
- The rising number of offshore wind farm installations is the upcoming market trend. The integration of solar photovoltaic (PV) systems with energy storage solutions addresses the intermittency challenge in sustainable energy. Solar PV alone cannot fulfill the power requirements of a building due to its dependent nature on sunlight.
- Energy storage systems enable excess solar power to be stored and released during periods of demand or when sunlight is insufficient. This integration is crucial for homes, as solar energy can be utilized during the day, and the stored energy can be used at night or during inclement weather. By reducing reliance on grid power, energy storage systems enhance cost savings through self-consumption.
What challenges does the Transformers For Renewable Energy Industry face during its growth?
- The high cost of upgrading electricity distribution networks is a key challenge affecting the industry's growth. The intermittency of solar energy, influenced by weather conditions and time of day, poses challenges for the electrical grid in ensuring a stable and reliable power supply. Solar energy, as a less consistent energy source, necessitates careful management. Transformers play a vital role in mitigating these challenges by efficiently managing the flow of electricity from sustainable energy sources to the grid.
- Despite the intermittency issues, the market continues to grow due to the increasing adoption of sustainable energy sources and advancements in transformer technology. Transformers enable the integration of sustainable energy into the grid, enhancing its reliability and stability.
Exclusive Customer Landscape
The market forecasting report includes the adoption lifecycle of the market, covering from the innovator's stage to the laggard's stage. It focuses on adoption rates in different regions based on penetration. Furthermore, the market report also includes key purchase criteria and drivers of price sensitivity to help companies evaluate and develop their market growth analysis strategies.
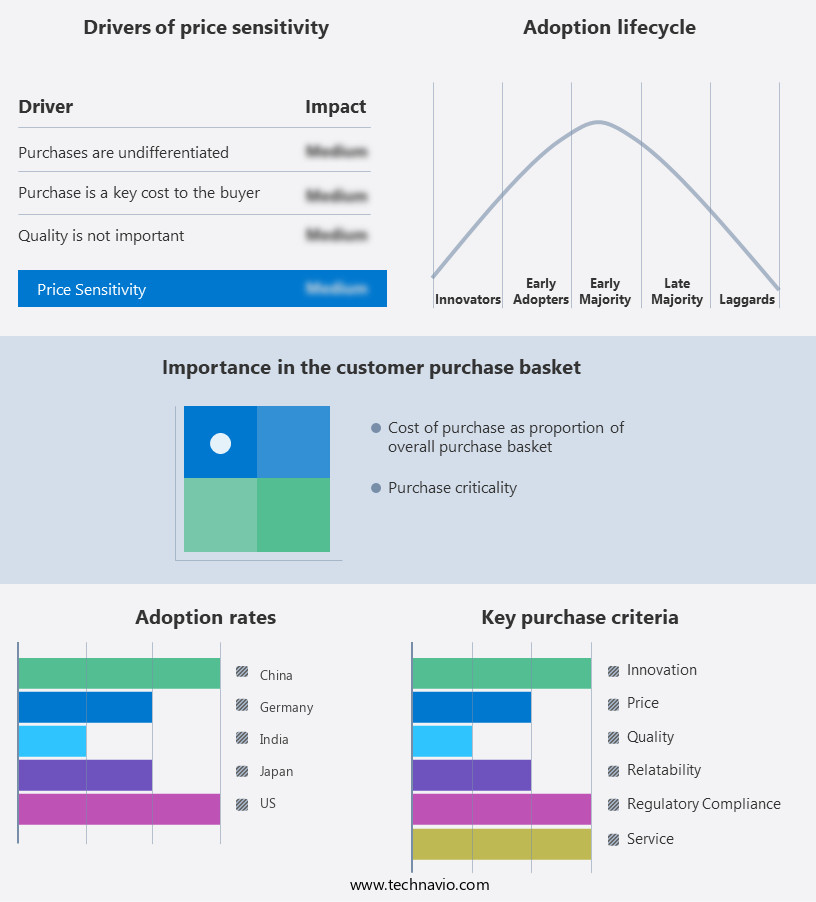
Customer Landscape
Key Companies & Market Insights
Companies are implementing various strategies, such as strategic alliances, market forecast, partnerships, mergers and acquisitions, geographical expansion, and product/service launches, to enhance their presence in the industry.
Bharat Heavy Electricals Ltd. - The company offers transformers for renewable energy such as NIT 54578, NIT 54603 power transformers for solar projects.
The industry research and growth report includes detailed analyses of the competitive landscape of the market and information about key companies, including:
- CG Power and Industrial Solutions Ltd.
- Daihen Corp.
- Eaton Corp. plc
- ENERCON GmbH
- Esennar Transformers Pvt. Ltd.
- General Electric Co.
- Hitachi Ltd.
- LC Magnetics Inc.
- Marsons Energy Pvt. Ltd.
- Northern Transformer
- S.E.A. Societa Elettromeccanica Arzignanese S.p.A.
- Schneider Electric SE
- Siemens AG
- STC Inc.
- Synergy Transformers Pvt. Ltd.
- TESLA TRANSFORMERS (GLOBAL) Pvt. Ltd.
- Voltamp Transformers Ltd
- Westrafo Srl.
Qualitative and quantitative analysis of companies has been conducted to help clients understand the wider business environment as well as the strengths and weaknesses of key industry players. Data is qualitatively analyzed to categorize companies as pure play, category-focused, industry-focused, and diversified; it is quantitatively analyzed to categorize companies as dominant, leading, strong, tentative, and weak.
Research Analyst Overview
The market is witnessing significant growth as the global shift towards sustainable energy sources continues. Renewable energy transformers play a crucial role in this transition by facilitating the electrical infrastructure required for renewable energy systems. These transformers enable the conversion and transmission of energy from various renewable energy sources, such as solar power and wind power, into a usable form for commercial end-users and grid integration. Renewable energy transformers are essential components of sustainable energy systems, reducing carbon impact and contributing to climate change mitigation efforts. The integration of renewable energy sources into the electrical grid necessitates the use of specialized transformers designed to handle the unique characteristics of these energy sources.
Further, the increasing adoption of sustainable energy sources is driving the demand for electrical infrastructure upgrades and the installation of new transformers. Renewable energy projects, such as wind farms and solar power plants, require advanced transformers capable of handling bidirectional power transmission and grid stability. The integration of renewable energy sources into the power grid requires transformers that can efficiently manage the varying load profiles and environmental circumstances. The use of sustainable energy sources, such as solar power and wind power, is becoming increasingly popular among private organizations, educational institutions, and residential and commercial properties. The growing awareness of sustainability goals and the need to reduce carbon footprints is driving the demand for green energy solutions.
In addition, the digitalization transformation in various sectors, including urban areas, is also contributing to the growth of the renewable energy transformers market. Transmission power lines and energy installations require advanced transformers to ensure electricity availability in remote places and unconventional energy sources. The production costs of renewable energy sources, such as solar power and wind power, have been decreasing, making them increasingly competitive with traditional energy sources like fossil fuels and natural gas. However, the integration of renewable energy sources into the power grid requires specialized equipment and transformers to ensure grid stability and efficient energy transmission. The design of sustainable energy transformers takes into account environmental effect designs to minimize the carbon footprint and improve energy efficiency.
Moreover, the integration of hydropower capacity into local power grids supports electricity production in areas with limited access to traditional electrical supply. However, initial investment and standardization issues present challenges, especially when installing large transformers or distribution transformers for efficient distribution systems. Performance optimization of electricity production plants and transmission facilities is essential for long-term sustainability. Additionally, dry-type power transformers are gaining traction due to their reliability and minimal environmental impact. As population growth increases, ensuring the resilience and scalability of electrical power systems will be crucial for providing consistent energy to all end customers, including those in rural communities.
|
Market Scope |
|
|
Report Coverage |
Details |
|
Page number |
233 |
|
Base year |
2024 |
|
Historic period |
2019-2023 |
|
Forecast period |
2025-2029 |
|
Growth momentum & CAGR |
Accelerate at a CAGR of 4.6% |
|
Market growth 2025-2029 |
USD 4.03 Billion |
|
Market structure |
Fragmented |
|
YoY growth 2024-2025(%) |
4.4 |
|
Key countries |
China, India, Japan, US, South Korea, Australia, Germany, UK, Canada, and France |
|
Competitive landscape |
Leading Companies, Market Positioning of Companies, Competitive Strategies, and Industry Risks |
What are the Key Data Covered in this Market Research and Growth Report?
- CAGR of the Transformers For Renewable Energy industry during the forecast period
- Detailed information on factors that will drive the market growth and forecasting between 2025 and 2029
- Precise estimation of the size of the market and its contribution of the industry in focus to the parent market
- Accurate predictions about upcoming growth and trends and changes in consumer behaviour
- Growth of the market across APAC, Europe, North America, South America, and Middle East and Africa
- Thorough analysis of the market's competitive landscape and detailed information about companies
- Comprehensive analysis of factors that will challenge the market growth and forecasting
We can help! Our analysts can customize this market research report to meet your requirements.