Transimpedance Amplifiers Market Size 2025-2029
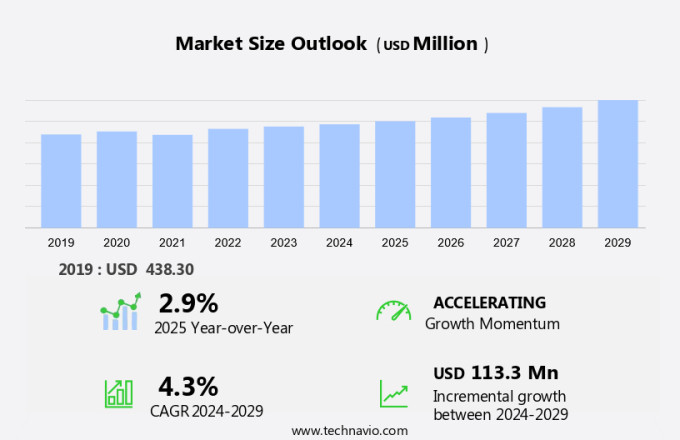
The transimpedance amplifiers market size is forecast to increase by USD 113.3 million, at a CAGR of 4.3% between 2024 and 2029.
- The Transimpedance Amplifiers (TIA) market is experiencing significant growth, driven by the increasing demand for high-performance amplifiers in various applications. TIA's unique ability to convert input voltage to output current makes them indispensable in signal conditioning, instrumentation, and communication systems. Product launches and technological advancements continue to shape the market landscape, with manufacturers focusing on improving the performance, efficiency, and functionality of their offerings. However, noise management remains a critical challenge for TIA manufacturers. The presence of electrical and acoustic noise in signals can significantly impact the accuracy and reliability of amplifier output. Effective noise reduction techniques, such as shielding, grounding, and filtering, are essential to mitigate these issues and ensure optimal performance.
- Navigating the TIA market requires companies to stay abreast of technological advancements and address the challenges of noise management. By investing in research and development and implementing robust design strategies, manufacturers can capitalize on the market's growth potential and meet the evolving demands of their customers.
What will be the Size of the Transimpedance Amplifiers Market during the forecast period?
Explore in-depth regional segment analysis with market size data - historical 2019-2023 and forecasts 2025-2029 - in the full report.
Request Free Sample
Transimpedance amplifiers (TIAs) are a crucial component in various applications due to their ability to convert current signals into voltage signals with high precision. The market for TIAs is continually evolving, driven by advancements in semiconductor technology and the increasing demand for signal conditioning in diverse sectors. TIAs are integral to control systems, industrial automation, sensor networks, and data acquisition systems, among others. Their output impedance, open-loop gain, power consumption, and phase margin are essential factors that influence their performance in these applications. Integrated circuits, including operational amplifiers and field-programmable gate arrays, are increasingly being utilized to enhance the functionality and efficiency of TIAs.
Optical sensing and light measurement are emerging areas where TIAs play a significant role. The integration of TIAs with optical communication systems and scientific research is expanding the scope of their applications. The Internet Of Things (Iot) is another sector that is benefiting from the use of TIAs in current-to-voltage conversion and signal processing. The ongoing development of TIAs is characterized by advancements in gain-bandwidth product, slew rate, noise performance, temperature stability, and design automation. These improvements are enabling TIAs to meet the stringent requirements of precision instrumentation, biomedical imaging, software-defined radio, and high-speed data acquisition. Testing and characterization, circuit simulation, and stability analysis are essential aspects of TIA design and optimization.
The continuous evolution of TIAs is ensuring their relevance in a wide range of applications, from signal conditioning in industrial automation to scientific research and biomedical imaging.
How is this Transimpedance Amplifiers Industry segmented?
The transimpedance amplifiers industry research report provides comprehensive data (region-wise segment analysis), with forecasts and estimates in "USD million" for the period 2025-2029, as well as historical data from 2019-2023 for the following segments.
- Product Type
- High-gain TIA
- Wideband TIA
- Low-gain TIA
- End-user
- Telecommunications
- Healthcare
- Automotive
- Others
- Geography
- North America
- US
- Canada
- Europe
- Germany
- UK
- APAC
- Australia
- China
- India
- Japan
- South Korea
- South America
- Brazil
- Rest of World (ROW)
- North America
.
By Product Type Insights
The high-gain TIA segment is estimated to witness significant growth during the forecast period.
The transimpedance amplifier (TIA) market is witnessing significant growth, particularly in the high-gain segment. This expansion is fueled by the increasing demand for high-performance optical communication systems and advanced data transmission solutions. High-gain TIAs are crucial in applications where amplifying weak input signals with minimal noise and distortion is essential. These applications span various industries, including telecommunications, data centers, and scientific research. Semiconductor technology advances have led to innovations such as Semtech Corporation's introduction of the GN1816, a high-gain PAM4 TIA designed for short-reach data center applications. This compact TIA enables very high-density single-mode fiber installations, reflecting the ongoing trend toward miniaturization and enhanced performance in the TIA market.
In the realm of industrial automation and sensor networks, TIAs play a vital role in signal conditioning and current-to-voltage conversion. The integration of TIAs in control systems and precision instrumentation has led to improved system integration, performance optimization, and frequency response. Furthermore, the emergence of the Internet of Things (IoT) and software-defined radio has expanded the application scope of TIAs in data acquisition systems. Noise performance and temperature stability are critical factors in TIA design, as these components can significantly impact the overall system's performance. Circuit simulation and testing and characterization are essential in ensuring the optimal design and functionality of TIAs.
Additionally, the use of field-programmable gate arrays (FPGAs) and analog design in TIA development allows for design automation and flexibility in various applications. In summary, the transimpedance amplifier market is experiencing growth, driven by the increasing demand for high-performance optical communication systems, data transmission solutions, and signal conditioning applications. Innovations in semiconductor technology and design automation continue to push the boundaries of TIA performance, enabling miniaturization and enhanced functionality in various industries.
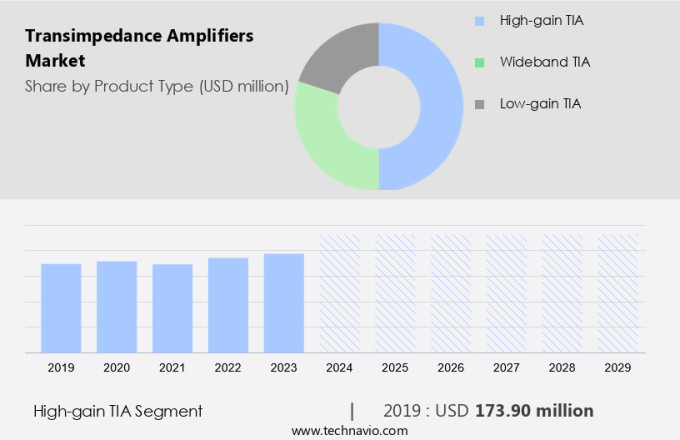
The High-gain TIA segment was valued at USD 173.90 million in 2019 and showed a gradual increase during the forecast period.
Regional Analysis
APAC is estimated to contribute 55% to the growth of the global market during the forecast period. Technavio’s analysts have elaborately explained the regional trends and drivers that shape the market during the forecast period.
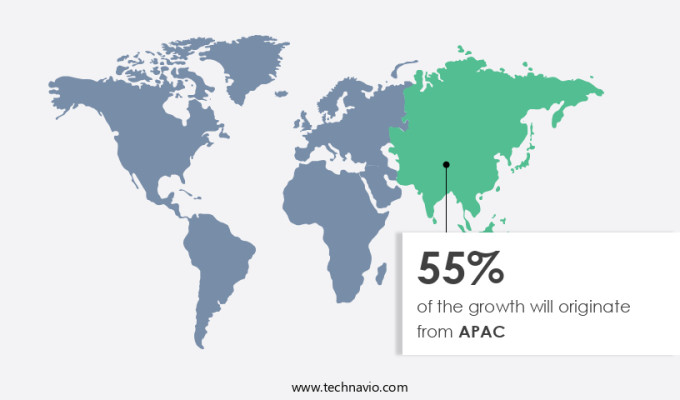
The transimpedance amplifier (TIA) market is witnessing significant growth, particularly in the Asia-Pacific (APAC) region. Driven by industrialization, technological advancements, and substantial investments in semiconductor manufacturing, APAC is becoming a major player in the global TIA market. The region's electronics market expansion and increasing demand for high-speed data transmission and advanced communication systems are key factors fueling this growth. Notably, Foxconn Technology Group and STMicroelectronics NV announced a partnership in September 2023 to construct a semiconductor manufacturing plant in India. This initiative underscores the strategic importance of expanding semiconductor manufacturing in APAC, as the region's demand for advanced electronic components and systems continues to rise.
TIAs are integral to various applications, including optical sensing, light measurement, industrial automation, sensor networks, and signal conditioning. Their role in current-to-voltage conversion, gain-bandwidth product, and noise performance is crucial in these applications. In the field of scientific research, TIAs are employed in data acquisition systems, frequency response analysis, and system integration for performance optimization. Precision instrumentation, such as transimpedance amplifiers, is essential in biomedical imaging and stability analysis. The integration of TIAs in the Internet of Things (IoT) and software-defined radio systems has led to advancements in closed-loop gain and high-speed data acquisition. Operational amplifiers, feedback networks, and signal processing are critical components of TIA design, with semiconductor technology playing a significant role in enhancing their performance.
Temperature stability and circuit simulation are essential considerations in TIA design and testing and characterization. In summary, the TIA market is experiencing robust growth, particularly in the APAC region, due to industrialization, technological advancements, and semiconductor manufacturing expansion. TIAs are essential components in various applications, including optical communication, industrial automation, and scientific research. Their role in current-to-voltage conversion, gain-bandwidth product, noise performance, and signal conditioning is crucial. The integration of TIAs in IoT, software-defined radio systems, and precision instrumentation is driving innovation and performance optimization.
Market Dynamics
Our researchers analyzed the data with 2024 as the base year, along with the key drivers, trends, and challenges. A holistic analysis of drivers will help companies refine their marketing strategies to gain a competitive advantage.
What are the key market drivers leading to the rise in the adoption of Transimpedance Amplifiers Industry?
- The market is propelled forward by the escalating demand for high-performance amplifiers.
- The Transimpedance Amplifier (TA) market is experiencing significant growth due to the increasing demand for high-performance TAs in advanced optical communication systems. These systems support higher data rates and greater efficiency, driving the market forward. Notably, Broadcom Inc. Introduced the BCM85812 in March 2023, a 5nm 100G/lane optical PAM-4 DSP PHY with an integrated TA and laser driver. This component, optimized for 800G DR8, 2x400G FR4, and 800G AOC module applications, offers superior performance and energy efficiency. Built on Broadcom's established 5nm 112G PAM-4 DSP platform, the BCM85812 is a vital component for hyperscale data centers and cloud service providers.
- Analog-to-digital conversion, closed-loop gain, software defined radio, high-speed data acquisition, slew rate, design automation, analog design, input offset voltage, field-programmable gate arrays, and signal processing are all integral aspects of TA technology, contributing to its increasing importance in various industries.
What are the market trends shaping the Transimpedance Amplifiers Industry?
- Product launches have emerged as the latest market trend. It is essential for businesses to stay informed and prepared for these events to remain competitive.
- The Transimpedance Amplifiers (TIA) market is experiencing significant growth due to the increasing demand for high-performance, low-power solutions in advanced applications, including artificial intelligence (AI) and hyperscale data centers. One recent innovation is the Teal 200, a 4 x 50Gbps TIA introduced by Credo Technology Group Holding Ltd in September 2023. Designed for use in QSFP56, QSFP-DD, and OSFP optical transceivers, as well as active optical cables (AOCs), this TIA targets high-volume, power-conscious applications. Its introduction addresses the critical need for energy-efficient components in the expanding AI and hyperscoutput impedance: The Teal 200 is a 4 x 50Gbps TIA designed for use in QSFP56, QSFP-DD, and OSFP optical transceivers, as well as active optical cables (AOCs).
- This product targets high-volume, low-power applications, making it an ideal solution for the rapidly expanding AI and Hyperscale Data Center markets. With an open-loop gain of [insert gain value], the Teal 200 offers superior performance, while its power consumption is kept to a minimum. The TIA market is expected to continue growing as control systems, sensor networks, and optical sensing applications in industries such as industrial automation and light measurement increasingly require high-performance, low-power solutions. The demand for TIAs with input bias current as low as possible and optimal phase margin is also driving market growth.
What challenges does the Transimpedance Amplifiers Industry face during its growth?
- The effective management of noise is a significant challenge that can hinder industrial growth. It is essential for businesses to implement robust noise control strategies to mitigate its negative impacts and ensure continued industry expansion.
- Transimpedance Amplifiers (TIAs) play a vital role in applications demanding high-bandwidth and low-noise performance, particularly in the realm of signal conditioning for optical communication systems. Effective noise management is crucial in TIA applications to preserve signal integrity and maintain a favorable signal-to-noise ratio (SNR). In high-gain settings, even minimal noise can significantly impact system performance. As TIAs strive for higher bandwidths and gains, managing noise becomes increasingly complex. In the context of the Internet of Things (IoT), TIAs are essential for current-to-voltage conversion in various sensor applications. The gain-bandwidth product of TIAs is a critical specification, as it determines the maximum frequency at which the amplifier can provide a specified gain.
- Semiconductor technology advances have led to improved noise performance in TIAs, making them indispensable in various industries, including telecommunications, healthcare, and industrial automation. The feedback network design in TIAs is another crucial factor affecting noise performance. By employing advanced design techniques and optimizing feedback networks, manufacturers can minimize noise and enhance overall TIA performance.
Exclusive Customer Landscape
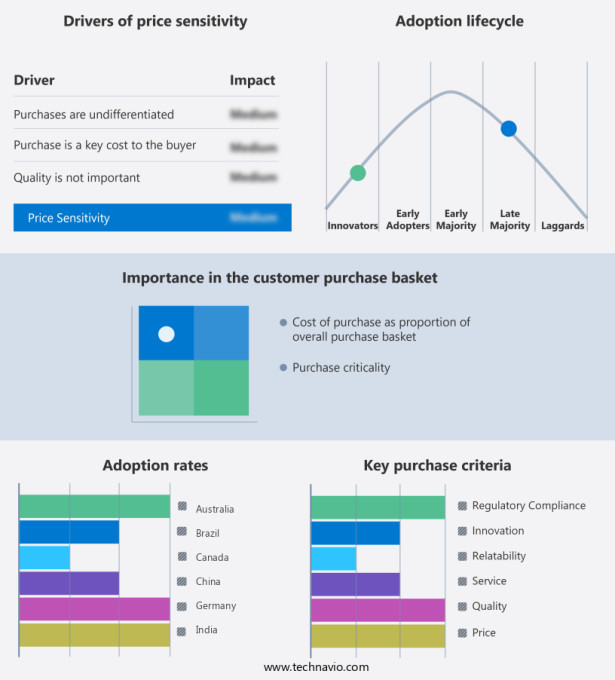
The transimpedance amplifiers market forecasting report includes the adoption lifecycle of the market, covering from the innovator’s stage to the laggard’s stage. It focuses on adoption rates in different regions based on penetration. Furthermore, the transimpedance amplifiers market report also includes key purchase criteria and drivers of price sensitivity to help companies evaluate and develop their market growth analysis strategies.
Customer Landscape
Key Companies & Market Insights
Companies are implementing various strategies, such as strategic alliances, transimpedance amplifiers market forecast, partnerships, mergers and acquisitions, geographical expansion, and product/service launches, to enhance their presence in the industry.
Analog Devices Inc. - This company specializes in advanced optical transimpedance amplifiers (OTAs), delivering high-performance, single-chip solutions for converting photodiode current into a differential voltage input.
The industry research and growth report includes detailed analyses of the competitive landscape of the market and information about key companies, including:
- Analog Devices Inc.
- Broadcom Inc.
- FEMTO Messtechnik GmbH
- Gigahertz Optik GmbH
- Infineon Technologies AG
- Lumentum Holdings Inc.
- MACOM Technology Solutions Inc.
- Marvell Technology Inc.
- Mouser Electronics Inc.
- NXP Semiconductors NV
- Qorvo Inc.
- Renesas Electronics Corp.
- Semtech Corp.
- STMicroelectronics NV
- Texas Instruments Inc.
- Thorlabs Inc.
Qualitative and quantitative analysis of companies has been conducted to help clients understand the wider business environment as well as the strengths and weaknesses of key industry players. Data is qualitatively analyzed to categorize companies as pure play, category-focused, industry-focused, and diversified; it is quantitatively analyzed to categorize companies as dominant, leading, strong, tentative, and weak.
Recent Development and News in Transimpedance Amplifiers Market
- In February 2023, Texas Instruments, a leading semiconductor manufacturer, introduced the LMZ39922-Q1, a high-performance transimpedance amplifier (TIA) with industry-leading gain and bandwidth for precision data conversion applications (Texas Instruments Press Release). This new product launch caters to the growing demand for high-precision data acquisition in various industries, including healthcare, automotive, and industrial automation.
- In May 2024, Analog Devices, Inc., a prominent player in the transimpedance amplifier market, announced a strategic collaboration with Microsoft to develop advanced sensing solutions for IoT applications using Analog Devices' transimpedance amplifiers and Microsoft's Azure Sphere platform (Analog Devices Press Release). This partnership aims to accelerate the development and deployment of IoT applications, particularly in the industrial and consumer sectors.
- In October 2024, Hittite Microwave Corporation, a leading provider of microwave, millimeter wave, power, and radio frequency (RF) components and sub-systems, completed the acquisition of the transimpedance amplifier business from Analog Devices, Inc. (Hittite Microwave Corporation Press Release). This acquisition significantly expanded Hittite Microwave's product portfolio and market reach in the transimpedance amplifier market.
- In January 2025, Infineon Technologies AG, a global leader in semiconductors, announced the launch of its new family of high-performance transimpedance amplifiers, the BSC037x series, designed for industrial and automotive applications (Infineon Technologies AG Press Release). These new TIAs offer superior noise performance and high input impedance, making them suitable for various data acquisition applications in these industries.
Research Analyst Overview
- The Transimpedance Amplifier (TIA) market encompasses various applications, particularly in high-frequency domains such as optical communications and electromagnetic interference (EMI) mitigation. Optical receivers, utilizing photomultiplier tubes and avalanche photodiodes, require TIAs to convert optical signals into electrical ones. In these applications, stability criteria, such as Nyquist plot and Bode plot analysis, are crucial for frequency compensation and voltage headroom. Thermal drift and dynamic range are significant concerns in TIA design for optical fiber communications. Current source and feedback resistor optimization are essential for maintaining signal integrity and offset cancellation. Noise filtering through capacitive feedback plays a vital role in enhancing the reliability of TIAs in data transmission.
- In high-frequency applications, pulse response and circuit optimization are essential to minimize settling time and ensure output swing. TIAs are also employed in low-noise amplifiers for EMI reduction, requiring stringent stability criteria and input range specifications. Laser diodes and light-emitting diodes are integral to numerous TIA applications, necessitating precise design considerations for thermal management and electromagnetic compatibility. In summary, the TIA market demands continuous innovation to address the evolving requirements of high-frequency applications, including optical communications, EMI mitigation, and signal integrity.
Dive into Technavio’s robust research methodology, blending expert interviews, extensive data synthesis, and validated models for unparalleled Transimpedance Amplifiers Market insights. See full methodology.
|
Market Scope |
|
|
Report Coverage |
Details |
|
Page number |
209 |
|
Base year |
2024 |
|
Historic period |
2019-2023 |
|
Forecast period |
2025-2029 |
|
Growth momentum & CAGR |
Accelerate at a CAGR of 4.3% |
|
Market growth 2025-2029 |
USD 113.3 million |
|
Market structure |
Fragmented |
|
YoY growth 2024-2025(%) |
2.9 |
|
Key countries |
US, China, Japan, India, Canada, South Korea, UK, Australia, Germany, and Brazil |
|
Competitive landscape |
Leading Companies, Market Positioning of Companies, Competitive Strategies, and Industry Risks |
What are the Key Data Covered in this Transimpedance Amplifiers Market Research and Growth Report?
- CAGR of the Transimpedance Amplifiers industry during the forecast period
- Detailed information on factors that will drive the growth and forecasting between 2025 and 2029
- Precise estimation of the size of the market and its contribution of the industry in focus to the parent market
- Accurate predictions about upcoming growth and trends and changes in consumer behaviour
- Growth of the market across APAC, North America, Europe, South America, and Middle East and Africa
- Thorough analysis of the market’s competitive landscape and detailed information about companies
- Comprehensive analysis of factors that will challenge the transimpedance amplifiers market growth of industry companies
We can help! Our analysts can customize this transimpedance amplifiers market research report to meet your requirements.