Transparent Barrier Packaging Film Market Analysis, Size, and Forecast 2026-2030: APAC (China, Japan, and India), North America (US, Canada, and Mexico), Europe (Germany, France, and UK), Middle East and Africa (Saudi Arabia, UAE, and South Africa), South America (Brazil and Argentina), and Rest of World (ROW)

Transparent Barrier Packaging Film Market Analysis, Size, and Forecast 2026-2030:
APAC (China, Japan, and India), North America (US, Canada, and Mexico), Europe (Germany, France, and UK), Middle East and Africa (Saudi Arabia, UAE, and South Africa), South America (Brazil and Argentina), and Rest of World (ROW)

Published: Dec 2025 316 Pages SKU: IRTNTR70312

Market Overview at a Glance

$8.99 B
Market Opportunity
8.2%
CAGR 2025 - 2030
40.9%
APAC Growth
$10.13 B
Food segment 2024

Transparent Barrier Packaging Film Market Size 2026-2030

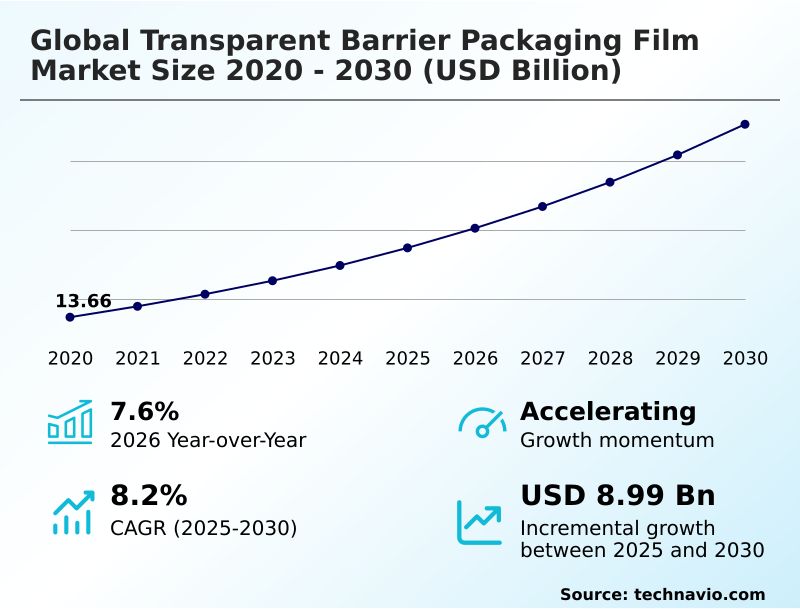
The transparent barrier packaging film market size is valued to increase by USD 8.99 billion, at a CAGR of 8.2% from 2025 to 2030. High demand for transparent barrier packaging film in food industry will drive the transparent barrier packaging film market.

Major Market Trends & Insights

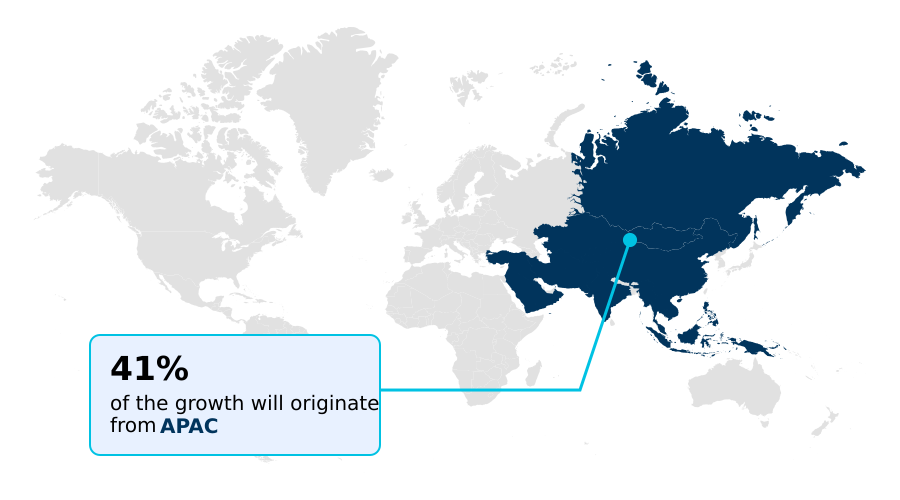
  • APAC dominated the market and accounted for a 40.9% growth during the forecast period.
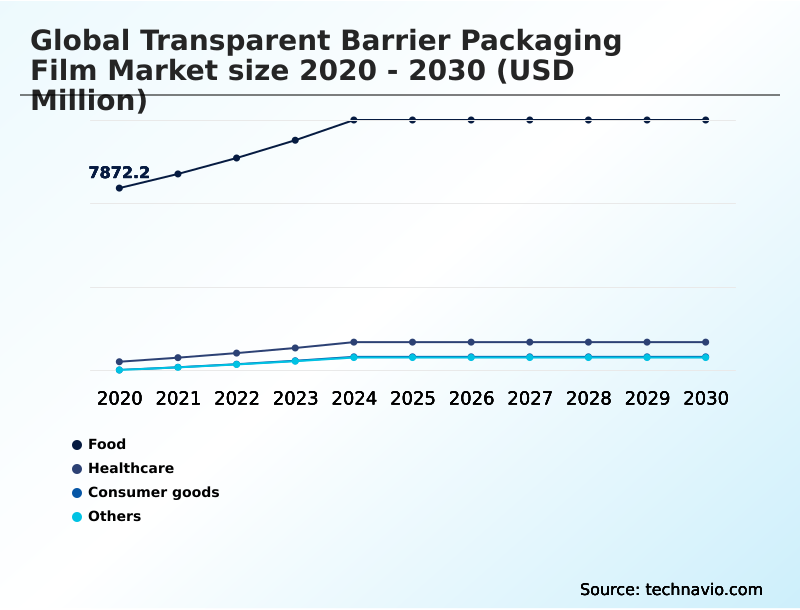
  • By End-user - Food segment was valued at USD 10.13 billion in 2024
  • By Material - Polyethylene segment accounted for the largest market revenue share in 2024

Market Size & Forecast

  • Market Opportunities: USD 14.03 billion
  • Market Future Opportunities: USD 8.99 billion
  • CAGR from 2025 to 2030 : 8.2%

Market Summary

  • The transparent barrier packaging film market is evolving amidst strong demand from the food, pharmaceutical, and consumer goods sectors, which require advanced materials to ensure product safety and extend shelf life. Key drivers include the need for packaging with a low oxygen transmission rate and excellent moisture vapor transmission rate to preserve freshness.
  • A central business scenario involves supply chain optimization, where the adoption of lightweight, high-performance films reduces transportation costs and minimizes spoilage-related losses. However, the industry faces challenges from stringent food contact materials regulations and the high price volatility of raw materials like polymer resins.
  • In response, a significant trend is the shift toward sustainable solutions, including bio-based polymer films and designs aligned with circular economy principles. Innovations in the co-extrusion process and the development of films with superior puncture resistance strength are enabling thinner, more durable packaging.
  • This transition addresses both environmental mandates and consumer preferences for eco-friendly products without compromising the critical barrier properties necessary for product integrity.

What will be the Size of the Transparent Barrier Packaging Film Market during the forecast period?

Get Key Insights on Market Forecast (PDF) Request Free Sample

How is the Transparent Barrier Packaging Film Market Segmented?

The transparent barrier packaging film industry research report provides comprehensive data (region-wise segment analysis), with forecasts and estimates in "USD million" for the period 2026-2030, as well as historical data from 2020-2024 for the following segments.

  • End-user
    • Food
    • Healthcare
    • Consumer goods
    • Others
  • Material
    • Polyethylene
    • Polypropylene
    • Polyethylene terephthalate
    • Ethylene vinyl alcohol
    • Others
  • Type
    • Pouches
    • Wraps and shrink films
    • Flow wraps
    • Lidding films
  • Geography
    • APAC
      • China
      • Japan
      • India
    • North America
      • US
      • Canada
      • Mexico
    • Europe
      • Germany
      • France
      • UK
    • Middle East and Africa
      • Saudi Arabia
      • UAE
      • South Africa
    • South America
      • Brazil
      • Argentina
    • Rest of World (ROW)

By End-user Insights

The food segment is estimated to witness significant growth during the forecast period.

The food segment remains a principal consumer, driven by the demand for effective food preservation films.

Solutions leveraging modified atmosphere packaging and superior aroma barrier properties are critical for extending the usability of fresh produce packaging and complex ready-to-eat meal packaging.

Materials like ethylene vinyl alcohol copolymer, biaxially oriented polyethylene terephthalate, and biaxially oriented polypropylene are instrumental in achieving shelf-life extension technology goals.

As consumer habits evolve, the need for films with high puncture resistance strength and reliable heat sealable films for meat and poultry packaging and dairy product packaging is intensifying.

This segment's expansion is a major factor in market dynamics, contributing over 40% of the industry's incremental growth, particularly in developing economies.

Request Free Sample

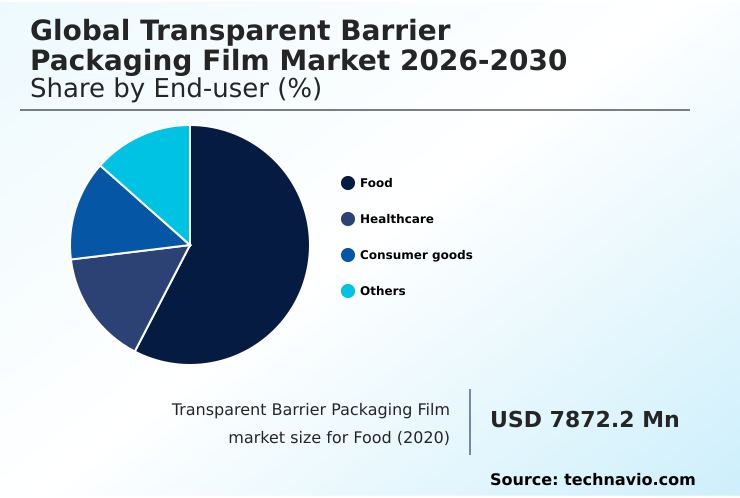
The Food segment was valued at USD 10.13 billion in 2024 and showed a gradual increase during the forecast period.

Request Free Sample

Regional Analysis

APAC is estimated to contribute 40.9% to the growth of the global market during the forecast period.Technavio’s analysts have elaborately explained the regional trends and drivers that shape the market during the forecast period.

See How Transparent Barrier Packaging Film Market Demand is Rising in APAC Request Free Sample

The geographic landscape is led by APAC, which accounts for 40.88% of the market's growth opportunities, driven by rapid urbanization and expanding manufacturing capabilities in countries like China and India.

North America follows, representing 25.54% of the opportunity, with a mature market focused on high-performance applications and sustainability. In Europe, stringent regulations are accelerating the adoption of high-barrier mono-material solutions and bio-based polymer films.

The use of polyvinylidene chloride coating is declining due to environmental concerns, creating opportunities for alternatives. Innovations in the chemical recycling process and smart packaging integration with digital watermarking for sorting are prominent.

Across regions, demand for aseptic packaging material and films from polylactic acid films is growing, especially for cosmetic product protection and aseptic liquid packaging, reflecting a global trend toward sustainable and functional packaging.
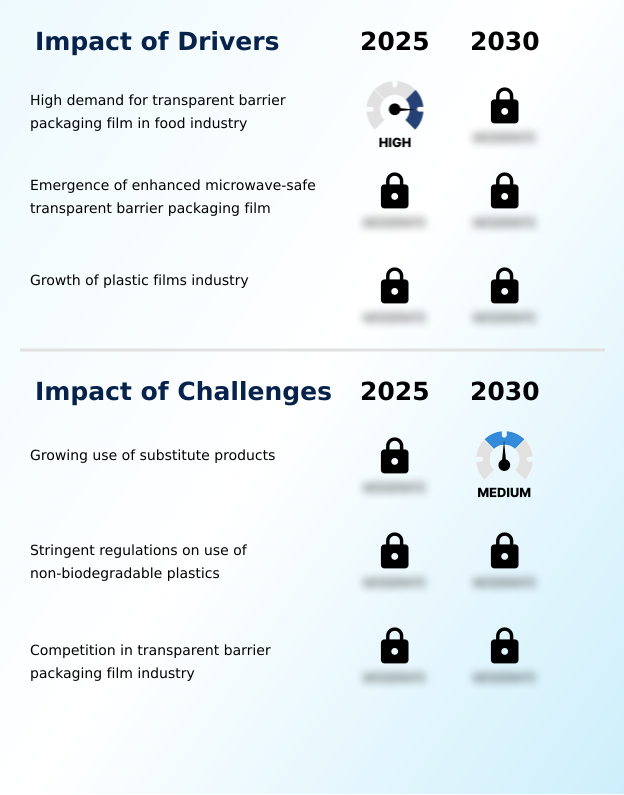
Market Dynamics

Our researchers analyzed the data with 2025 as the base year, along with the key drivers, trends, and challenges. A holistic analysis of drivers will help companies refine their marketing strategies to gain a competitive advantage.

  • Navigating the transition to sustainable packaging requires a deep understanding of material performance and regulatory compliance. A key consideration is the impact of EVOH concentration on recyclability, which directly influences the viability of circular economy models for flexible packaging.
  • For brand owners, selecting the right high barrier films for fresh produce shelf-life is critical for packaging solutions to reduce food waste. This involves evaluating options from transparent barrier films vs metallized films, each offering different benefits.
  • The goal is to achieve downgauging films without losing barrier properties, a technical challenge that advancements in silicon oxide coated films are helping to solve. In the food sector, the focus is on recyclable mono-material for snack food packaging and developing retortable pouches for long shelf-life foods.
  • For meat and cheese, oxygen barrier films are essential, often used with lidding films for modified atmosphere packaging. Improving shelf life with EVOH barrier films is a proven strategy. For other sectors, effective pharmaceutical packaging with high moisture barrier and transparent packaging for premium cosmetic products are top priorities.
  • As companies transition to recyclable high-barrier materials, they must also ensure compliance with food contact material regulations and manage post-consumer recycled content in food packaging. The use of PCR content integration in non-food packaging and finding cost-effective barrier films for consumer goods are also key parts of this strategic shift.
  • This holistic approach ensures barrier film solutions for e-commerce shipping are both effective and sustainable.

What are the key market drivers leading to the rise in the adoption of Transparent Barrier Packaging Film Industry?

  • High demand for transparent barrier packaging film from the food industry is a key driver propelling market growth.

  • The market's expansion is fueled by the increasing demand for convenience and product protection across multiple sectors.
  • The development of microwaveable food packaging, which can reduce consumer preparation time by over 60%, relies on advanced flexible packaging laminates and cold seal adhesives. Innovations like anti-fog additives and UV protection films enhance product visibility and integrity.
  • The co-extrusion process and plasma enhanced chemical vapor deposition techniques are enabling lightweighting packaging design, reducing material usage by up to 25% without compromising barrier performance.
  • Furthermore, the growth of e-commerce necessitates tamper-evident packaging features and child-resistant packaging solutions for safety. This drive for functional, user-friendly formats, including single-serve portion packs, supports the broader adoption of advanced films offering superior shelf-life extension technology.

What are the market trends shaping the Transparent Barrier Packaging Film Industry?

  • A significant market trend is the rising demand for high-performance specialty barrier films, driven by the need for advanced packaging solutions offering superior protective properties.

  • A dominant trend is the industry's pivot toward sustainable barrier solutions, driven by stringent regulations and consumer demand. The implementation of the extended producer responsibility scheme is compelling manufacturers to design for circular economy principles, significantly boosting demand for materials with high mechanical recycling compatibility.
  • Innovations in advanced recycling are now enabling the recovery of over 90% of polymers from post-consumer recycled content, making it a viable feedstock for pharmaceutical grade films. Furthermore, the development of bio-based materials is advancing, with compostable packaging films and those using biodegradable polymer technology achieving barrier performance within 15% of their traditional counterparts.
  • This transition is crucial for supply chain waste reduction and improving the overall product-to-package ratio optimization through sustainable material sourcing and compliance with food contact materials regulation.

What challenges does the Transparent Barrier Packaging Film Industry face during its growth?

  • The growing adoption of alternative materials and substitute products presents a key challenge to the industry's growth.

  • The market confronts notable challenges, including intense competition from substitute materials and price volatility. Non-transparent options like aluminum foil, which boast recycling rates exceeding 70% in some regions, present a significant challenge to plastic-based recyclable flexible packaging.
  • Moreover, fluctuations in polymer resin prices can impact manufacturer profit margins by over 10% in a single quarter, complicating cost structures for products like retortable pouch technology and lidding film applications. The push for downgauging film thickness to create more sustainable mono-material pouch construction faces technical hurdles in maintaining a low moisture vapor transmission rate and adequate puncture resistance.
  • The industry must also contend with the perception of fiber-based barrier packaging as a more eco-friendly alternative, affecting demand for films used in vacuum skin packaging and medical device sterile packaging.

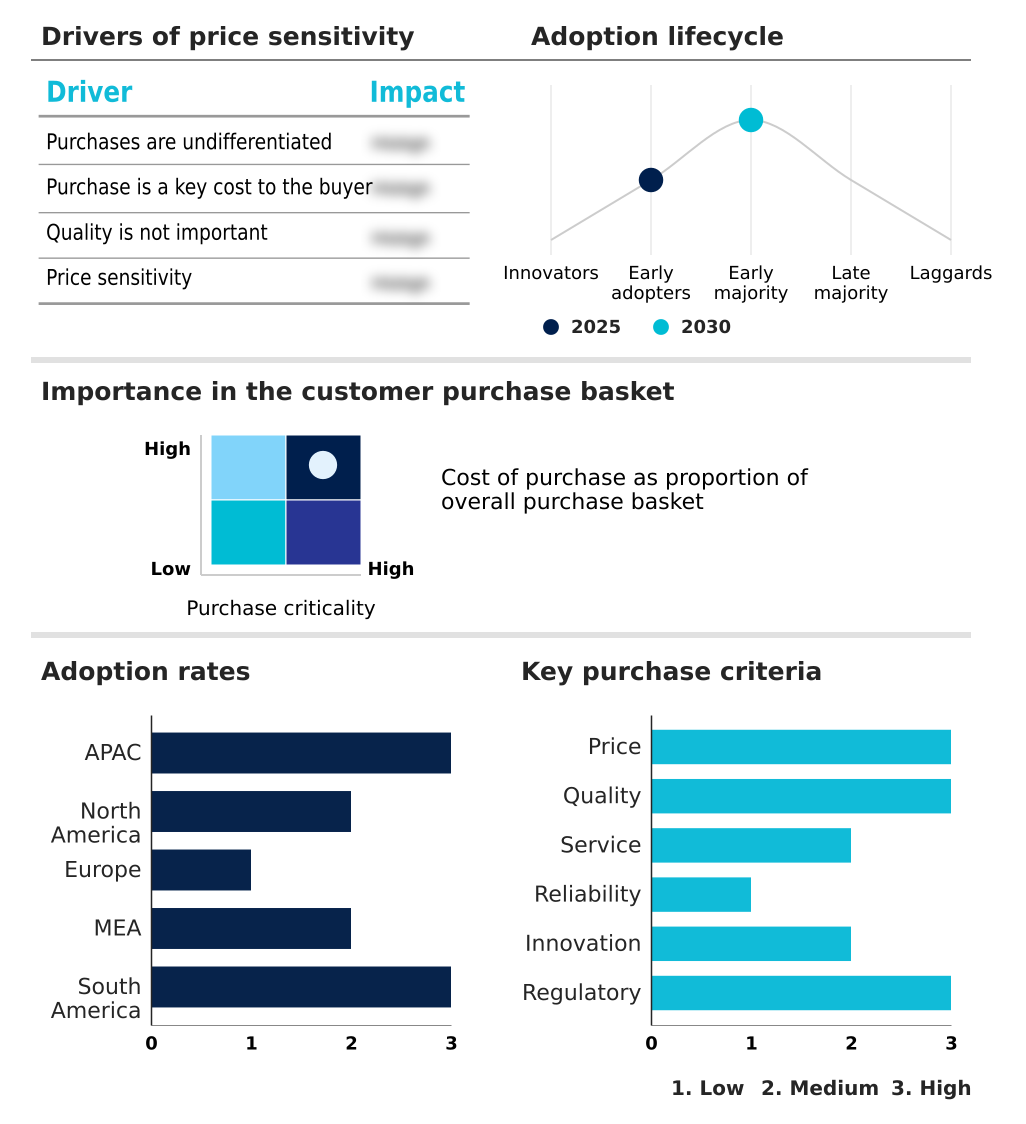
Exclusive Technavio Analysis on Customer Landscape

The transparent barrier packaging film market forecasting report includes the adoption lifecycle of the market, covering from the innovator’s stage to the laggard’s stage. It focuses on adoption rates in different regions based on penetration. Furthermore, the transparent barrier packaging film market report also includes key purchase criteria and drivers of price sensitivity to help companies evaluate and develop their market growth analysis strategies.

Customer Landscape of Transparent Barrier Packaging Film Industry

Competitive Landscape

Companies are implementing various strategies, such as strategic alliances, transparent barrier packaging film market forecast, partnerships, mergers and acquisitions, geographical expansion, and product/service launches, to enhance their presence in the industry.

3M Co. - Analysis indicates a focus on metal-free laminates, delivering high-barrier protection and enhanced recyclability for product integrity and sustainability.

The industry research and growth report includes detailed analyses of the competitive landscape of the market and information about key companies, including:

  • 3M Co.
  • Amcor Plc
  • CCL Industries Inc.
  • Celplast Metallized Products
  • Cosmo Films Ltd.
  • DUO PLAST AG
  • DuPont de Nemours Inc.
  • Glenroy Inc.
  • Huhtamaki Oyj
  • KP Holding GmbH and Co. KG
  • Mitsubishi Chemical Grp.
  • Mondi Plc
  • Sealed Air Corp.
  • Sonoco Products Co.
  • Sumilon Polyester Ltd.
  • Taghleef Industries SpA
  • Toppan Inc.
  • UFlex Ltd.
  • Winpak Ltd.

Qualitative and quantitative analysis of companies has been conducted to help clients understand the wider business environment as well as the strengths and weaknesses of key industry players. Data is qualitatively analyzed to categorize companies as pure play, category-focused, industry-focused, and diversified; it is quantitatively analyzed to categorize companies as dominant, leading, strong, tentative, and weak.

Recent Development and News in Transparent barrier packaging film market

  • In May 2025, Mitsubishi Chemical Group received recognition from the Association of Plastic Recyclers for its SoarnoL EVOH resins, confirming their compatibility with polyethylene film recycling streams when used at specified concentrations.
  • In April 2025, Amcor is expected to finalize its acquisition of Berry Global, a strategic move anticipated to fortify its leadership in high-barrier lidding films and accelerate innovation in sustainable packaging solutions.
  • In February 2025, TIPA launched an advanced home-compostable metallized high-barrier film, providing a sustainable packaging alternative for products like snack foods that traditionally rely on hard-to-recycle flexible packaging.
  • In October 2024, Indorama Ventures, in partnership with other firms, announced the upcoming commercial launch of the world's first bio-polyethylene terephthalate bottle produced from post-consumer feedstock, specifically used cooking oil.

Dive into Technavio’s robust research methodology, blending expert interviews, extensive data synthesis, and validated models for unparalleled Transparent Barrier Packaging Film Market insights. See full methodology.

Market Scope
Page number 316
Base year 2025
Historic period 2020-2024
Forecast period 2026-2030
Growth momentum & CAGR Accelerate at a CAGR of 8.2%
Market growth 2026-2030 USD 8986.9 million
Market structure Fragmented
YoY growth 2025-2026(%) 7.6%
Key countries China, Japan, India, South Korea, Australia, Indonesia, US, Canada, Mexico, Germany, France, UK, Italy, Spain, The Netherlands, Saudi Arabia, UAE, South Africa, Israel, Turkey, Brazil, Argentina and Chile
Competitive landscape Leading Companies, Market Positioning of Companies, Competitive Strategies, and Industry Risks

Request Free Sample

Research Analyst Overview

  • The market is defined by a continuous push for material innovation to meet dual demands for performance and sustainability. Core technologies such as ethylene vinyl alcohol copolymer, biaxially oriented polyethylene terephthalate, and biaxially oriented polypropylene remain foundational, but the focus is shifting. Developments in coatings, including silicon oxide coating, aluminum oxide coating, and polyvinylidene chloride coating, are enhancing barrier properties.
  • Processes like the co-extrusion process and plasma enhanced chemical vapor deposition are enabling thinner, more complex flexible packaging laminates. A key boardroom consideration is aligning product strategy with evolving regulations like the extended producer responsibility scheme and mandates requiring 30% post-consumer recycled content. This directly impacts material choices, favoring high-barrier mono-material designs with mechanical recycling compatibility.
  • Applications such as lidding film application, retortable pouch technology, and vacuum skin packaging are being re-engineered based on circular economy principles. The objective is to maintain critical performance metrics like a low oxygen transmission rate and moisture vapor transmission rate while satisfying new sustainability benchmarks set by food contact materials regulation and other governing bodies.

What are the Key Data Covered in this Transparent Barrier Packaging Film Market Research and Growth Report?

  • What is the expected growth of the Transparent Barrier Packaging Film Market between 2026 and 2030?

    • USD 8.99 billion, at a CAGR of 8.2%

  • What segmentation does the market report cover?

    • The report is segmented by End-user (Food, Healthcare, Consumer goods, and Others), Material (Polyethylene, Polypropylene, Polyethylene terephthalate, Ethylene vinyl alcohol, and Others), Type (Pouches, Wraps and shrink films, Flow wraps, and Lidding films) and Geography (APAC, North America, Europe, Middle East and Africa, South America)

  • Which regions are analyzed in the report?

    • APAC, North America, Europe, Middle East and Africa and South America

  • What are the key growth drivers and market challenges?

    • High demand for transparent barrier packaging film in food industry, Growing use of substitute products

  • Who are the major players in the Transparent Barrier Packaging Film Market?

    • 3M Co., Amcor Plc, CCL Industries Inc., Celplast Metallized Products, Cosmo Films Ltd., DUO PLAST AG, DuPont de Nemours Inc., Glenroy Inc., Huhtamaki Oyj, KP Holding GmbH and Co. KG, Mitsubishi Chemical Grp., Mondi Plc, Sealed Air Corp., Sonoco Products Co., Sumilon Polyester Ltd., Taghleef Industries SpA, Toppan Inc., UFlex Ltd. and Winpak Ltd.

Market Research Insights

  • The market's momentum is increasingly shaped by sustainable material sourcing and the push for recyclable flexible packaging. Regulatory shifts, such as mandates requiring over 30% recycled content in some jurisdictions, are fundamentally altering procurement strategies. In response, innovations in smart packaging integration, including digital watermarking for sorting, are improving recycling efficiency by over 40% in pilot programs.
  • There is also a strong focus on lightweighting packaging design and tamper-evident packaging features to meet the demands of e-commerce protective packaging. These dynamics create a landscape where product-to-package ratio optimization is not just a cost-saving measure but a strategic necessity for compliance and brand positioning.

We can help! Our analysts can customize this transparent barrier packaging film market research report to meet your requirements.

Get in touch

1. Executive Summary

1.1 Market overview

Executive Summary - Chart on Market Overview
Executive Summary - Data Table on Market Overview
Executive Summary - Chart on Global Market Characteristics
Executive Summary - Chart on Market by Geography
Executive Summary - Chart on Market Segmentation by End-user
Executive Summary - Chart on Market Segmentation by Material
Executive Summary - Chart on Market Segmentation by Type
Executive Summary - Chart on Incremental Growth
Executive Summary - Data Table on Incremental Growth
Executive Summary - Chart on Company Market Positioning

2. Technavio Analysis

2.1 Analysis of price sensitivity, lifecycle, customer purchase basket, adoption rates, and purchase criteria

2.2 Criticality of inputs and Factors of differentiation

Chart on Overview on criticality of inputs and factors of differentiation

2.3 Factors of disruption

Chart on Overview on factors of disruption

2.4 Impact of drivers and challenges

Chart on Impact of drivers and challenges in 2025 and 2030

3. Market Landscape

3.1 Market ecosystem

Chart on Parent Market
Data Table on - Parent Market

3.2 Market characteristics

Chart on Market characteristics analysis

3.3 Value chain analysis

Chart on Value chain analysis

4. Market Sizing

4.1 Market definition

Data Table on Offerings of companies included in the market definition

4.2 Market segment analysis

Market segments

4.3 Market size 2025

4.4 Market outlook: Forecast for 2025-2030

Chart on Global - Market size and forecast 2025-2030 ($ million)
Data Table on Global - Market size and forecast 2025-2030 ($ million)
Chart on Global Market: Year-over-year growth 2025-2030 (%)
Data Table on Global Market: Year-over-year growth 2025-2030 (%)

5. Historic Market Size

5.1 Global Transparent Barrier Packaging Film Market 2020 - 2024

Historic Market Size - Data Table on Global Transparent Barrier Packaging Film Market 2020 - 2024 ($ million)

5.2 End-user segment analysis 2020 - 2024

Historic Market Size - End-user Segment 2020 - 2024 ($ million)

5.3 Material segment analysis 2020 - 2024

Historic Market Size - Material Segment 2020 - 2024 ($ million)

5.4 Type segment analysis 2020 - 2024

Historic Market Size - Type Segment 2020 - 2024 ($ million)

5.5 Geography segment analysis 2020 - 2024

Historic Market Size - Geography Segment 2020 - 2024 ($ million)

5.6 Country segment analysis 2020 - 2024

Historic Market Size - Country Segment 2020 - 2024 ($ million)

6. Qualitative Analysis

6.1 The AI impact on Global Transparent Barrier Packaging Film Market

7. Five Forces Analysis

7.1 Five forces summary

Five forces analysis - Comparison between 2025 and 2030

7.2 Bargaining power of buyers

Bargaining power of buyers - Impact of key factors 2025 and 2030

7.3 Bargaining power of suppliers

Bargaining power of suppliers - Impact of key factors in 2025 and 2030

7.4 Threat of new entrants

Threat of new entrants - Impact of key factors in 2025 and 2030

7.5 Threat of substitutes

Threat of substitutes - Impact of key factors in 2025 and 2030

7.6 Threat of rivalry

Threat of rivalry - Impact of key factors in 2025 and 2030

7.7 Market condition

Chart on Market condition - Five forces 2025 and 2030

8. Market Segmentation by End-user

8.1 Market segments

Chart on End-user - Market share 2025-2030 (%)
Data Table on End-user - Market share 2025-2030 (%)

8.2 Comparison by End-user

Chart on Comparison by End-user
Data Table on Comparison by End-user

8.3 Food - Market size and forecast 2025-2030

Chart on Food - Market size and forecast 2025-2030 ($ million)
Data Table on Food - Market size and forecast 2025-2030 ($ million)
Chart on Food - Year-over-year growth 2025-2030 (%)
Data Table on Food - Year-over-year growth 2025-2030 (%)

8.4 Healthcare - Market size and forecast 2025-2030

Chart on Healthcare - Market size and forecast 2025-2030 ($ million)
Data Table on Healthcare - Market size and forecast 2025-2030 ($ million)
Chart on Healthcare - Year-over-year growth 2025-2030 (%)
Data Table on Healthcare - Year-over-year growth 2025-2030 (%)

8.5 Consumer goods - Market size and forecast 2025-2030

Chart on Consumer goods - Market size and forecast 2025-2030 ($ million)
Data Table on Consumer goods - Market size and forecast 2025-2030 ($ million)
Chart on Consumer goods - Year-over-year growth 2025-2030 (%)
Data Table on Consumer goods - Year-over-year growth 2025-2030 (%)

8.6 Others - Market size and forecast 2025-2030

Chart on Others - Market size and forecast 2025-2030 ($ million)
Data Table on Others - Market size and forecast 2025-2030 ($ million)
Chart on Others - Year-over-year growth 2025-2030 (%)
Data Table on Others - Year-over-year growth 2025-2030 (%)

8.7 Market opportunity by End-user

Market opportunity by End-user ($ million)
Data Table on Market opportunity by End-user ($ million)

9. Market Segmentation by Material

9.1 Market segments

Chart on Material - Market share 2025-2030 (%)
Data Table on Material - Market share 2025-2030 (%)

9.2 Comparison by Material

Chart on Comparison by Material
Data Table on Comparison by Material

9.3 Polyethylene - Market size and forecast 2025-2030

Chart on Polyethylene - Market size and forecast 2025-2030 ($ million)
Data Table on Polyethylene - Market size and forecast 2025-2030 ($ million)
Chart on Polyethylene - Year-over-year growth 2025-2030 (%)
Data Table on Polyethylene - Year-over-year growth 2025-2030 (%)

9.4 Polypropylene - Market size and forecast 2025-2030

Chart on Polypropylene - Market size and forecast 2025-2030 ($ million)
Data Table on Polypropylene - Market size and forecast 2025-2030 ($ million)
Chart on Polypropylene - Year-over-year growth 2025-2030 (%)
Data Table on Polypropylene - Year-over-year growth 2025-2030 (%)

9.5 Polyethylene terephthalate - Market size and forecast 2025-2030

Chart on Polyethylene terephthalate - Market size and forecast 2025-2030 ($ million)
Data Table on Polyethylene terephthalate - Market size and forecast 2025-2030 ($ million)
Chart on Polyethylene terephthalate - Year-over-year growth 2025-2030 (%)
Data Table on Polyethylene terephthalate - Year-over-year growth 2025-2030 (%)

9.6 Ethylene vinyl alcohol - Market size and forecast 2025-2030

Chart on Ethylene vinyl alcohol - Market size and forecast 2025-2030 ($ million)
Data Table on Ethylene vinyl alcohol - Market size and forecast 2025-2030 ($ million)
Chart on Ethylene vinyl alcohol - Year-over-year growth 2025-2030 (%)
Data Table on Ethylene vinyl alcohol - Year-over-year growth 2025-2030 (%)

9.7 Others - Market size and forecast 2025-2030

Chart on Others - Market size and forecast 2025-2030 ($ million)
Data Table on Others - Market size and forecast 2025-2030 ($ million)
Chart on Others - Year-over-year growth 2025-2030 (%)
Data Table on Others - Year-over-year growth 2025-2030 (%)

9.8 Market opportunity by Material

Market opportunity by Material ($ million)
Data Table on Market opportunity by Material ($ million)

10. Market Segmentation by Type

10.1 Market segments

Chart on Type - Market share 2025-2030 (%)
Data Table on Type - Market share 2025-2030 (%)

10.2 Comparison by Type

Chart on Comparison by Type
Data Table on Comparison by Type

10.3 Pouches - Market size and forecast 2025-2030

Chart on Pouches - Market size and forecast 2025-2030 ($ million)
Data Table on Pouches - Market size and forecast 2025-2030 ($ million)
Chart on Pouches - Year-over-year growth 2025-2030 (%)
Data Table on Pouches - Year-over-year growth 2025-2030 (%)

10.4 Wraps and shrink films - Market size and forecast 2025-2030

Chart on Wraps and shrink films - Market size and forecast 2025-2030 ($ million)
Data Table on Wraps and shrink films - Market size and forecast 2025-2030 ($ million)
Chart on Wraps and shrink films - Year-over-year growth 2025-2030 (%)
Data Table on Wraps and shrink films - Year-over-year growth 2025-2030 (%)

10.5 Flow wraps - Market size and forecast 2025-2030

Chart on Flow wraps - Market size and forecast 2025-2030 ($ million)
Data Table on Flow wraps - Market size and forecast 2025-2030 ($ million)
Chart on Flow wraps - Year-over-year growth 2025-2030 (%)
Data Table on Flow wraps - Year-over-year growth 2025-2030 (%)

10.6 Lidding films - Market size and forecast 2025-2030

Chart on Lidding films - Market size and forecast 2025-2030 ($ million)
Data Table on Lidding films - Market size and forecast 2025-2030 ($ million)
Chart on Lidding films - Year-over-year growth 2025-2030 (%)
Data Table on Lidding films - Year-over-year growth 2025-2030 (%)

10.7 Market opportunity by Type

Market opportunity by Type ($ million)
Data Table on Market opportunity by Type ($ million)

11. Customer Landscape

11.1 Customer landscape overview

Analysis of price sensitivity, lifecycle, customer purchase basket, adoption rates, and purchase criteria

12. Geographic Landscape

12.1 Geographic segmentation

Chart on Market share by geography 2025-2030 (%)
Data Table on Market share by geography 2025-2030 (%)

12.2 Geographic comparison

Chart on Geographic comparison
Data Table on Geographic comparison

12.3 APAC - Market size and forecast 2025-2030

Chart on APAC - Market size and forecast 2025-2030 ($ million)
Data Table on APAC - Market size and forecast 2025-2030 ($ million)
Chart on APAC - Year-over-year growth 2025-2030 (%)
Data Table on APAC - Year-over-year growth 2025-2030 (%)
Chart on Regional Comparison - APAC
Data Table on Regional Comparison - APAC

12.3.1 China - Market size and forecast 2025-2030

Chart on China - Market size and forecast 2025-2030 ($ million)
Data Table on China - Market size and forecast 2025-2030 ($ million)
Chart on China - Year-over-year growth 2025-2030 (%)
Data Table on China - Year-over-year growth 2025-2030 (%)

12.3.2 Japan - Market size and forecast 2025-2030

Chart on Japan - Market size and forecast 2025-2030 ($ million)
Data Table on Japan - Market size and forecast 2025-2030 ($ million)
Chart on Japan - Year-over-year growth 2025-2030 (%)
Data Table on Japan - Year-over-year growth 2025-2030 (%)

12.3.3 India - Market size and forecast 2025-2030

Chart on India - Market size and forecast 2025-2030 ($ million)
Data Table on India - Market size and forecast 2025-2030 ($ million)
Chart on India - Year-over-year growth 2025-2030 (%)
Data Table on India - Year-over-year growth 2025-2030 (%)

12.3.4 South Korea - Market size and forecast 2025-2030

Chart on South Korea - Market size and forecast 2025-2030 ($ million)
Data Table on South Korea - Market size and forecast 2025-2030 ($ million)
Chart on South Korea - Year-over-year growth 2025-2030 (%)
Data Table on South Korea - Year-over-year growth 2025-2030 (%)

12.3.5 Australia - Market size and forecast 2025-2030

Chart on Australia - Market size and forecast 2025-2030 ($ million)
Data Table on Australia - Market size and forecast 2025-2030 ($ million)
Chart on Australia - Year-over-year growth 2025-2030 (%)
Data Table on Australia - Year-over-year growth 2025-2030 (%)

12.3.6 Indonesia - Market size and forecast 2025-2030

Chart on Indonesia - Market size and forecast 2025-2030 ($ million)
Data Table on Indonesia - Market size and forecast 2025-2030 ($ million)
Chart on Indonesia - Year-over-year growth 2025-2030 (%)
Data Table on Indonesia - Year-over-year growth 2025-2030 (%)

12.4 North America - Market size and forecast 2025-2030

Chart on North America - Market size and forecast 2025-2030 ($ million)
Data Table on North America - Market size and forecast 2025-2030 ($ million)
Chart on North America - Year-over-year growth 2025-2030 (%)
Data Table on North America - Year-over-year growth 2025-2030 (%)
Chart on Regional Comparison - North America
Data Table on Regional Comparison - North America

12.4.1 US - Market size and forecast 2025-2030

Chart on US - Market size and forecast 2025-2030 ($ million)
Data Table on US - Market size and forecast 2025-2030 ($ million)
Chart on US - Year-over-year growth 2025-2030 (%)
Data Table on US - Year-over-year growth 2025-2030 (%)

12.4.2 Canada - Market size and forecast 2025-2030

Chart on Canada - Market size and forecast 2025-2030 ($ million)
Data Table on Canada - Market size and forecast 2025-2030 ($ million)
Chart on Canada - Year-over-year growth 2025-2030 (%)
Data Table on Canada - Year-over-year growth 2025-2030 (%)

12.4.3 Mexico - Market size and forecast 2025-2030

Chart on Mexico - Market size and forecast 2025-2030 ($ million)
Data Table on Mexico - Market size and forecast 2025-2030 ($ million)
Chart on Mexico - Year-over-year growth 2025-2030 (%)
Data Table on Mexico - Year-over-year growth 2025-2030 (%)

12.5 Europe - Market size and forecast 2025-2030

Chart on Europe - Market size and forecast 2025-2030 ($ million)
Data Table on Europe - Market size and forecast 2025-2030 ($ million)
Chart on Europe - Year-over-year growth 2025-2030 (%)
Data Table on Europe - Year-over-year growth 2025-2030 (%)
Chart on Regional Comparison - Europe
Data Table on Regional Comparison - Europe

12.5.1 Germany - Market size and forecast 2025-2030

Chart on Germany - Market size and forecast 2025-2030 ($ million)
Data Table on Germany - Market size and forecast 2025-2030 ($ million)
Chart on Germany - Year-over-year growth 2025-2030 (%)
Data Table on Germany - Year-over-year growth 2025-2030 (%)

12.5.2 France - Market size and forecast 2025-2030

Chart on France - Market size and forecast 2025-2030 ($ million)
Data Table on France - Market size and forecast 2025-2030 ($ million)
Chart on France - Year-over-year growth 2025-2030 (%)
Data Table on France - Year-over-year growth 2025-2030 (%)

12.5.3 UK - Market size and forecast 2025-2030

Chart on UK - Market size and forecast 2025-2030 ($ million)
Data Table on UK - Market size and forecast 2025-2030 ($ million)
Chart on UK - Year-over-year growth 2025-2030 (%)
Data Table on UK - Year-over-year growth 2025-2030 (%)

12.5.4 Italy - Market size and forecast 2025-2030

Chart on Italy - Market size and forecast 2025-2030 ($ million)
Data Table on Italy - Market size and forecast 2025-2030 ($ million)
Chart on Italy - Year-over-year growth 2025-2030 (%)
Data Table on Italy - Year-over-year growth 2025-2030 (%)

12.5.5 Spain - Market size and forecast 2025-2030

Chart on Spain - Market size and forecast 2025-2030 ($ million)
Data Table on Spain - Market size and forecast 2025-2030 ($ million)
Chart on Spain - Year-over-year growth 2025-2030 (%)
Data Table on Spain - Year-over-year growth 2025-2030 (%)

12.5.6 The Netherlands - Market size and forecast 2025-2030

Chart on The Netherlands - Market size and forecast 2025-2030 ($ million)
Data Table on The Netherlands - Market size and forecast 2025-2030 ($ million)
Chart on The Netherlands - Year-over-year growth 2025-2030 (%)
Data Table on The Netherlands - Year-over-year growth 2025-2030 (%)

12.6 Middle East and Africa - Market size and forecast 2025-2030

Chart on Middle East and Africa - Market size and forecast 2025-2030 ($ million)
Data Table on Middle East and Africa - Market size and forecast 2025-2030 ($ million)
Chart on Middle East and Africa - Year-over-year growth 2025-2030 (%)
Data Table on Middle East and Africa - Year-over-year growth 2025-2030 (%)
Chart on Regional Comparison - Middle East and Africa
Data Table on Regional Comparison - Middle East and Africa

12.6.1 Saudi Arabia - Market size and forecast 2025-2030

Chart on Saudi Arabia - Market size and forecast 2025-2030 ($ million)
Data Table on Saudi Arabia - Market size and forecast 2025-2030 ($ million)
Chart on Saudi Arabia - Year-over-year growth 2025-2030 (%)
Data Table on Saudi Arabia - Year-over-year growth 2025-2030 (%)

12.6.2 UAE - Market size and forecast 2025-2030

Chart on UAE - Market size and forecast 2025-2030 ($ million)
Data Table on UAE - Market size and forecast 2025-2030 ($ million)
Chart on UAE - Year-over-year growth 2025-2030 (%)
Data Table on UAE - Year-over-year growth 2025-2030 (%)

12.6.3 South Africa - Market size and forecast 2025-2030

Chart on South Africa - Market size and forecast 2025-2030 ($ million)
Data Table on South Africa - Market size and forecast 2025-2030 ($ million)
Chart on South Africa - Year-over-year growth 2025-2030 (%)
Data Table on South Africa - Year-over-year growth 2025-2030 (%)

12.6.4 Israel - Market size and forecast 2025-2030

Chart on Israel - Market size and forecast 2025-2030 ($ million)
Data Table on Israel - Market size and forecast 2025-2030 ($ million)
Chart on Israel - Year-over-year growth 2025-2030 (%)
Data Table on Israel - Year-over-year growth 2025-2030 (%)

12.6.5 Turkey - Market size and forecast 2025-2030

Chart on Turkey - Market size and forecast 2025-2030 ($ million)
Data Table on Turkey - Market size and forecast 2025-2030 ($ million)
Chart on Turkey - Year-over-year growth 2025-2030 (%)
Data Table on Turkey - Year-over-year growth 2025-2030 (%)

12.7 South America - Market size and forecast 2025-2030

Chart on South America - Market size and forecast 2025-2030 ($ million)
Data Table on South America - Market size and forecast 2025-2030 ($ million)
Chart on South America - Year-over-year growth 2025-2030 (%)
Data Table on South America - Year-over-year growth 2025-2030 (%)
Chart on Regional Comparison - South America
Data Table on Regional Comparison - South America

12.7.1 Brazil - Market size and forecast 2025-2030

Chart on Brazil - Market size and forecast 2025-2030 ($ million)
Data Table on Brazil - Market size and forecast 2025-2030 ($ million)
Chart on Brazil - Year-over-year growth 2025-2030 (%)
Data Table on Brazil - Year-over-year growth 2025-2030 (%)

12.7.2 Argentina - Market size and forecast 2025-2030

Chart on Argentina - Market size and forecast 2025-2030 ($ million)
Data Table on Argentina - Market size and forecast 2025-2030 ($ million)
Chart on Argentina - Year-over-year growth 2025-2030 (%)
Data Table on Argentina - Year-over-year growth 2025-2030 (%)

12.7.3 Chile - Market size and forecast 2025-2030

Chart on Chile - Market size and forecast 2025-2030 ($ million)
Data Table on Chile - Market size and forecast 2025-2030 ($ million)
Chart on Chile - Year-over-year growth 2025-2030 (%)
Data Table on Chile - Year-over-year growth 2025-2030 (%)

12.8 Market opportunity by geography

Market opportunity by geography ($ million)
Data Tables on Market opportunity by geography ($ million)

13. Drivers, Challenges, and Opportunity

13.1 Market drivers

High demand for transparent barrier packaging film in food industry
Emergence of enhanced microwave-safe transparent barrier packaging film
Growth of plastic films industry

13.2 Market challenges

Growing use of substitute products
Stringent regulations on use of non-biodegradable plastics
Competition in transparent barrier packaging film industry

13.3 Impact of drivers and challenges

Impact of drivers and challenges in 2025 and 2030

13.4 Market opportunities

Increased demand for high-performance, specialty barrier films
Advanced recycling technologies and programs for reducing plastic waste
Rise in demand for biodegradable and sustainable films

14. Competitive Landscape

14.1 Overview

14.2

Overview on criticality of inputs and factors of differentiation

14.3 Landscape disruption

Overview on factors of disruption

14.4 Industry risks

Impact of key risks on business

15. Competitive Analysis

15.1 Companies profiled

Companies covered

15.2 Company ranking index

15.3 Market positioning of companies

Matrix on companies position and classification

15.4 3M Co.

3M Co. - Overview
3M Co. - Business segments
3M Co. - Key news
3M Co. - Key offerings
3M Co. - Segment focus
SWOT

15.5 Amcor Plc

Amcor Plc - Overview
Amcor Plc - Business segments
Amcor Plc - Key news
Amcor Plc - Key offerings
Amcor Plc - Segment focus
SWOT

15.6 CCL Industries Inc.

CCL Industries Inc. - Overview
CCL Industries Inc. - Business segments
CCL Industries Inc. - Key news
CCL Industries Inc. - Key offerings
CCL Industries Inc. - Segment focus
SWOT

15.7 Cosmo Films Ltd.

Cosmo Films Ltd. - Overview
Cosmo Films Ltd. - Product / Service
Cosmo Films Ltd. - Key offerings
SWOT

15.8 DuPont de Nemours Inc.

DuPont de Nemours Inc. - Overview
DuPont de Nemours Inc. - Business segments
DuPont de Nemours Inc. - Key news
DuPont de Nemours Inc. - Key offerings
DuPont de Nemours Inc. - Segment focus
SWOT

15.9 Huhtamaki Oyj

Huhtamaki Oyj - Overview
Huhtamaki Oyj - Business segments
Huhtamaki Oyj - Key news
Huhtamaki Oyj - Key offerings
Huhtamaki Oyj - Segment focus
SWOT

15.10 KP Holding GmbH and Co. KG

KP Holding GmbH and Co. KG - Overview
KP Holding GmbH and Co. KG - Product / Service
KP Holding GmbH and Co. KG - Key offerings
SWOT

15.11 Mitsubishi Chemical Grp.

Mitsubishi Chemical Grp. - Overview
Mitsubishi Chemical Grp. - Business segments
Mitsubishi Chemical Grp. - Key news
Mitsubishi Chemical Grp. - Key offerings
Mitsubishi Chemical Grp. - Segment focus
SWOT

15.12 Mondi Plc

Mondi Plc - Overview
Mondi Plc - Business segments
Mondi Plc - Key news
Mondi Plc - Key offerings
Mondi Plc - Segment focus
SWOT

15.13 Sealed Air Corp.

Sealed Air Corp. - Overview
Sealed Air Corp. - Business segments
Sealed Air Corp. - Key news
Sealed Air Corp. - Key offerings
Sealed Air Corp. - Segment focus
SWOT

15.14 Sonoco Products Co.

Sonoco Products Co. - Overview
Sonoco Products Co. - Business segments
Sonoco Products Co. - Key news
Sonoco Products Co. - Key offerings
Sonoco Products Co. - Segment focus
SWOT

15.15 Taghleef Industries SpA

Taghleef Industries SpA - Overview
Taghleef Industries SpA - Product / Service
Taghleef Industries SpA - Key offerings
SWOT

15.16 Toppan Inc.

Toppan Inc. - Overview
Toppan Inc. - Business segments
Toppan Inc. - Key offerings
Toppan Inc. - Segment focus
SWOT

15.17 UFlex Ltd.

UFlex Ltd. - Overview
UFlex Ltd. - Business segments
UFlex Ltd. - Key offerings
UFlex Ltd. - Segment focus
SWOT

15.18 Winpak Ltd.

Winpak Ltd. - Overview
Winpak Ltd. - Business segments
Winpak Ltd. - Key offerings
Winpak Ltd. - Segment focus
SWOT

16. Appendix

16.1 Scope of the report

Market definition
Objectives
Notes and caveats

16.2 Inclusions and exclusions checklist

Inclusions checklist
Exclusions checklist

16.3 Currency conversion rates for US$

16.4 Research methodology

16.5 Data procurement

Information sources

16.6 Data validation

16.7 Validation techniques employed for market sizing

16.8 Data synthesis

16.9 360 degree market analysis

16.10 List of abbreviations

Research Methodology

Technavio presents a detailed picture of the market by way of study, synthesis, and summation of data from multiple sources. The analysts have presented the various facets of the market with a particular focus on identifying the key industry influencers. The data thus presented is comprehensive, reliable, and the result of extensive research, both primary and secondary.

INFORMATION SOURCES

Primary sources

  • Manufacturers and suppliers
  • Channel partners
  • Industry experts
  • Strategic decision makers

Secondary sources

  • Industry journals and periodicals
  • Government data
  • Financial reports of key industry players
  • Historical data
  • Press releases

DATA ANALYSIS

Data Synthesis

  • Collation of data
  • Estimation of key figures
  • Analysis of derived insights

Data Validation

  • Triangulation with data models
  • Reference against proprietary databases
  • Corroboration with industry experts

REPORT WRITING

Qualitative

  • Market drivers
  • Market challenges
  • Market trends
  • Five forces analysis

Quantitative

  • Market size and forecast
  • Market segmentation
  • Geographical insights
  • Competitive landscape

Interested in this report?

Get your sample now to see our research methodology and insights!

Download Now

Frequently Asked Questions

Transparent Barrier Packaging Film market growth will increase by USD 8986.9 million during 2026-2030.

The Transparent Barrier Packaging Film market is expected to grow at a CAGR of 8.2% during 2026-2030.

Transparent Barrier Packaging Film market is segmented by End-user (Food, Healthcare, Consumer goods, Others) Material (Polyethylene, Polypropylene, Polyethylene terephthalate, Ethylene vinyl alcohol, Others) Type (Pouches, Wraps and shrink films, Flow wraps, Lidding films)

3M Co., Amcor Plc, CCL Industries Inc., Celplast Metallized Products, Cosmo Films Ltd., DUO PLAST AG, DuPont de Nemours Inc., Glenroy Inc., Huhtamaki Oyj, KP Holding GmbH and Co. KG, Mitsubishi Chemical Grp., Mondi Plc, Sealed Air Corp., Sonoco Products Co., Sumilon Polyester Ltd., Taghleef Industries SpA, Toppan Inc., UFlex Ltd., Winpak Ltd. are a few of the key vendors in the Transparent Barrier Packaging Film market.

APAC will register the highest growth rate of 40.9% among the other regions. Therefore, the Transparent Barrier Packaging Film market in APAC is expected to garner significant business opportunities for the vendors during the forecast period.

China, Japan, India, South Korea, Australia, Indonesia, US, Canada, Mexico, Germany, France, UK, Italy, Spain, The Netherlands, Saudi Arabia, UAE, South Africa, Israel, Turkey, Brazil, Argentina, Chile

  • High demand for transparent barrier packaging film in food industry is the driving factor this market.

The Transparent Barrier Packaging Film market vendors should focus on grabbing business opportunities from the End-user segment as it accounted for the largest market share in the base year.