Travel Agency Services Market Size 2024-2028
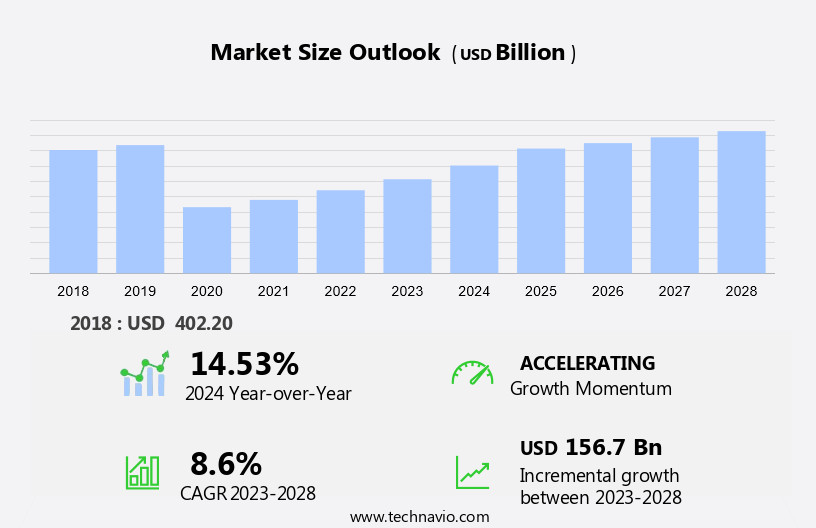
The travel agency services market size is forecast to increase by USD 156.7 billion at a CAGR of 8.6% between 2023 and 2028.
- The market is experiencing significant growth due to several key factors. The increasing number of international tourists and their footfalls are driving market growth. Moreover, the adoption of technologically advanced travel solutions is transforming the industry, offering customers convenience and personalized services. The integration of artificial intelligence and machine learning algorithms has transformed the industry, enabling more efficient and customized offerings. However, the market faces challenges such as the growing threat from rising terrorist activities, which can negatively impact tourist destinations and travel plans. Additionally, economic instability and fluctuating exchange rates can also impact travel plans and affect market growth. Overall, the market is expected to continue its growth trajectory, driven by these factors and the evolving needs of travelers.
What will be the Size of the Travel Agency Services Market During the Forecast Period?
- The market caters to the diverse needs of leisure tourists, business travelers, and adventurers, offering a range of additional services beyond traditional flight and hotel booking. These services include car hire, phone booking, online booking, travel planning, ticketing, accommodation booking, transportation arrangements, visa assistance, travel insurance, personalized itineraries, and more. Online travel agencies and direct booking options have gained significant traction due to global connectivity, while airlines have also expanded their offerings to include ancillary services. The middle-class population's growing disposable income and increasing interest in sustainable travel practices further fuel market growth.
How is this Travel Agency Services Industry segmented and which is the largest segment?
The travel agency services industry research report provides comprehensive data (region-wise segment analysis), with forecasts and estimates in "USD billion" for the period 2024-2028, as well as historical data from 2018-2022 for the following segments.
- Type
- Leisure travel
- Business travel
- Specialty travel
- Distribution Channel
- Online travel agencies
- Hybrid
- Brick and mortar travel agencies
- Geography
- North America
- US
- APAC
- China
- Japan
- Europe
- Germany
- UK
- Middle East and Africa
- South America
- North America
By Type Insights
- The leisure travel segment is estimated to witness significant growth during the forecast period.
The market caters to various types of travelers, including leisure tourists, business travelers, adventurers, and independent or package travelers. With the global middle-class population expanding, the demand for travel services has risen. Travelers now expect seamless travel planning, ticketing, accommodation booking, and transportation arrangements. Additional services such as visa assistance, travel insurance, and personalized itineraries have become essential. Technological advancements, including AI and machine learning algorithms, have transformed the travel industry. Online booking channels, direct booking options, and global connectivity have made travel more accessible. Digital marketing through smartphone and tablet applications, social networking sites, and search engines influence travelers' decisions.
Travelers also prioritize sustainable travel practices, eco-friendly tourism, and supporting local communities. Business travelers require operational safety, employee safety, and convenience. Civil construction activities, such as dams, bridges, and tunnels, create opportunities for adventure tourism and art tourism. IoT and AI-powered solutions improve safety and efficiency In the travel industry. The millennial generation's travel preferences are shaping the market, with a focus on unique experiences and customization.
Get a glance at the Travel Agency Services Industry report of share of various segments Request Free Sample
The Leisure travel segment was valued at USD 203.20 billion in 2018 and showed a gradual increase during the forecast period.
Regional Analysis
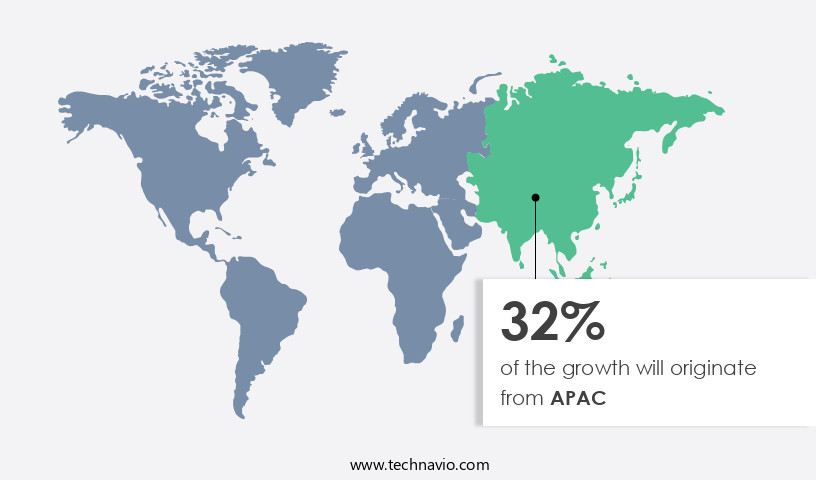
- APAC is estimated to contribute 32% to the growth of the global market during the forecast period.
Technavio's analysts have elaborately explained the regional trends and drivers that shape the market during the forecast period.
For more insights on the market share of various regions, Request Free Sample
The North American market is currently the largest globally, driven by significant contributions from the US and Canada. Factors such as the increasing disposable income, the growing popularity of micro-trips among professionals, and the rising trend of multigenerational travel are fueling market growth. Travel agencies are responding to these trends by integrating advanced technologies like AI and machine learning algorithms to offer personalized services, including flight bookings, hotel reservations, car hires, phone and online booking, and in-person booking for both domestic and international travel.
Additionally, there is a growing demand for sustainable travel practices, eco-friendly tourism, and adventure and art tourism, particularly among the millennial generation. The market is expected to continue expanding due to the increasing global connectivity, the middle-class population's growing interest in travel, and the adoption of digital marketing, smartphone, and tablet applications.
Market Dynamics
Our researchers analyzed the data with 2023 as the base year, along with the key drivers, trends, and challenges. A holistic analysis of drivers will help companies refine their marketing strategies to gain a competitive advantage.
What are the key market drivers leading to the rise In the adoption of Travel Agency Services Industry?
Increasing international tourist footfall is the key driver of the market.
- Increasing international tourist footfalls is notably driving market growth. Travel agency services cater to various types of travelers, including leisure tourists, business travelers, and adventurers, offering additional services beyond basic ticketing and accommodation booking.
- Moreover, these services include transportation arrangements, such as car hire, and more complex offerings like visa assistance, travel insurance, and personalized itineraries. With the advent of AI and machine learning algorithms, travel agencies are enhancing their offerings through online and phone booking options, as well as in-person services. Thus, such factors are driving the growth of the market during the forecast period.
What are the market trends shaping the Travel Agency Services Industry?
Increasing use of technologically advanced travel solutions is the upcoming market trend.
- Travel agency services cater to various types of travelers, including leisure tourists, business travelers, and adventurers, offering additional services beyond flights, hotels, and car hire. AI and machine learning algorithms are increasingly being integrated into travel planning, ticketing, and accommodation booking to provide personalized itineraries and transportation arrangements.
- Moreover, travel agencies facilitate both domestic and international travel, catering to independent travelers and package travelers alike. They offer visa assistance, travel insurance, and sustainable travel practices, such as eco-friendly tourism and support for local communities. Digital marketing and smartphone, tablet applications enable seamless online booking and phone booking options. Operational safety, employee safety, and civil construction activities are essential considerations for travel agencies, ensuring a secure and efficient travel experience. Thus, such trends will shape the growth of the market during the forecast period.
What challenges does the Travel Agency Services Industry face during its growth?
The growing threat from rising terrorist activities is a key challenge affecting the industry growth.
- Travel agency services cater to various types of travelers, including leisure tourists, business travelers, and adventurers, offering additional services beyond basic ticketing and accommodation booking.
- Moreover, AI and machine learning algorithms are increasingly being integrated into travel agencies' operations to enhance the customer experience. These technologies enable personalized itineraries, real-time flight and hotel availability, and seamless transportation arrangements, including car hire and visa assistance. Hence, the above factors will impede the growth of the market during the forecast period.
Exclusive Customer Landscape
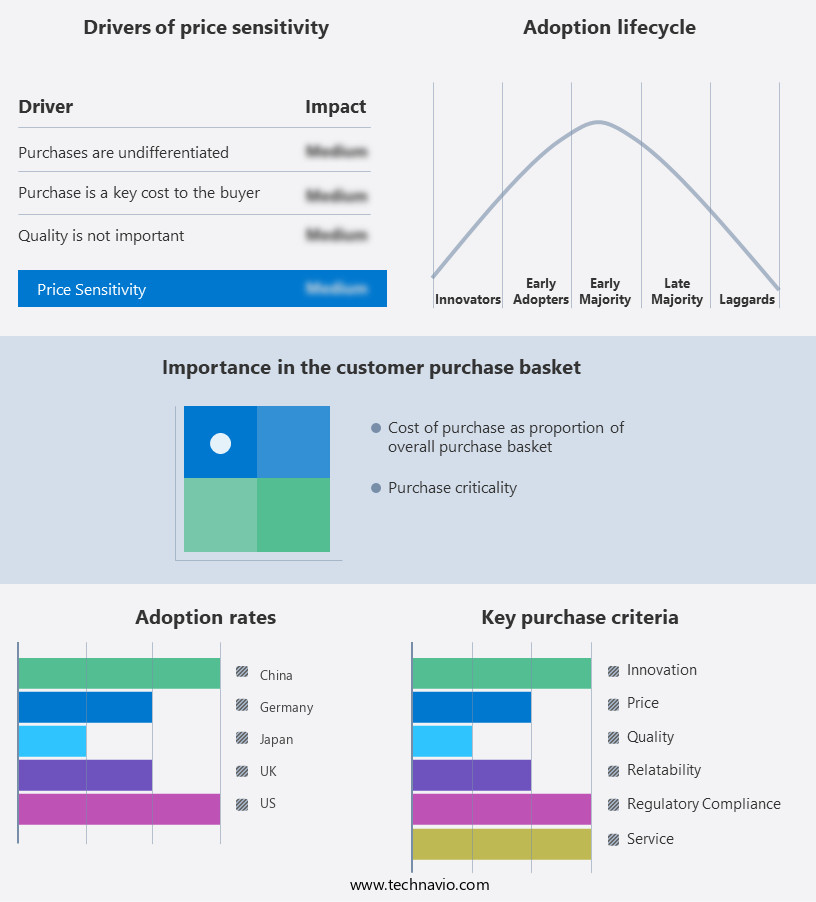
The market forecasting report includes the adoption lifecycle of the market, covering from the innovator's stage to the laggard's stage. It focuses on adoption rates in different regions based on penetration. Furthermore, the market report also includes key purchase criteria and drivers of price sensitivity to help companies evaluate and develop their market growth analysis strategies.
Customer Landscape
Key Companies & Market Insights
Companies are implementing various strategies, such as strategic alliances, travel agency services market forecast, partnerships, mergers and acquisitions, geographical expansion, and product/service launches, to enhance their presence In the industry.
The industry research and growth report includes detailed analyses of the competitive landscape of the market and information about key companies, including:
- Abercrombie and Kent USA LLC
- American Express Co.
- BCD Group
- Booking Holdings Inc.
- China tourism group
- Corporate Travel Management Ltd.
- CWT Global BV
- eDreams ODIGEO
- Expedia Group Inc.
- Flight Centre Travel Group Ltd.
- Kesari Tours Pvt. Ltd.
- MakeMyTrip Ltd.
- Services International Ltd.
- The Travel Corp
- Thomas Cook India Ltd.
- Trafalgar
- Trip.com Group Ltd.
- TripAdvisor Inc.
- TUI AG
- Yatra Online Inc.
Qualitative and quantitative analysis of companies has been conducted to help clients understand the wider business environment as well as the strengths and weaknesses of key industry players. Data is qualitatively analyzed to categorize companies as pure play, category-focused, industry-focused, and diversified; it is quantitatively analyzed to categorize companies as dominant, leading, strong, tentative, and weak.
Research Analyst Overview
Travel agency services have experienced a significant evolution in recent years, driven by advancements in technology and shifting consumer preferences. Leisure tourists and business travelers alike seek convenience, personalization, and value In their travel experiences. Travel agencies offer a range of additional services beyond traditional flight, hotel, and car hire bookings. These include ticketing, accommodation booking, transportation arrangements, visa assistance, travel insurance, and the creation of personalized itineraries. The integration of machine learning algorithms and artificial intelligence (AI) enables travel agencies to provide more accurate and efficient services, analyzing customer data to offer tailored recommendations and optimizing pricing and availability.
Moreover, online booking channels have become increasingly popular, with smartphone and tablet applications enabling travelers to plan and book their trips from anywhere, at any time. Direct booking options through airline websites and online travel agencies (OTAs) have also gained traction, offering competitive pricing and a more streamlined booking process. The global connectivity made possible by the digital age has expanded the travel market, with the middle-class population in emerging economies increasingly able to afford international travel. Sustainable travel practices and eco-friendly tourism are also growing trends, as travelers seek to minimize their environmental impact and support local communities.
Furthermore, digital marketing plays a crucial role in reaching potential customers and differentiating travel agencies from competitors. Social networking sites and IoT devices offer new opportunities for targeted advertising and personalized offers. Adventure tourism and art tourism are also gaining popularity, catering to the millennial generation's desire for unique and authentic experiences. Operational safety and employee safety remain top priorities for travel agencies, with geoscientists and engineers ensuring the safety of civil construction activities related to dams, bridges, and tunnels. The use of AI and machine learning algorithms in operational safety and risk assessment can help identify potential issues before they become major problems, minimizing disruptions and ensuring a safe and enjoyable travel experience for customers.
|
Market Scope |
|
|
Report Coverage |
Details |
|
Page number |
191 |
|
Base year |
2023 |
|
Historic period |
2018-2022 |
|
Forecast period |
2024-2028 |
|
Growth momentum & CAGR |
Accelerate at a CAGR of 8.6% |
|
Market Growth 2024-2028 |
USD 156.7 billion |
|
Market structure |
Fragmented |
|
YoY growth 2023-2024(%) |
14.53 |
|
Key countries |
US, China, UK, Germany, and Japan |
|
Competitive landscape |
Leading Companies, Market Positioning of Companies, Competitive Strategies, and Industry Risks |
What are the Key Data Covered in this Travel Agency Services Market Research and Growth Report?
- CAGR of the Travel Agency Services industry during the forecast period
- Detailed information on factors that will drive the market growth and forecasting between 2024 and 2028
- Precise estimation of the size of the market and its contribution of the industry in focus to the parent market
- Accurate predictions about upcoming growth and trends and changes in consumer behaviour
- Growth of the market across North America, APAC, Europe, Middle East and Africa, and South America
- Thorough analysis of the market's competitive landscape and detailed information about companies
- Comprehensive analysis of factors that will challenge the travel agency services market growth of industry companies
We can help! Our analysts can customize this travel agency services market research report to meet your requirements.


