Travel And Business Bags Market Size 2025-2029
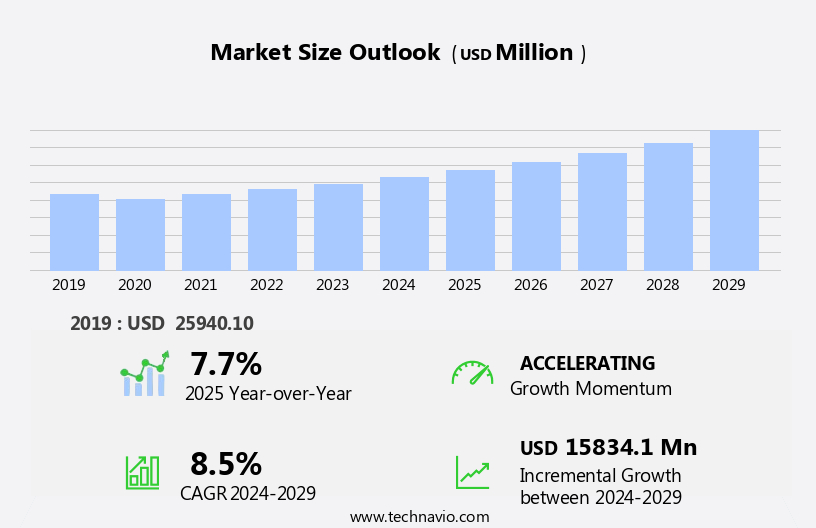
The travel and business bags market size is forecast to increase by USD 15.83 billion at a CAGR of 8.5% between 2024 and 2029.
- The market is experiencing significant growth driven by the increasing demand for lightweight and functional luggage solutions. This trend is particularly prominent among the globally mobile workforce, who require versatile bags that can transition seamlessly between professional and leisure contexts. Furthermore, the integration of smart features, such as charging ports and GPS tracking, is adding value for consumers and creating new opportunities for market participants. However, the market is not without challenges. Rising labor costs and fluctuating raw material prices are putting pressure on manufacturers to maintain profitability.
- To capitalize on market opportunities and navigate these challenges effectively, companies must focus on innovation, cost management, and strategic partnerships. By staying attuned to evolving consumer preferences and market trends, businesses can differentiate themselves and capture market share in this dynamic and competitive landscape. One of the primary drivers is the increasing demand for lightweight travel bags, as consumers seek convenience and portability In their luggage. The market is expected to grow significantly In the coming years, reflecting the ongoing trend of global travel and the importance of staying connected while on the go.
What will be the Size of the Travel And Business Bags Market during the forecast period?
- The market is experiencing significant growth, driven by various factors. Leisure travel and international business trips continue to fuel the demand for these bags. Manufacturing processes have evolved, leading to product innovation and improved material science. Social media marketing and digital marketing have become essential tools for brands to enhance their image and reach their target audience. Design trends, including color palettes and fashion, influence consumer preferences. Customer segmentation and supply chain management strategies have become crucial for ethical sourcing and competitive pricing. Innovative approaches such as influencer marketing and after-sales service have emerged as differentiators. Materials used in the production of these bags include textile, coated fabrics, jute, and leather.
- Lifestyle choices and carry-on regulations impact the size and functionality of bags. Content marketing and search engine optimization are essential for brand visibility. Environmental impact and personal style are increasingly important considerations for consumers. The market is expected to grow further as business travel resumes and domestic travel gains popularity. Product differentiation and competitive pricing will remain key drivers.
How is this Travel And Business Bags Industry segmented?
The travel and business bags industry research report provides comprehensive data (region-wise segment analysis), with forecasts and estimates in "USD million" for the period 2025-2029, as well as historical data from 2019-2023 for the following segments.
- Product
- Travel bags
- Business bags
- Distribution Channel
- Offline
- Online
- Material
- Polyester
- Leather
- Fabric
- Others
- Geography
- North America
- US
- Canada
- Europe
- France
- Germany
- Italy
- UK
- APAC
- China
- India
- Japan
- South Korea
- North America
By Product Insights
The travel bags segment is estimated to witness significant growth during the forecast period. Travel bags, encompassing duffle bags, trolley bags, suitcases, and backpacks, represent a significant market segment in the luggage industry. The materials used to manufacture travel bags include hard-side, soft-side, and hybrid options. The increasing trend of tourism, adventure tours, and outdoor activities, particularly in emerging economies, fuels the demand for travel bags. This growth is attributed to the rising number of international tourists, as indicated by the United Nations World Tourism Organization (UNWTO), which reported approximately 975 million tourist arrivals between January and September 2023. Brand loyalty and functional design are essential factors influencing customer preferences in travel bags. Duffel bags, business bags, trolley bags, suitcases, and luggage are popular categories within this market.
Durable materials, expandable capacity, and lightweight designs are key features that cater to the needs of business professionals and frequent travelers. Sustainable materials and anti-theft features are emerging trends in the market. Online retailers and brick-and-mortar stores cater to various price points, offering a wide range of travel bags to meet diverse consumer requirements. The integration of wearable technology, such as GPS tracking and biometric security, adds value to travel bags, enhancing the overall customer experience. The market for travel bags also includes various accessories, such as packing cubes, travel wallets, and messenger bags, which offer added functionality and convenience for travelers.
The growing popularity of smart luggage, with features like digital scales and laptop compartments, is another trend shaping the market. The travel bags market is driven by the growing number of international tourists and the evolving needs and preferences of consumers. The market caters to various price points and offers a wide range of functional designs, materials, and accessories to meet the demands of business professionals and leisure travelers alike.
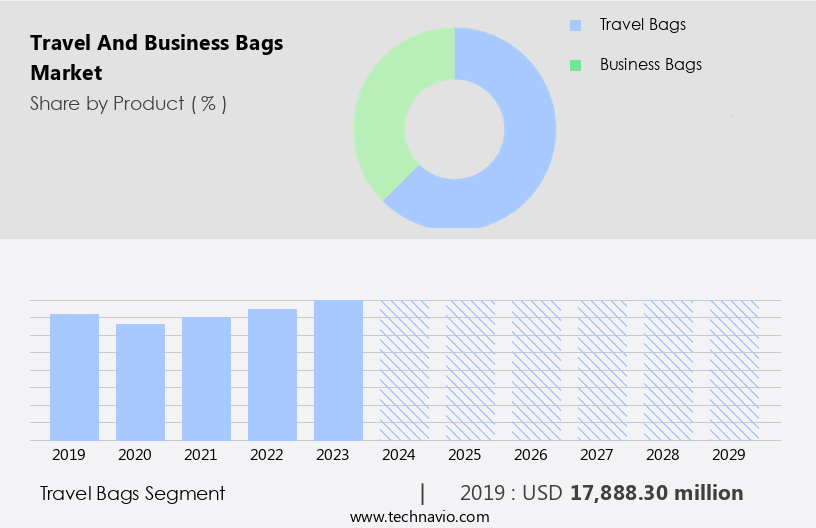
The Travel bags segment was valued at USD 17.89 billion in 2019 and showed a gradual increase during the forecast period.
Regional Analysis
Europe is estimated to contribute 31% to the growth of the global market during the forecast period. Technavio's analysts have elaborately explained the regional trends and drivers that shape the market during the forecast period.
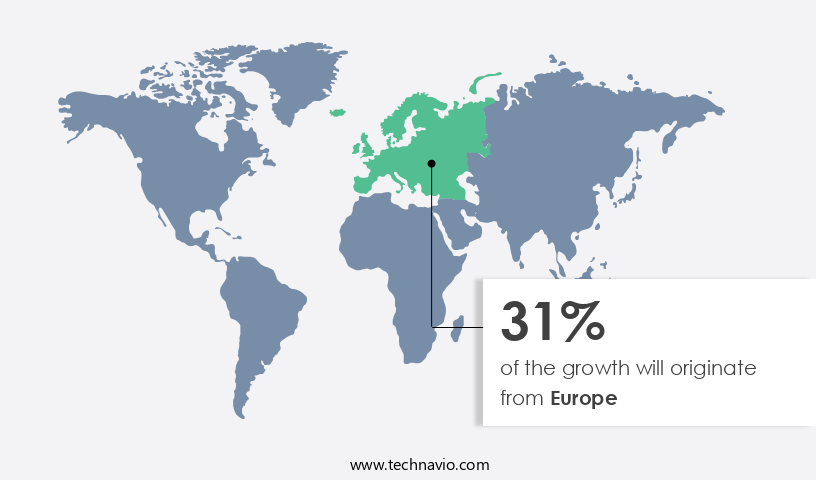
The European market is experiencing notable expansion due to Europe's reputation as a fashion hub, with numerous renowned brands based in Western European countries. The vast array of personal goods, including travel and business bags, available in this region is driving market growth. Cities like Paris, Milan, and London are known as style capitals, and these bags, particularly from luxury brands, are considered essential fashion accessories. Functional design, durability, and expandable capacity are crucial features for business professionals and frequent travelers. Sustainable materials, such as recycled fabrics, are gaining popularity due to increasing environmental consciousness. Biometric security and anti-theft features are also desirable for those concerned with safety. European cities are renowned for their fashion-conscious population, making luxury travel and business bags essential fashion accessories.
Online retailers have made shopping more convenient with product reviews and digital scales, allowing customers to compare and choose the best options based on their needs and budget. Brands offer various types of bags, including tote bags, messenger bags, duffel bags, and luggage sets, catering to diverse preferences and travel requirements. Business gifting is another significant market driver, with companies opting for high-quality, functional bags as gifts for their employees or clients. Wearable technology integration, such as GPS tracking and RFID blocking, is a trend that is gaining traction in the market. Lightweight designs and carry-on size are essential considerations for business travelers, while laptop compartments and water bottle holders are must-haves for those who need to work on the go. The market offers a wide range of bags, from soft-sided luggage and cabin luggage to hard-sided luggage and rolling bags, catering to various travel styles and preferences. Despite lockdowns, product demand remains strong, with consumers seeking smart features like laptop compartments, suit compartments, and smart locks.
Market Dynamics
Our researchers analyzed the data with 2024 as the base year, along with the key drivers, trends, and challenges. A holistic analysis of drivers will help companies refine their marketing strategies to gain a competitive advantage.
What are the Travel And Business Bags market drivers leading to the rise in the adoption of Industry?
- The increasing demand for lightweight travel bags serves as the primary market driver. The travel industry's increasing focus on weight regulations and airline fees for luggage has led to a growing demand for lightweight business bags. In response, market participants are innovating by introducing lightweight and ultra-light business bags using advanced technologies and durable materials. These bags offer convenience during travel, enabling users to carry more items while saving on luggage fees. For instance, Samsonite International's Uplite 29 Spinner weighs only 6.6 pounds, making it an ideal choice for business travelers. Lightweight business bags not only help travelers adhere to weight restrictions but also allow them to maximize their shopping potential at their travel destinations without exceeding their luggage allowance. The entertainment sector, including movies and music, also influences the market's growth.
What are the Travel And Business Bags market trends shaping the Industry?
- The increasing demand for travel and business bags equipped with advanced features represents a notable market trend in the industry. Smart bags, which may include charging ports, RFID protection, and GPS tracking, are becoming increasingly popular among professionals and frequent travelers. This trend reflects the growing need for convenience, security, and connectivity in everyday life. The travel and business bag market has witnessed significant growth due to the increasing consumer preference for smart luggage. Companies catering to this market offer a variety of products, including trolley bags with advanced features. These bags are equipped with TSA-approved fingerprint combination locks, built-in weight scales, Bluetooth proximity trackers, and integrated USB ports with internal power bank pockets. Additionally, Bluetooth proximity trackers help locate lost luggage, while the integrated USB ports and internal power bank pockets keep devices charged during travel. These features cater to the growing demand for functional and technologically advanced bags in the business and travel sectors. For instance, some bags come with built-in charging ports for electronic gadgets or pockets for storing books and magazines.
How does Travel And Business Bags market faces challenges face during its growth?
- The concurrent increase in labor costs and volatility in raw material prices poses a significant challenge to the industry's growth trajectory. The market is shaped by various factors, including the increasing production costs for international OEMs. With a significant number of factories located in Asian countries such as China, Indonesia, Bangladesh, and Vietnam, labor costs have risen rapidly over the past decade. This trend has increased the production expenses for companies, negatively impacting their profit margins. Moreover, economic instability in countries that supply raw materials further adds to the production costs. To mitigate these challenges, market participants are investing in advanced technologies, entering into collaborations, and automating their manufacturing processes. These strategies enable them to maintain competitiveness and efficiency in the market.
Exclusive Customer Landscape
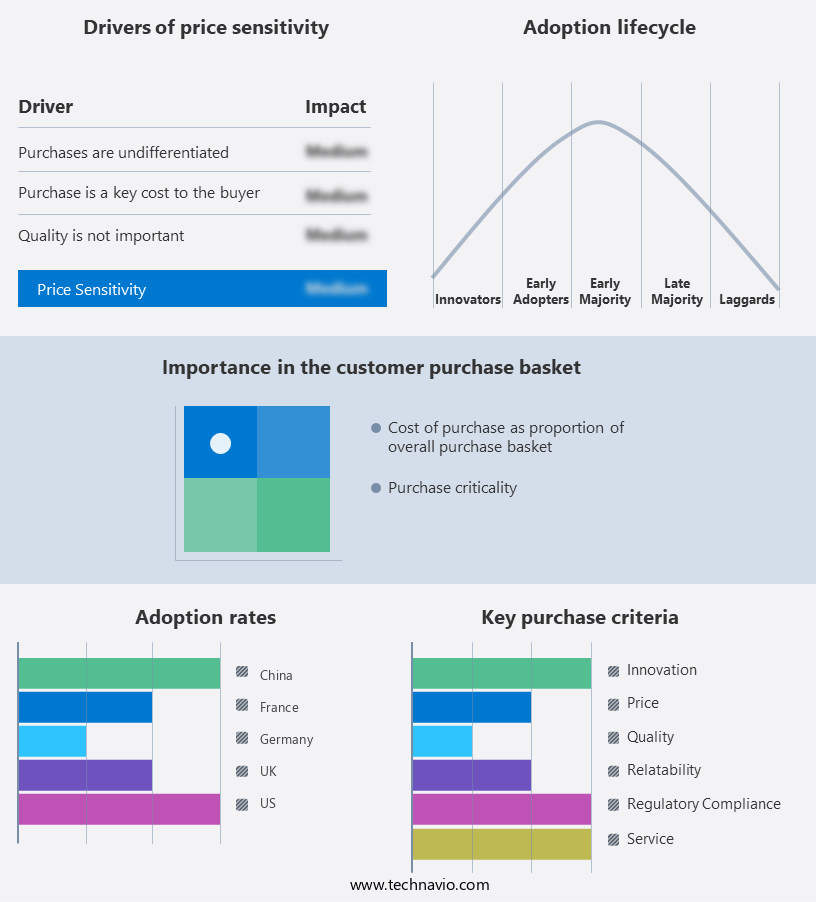
The travel and business bags market forecasting report includes the adoption lifecycle of the market, covering from the innovator's stage to the laggard's stage. It focuses on adoption rates in different regions based on penetration. Furthermore, the travel and business bags market report also includes key purchase criteria and drivers of price sensitivity to help companies evaluate and develop their market growth analysis strategies.
Customer Landscape
Key Companies & Market Insights
Companies are implementing various strategies, such as strategic alliances, travel and business bags market forecast, partnerships, mergers and acquisitions, geographical expansion, and product/service launches, to enhance their presence in the industry.
DELSEY - The company specializes in the production of high-quality travel and business bags, including the CHATELET AIR 2, SHADOW 5 Carry On, and TURENNE CARRY ON models.
The industry research and growth report includes detailed analyses of the competitive landscape of the market and information about key companies, including:
- DELSEY
- Eagle Creek Holdings LLC
- Hermes International SA
- IT Luggage Ltd.
- Kering SA
- Ohio Travel Bag LLC
- Osprey Packs Inc.
- Prada Spa
- Ralph Lauren Corp.
- Safari Industries India Ltd.
- Samsonite International S.A.
- Tapestry Inc.
- Targus Inc.
- The LVMH group
- Titan Co. Ltd.
- Tods Spa
- United States Luggage Co. LLC
- Valigeria Roncato Spa
- VIP Industries Ltd.
- Wildcraft India Pvt. Ltd.
Qualitative and quantitative analysis of companies has been conducted to help clients understand the wider business environment as well as the strengths and weaknesses of key industry players. Data is qualitatively analyzed to categorize companies as pure play, category-focused, industry-focused, and diversified; it is quantitatively analyzed to categorize companies as dominant, leading, strong, tentative, and weak.
Recent Development and News in Travel And Business Bags Market
- In March 2025, Samsonite, a leading player in the market, announced the launch of its new collection of smart luggage, the "Cruise 82" series. These bags come equipped with features such as built-in scales, GPS tracking, and a detachable power bank, making travel more convenient for consumers (Samsonite Press Release, 2025).
- In August 2024, VF Corporation, a global apparel and footwear company, completed the acquisition of Herschel Supply Co., a prominent brand in the market. This acquisition was aimed at expanding VF's portfolio in the lifestyle and accessories segment (VF Corporation Press Release, 2024).
- In January 2024, Tumi Holdings Inc. Collaborated with Microsoft to integrate Microsoft's ThinAir Wireless Charging technology into select Tumi bags. This technological collaboration allows users to charge their devices wirelessly while on the go, enhancing the functionality of business bags (Tumi Holdings Inc. Press Release, 2024).
- In November 2023, Delsey, a French luggage manufacturer, expanded its presence in the Indian market by opening a new store in New Delhi. This strategic move was aimed at tapping into the growing demand for travel and business bags in India (Delsey Press Release, 2023).
- According to the latest market research report by Technavio, The market is expected to grow at a CAGR of over 5% from 2023 to 2028, driven by factors such as increasing business travel and the growing trend of carrying multiple devices while traveling (Technavio, 2023).
Research Analyst Overview
The travel and business bag market continues to evolve, with a strong focus on enhancing customer experience and providing functional, durable, and stylish options for business professionals on the go. Brick-and-mortar stores remain a significant channel for sales, allowing customers to touch and feel the products before making a purchase. However, online retailers have gained traction due to their convenience and wide selection. Passport holders have become essential travel accessories, with many now featuring RFID blocking technology to protect against identity theft. Crossbody bags and shoulder bags have emerged as popular choices for their versatility and convenience, offering both style and functionality.
Fashion trends influence the market, with sustainable materials, such as recycled and biodegradable fabrics, gaining popularity. Durable materials, such as ballistic nylon and leather, remain staples in the market. Brand loyalty plays a crucial role in customer decision-making, with many opting for trusted brands known for their quality and functionality. Organizational pockets and compartments are in high demand, allowing travelers to keep their belongings neatly arranged and easily accessible. Weekender bags and travel accessories, such as packing cubes and expandable capacity bags, cater to the needs of frequent travelers. Price point and lightweight designs are essential considerations for budget-conscious consumers.
Functional design features, such as laptop compartments and water bottle holders, are becoming increasingly important. Wearable technology, such as GPS tracking and digital scales, are integrated into some bags to enhance the travel experience. Corporate gifting is a growing trend, with companies investing in high-quality, branded business bags for their employees and clients. The market offers a wide range of options, from tote bags and messenger bags to smart luggage and travel wallets. Anti-theft features, such as locking zippers and slash-proof materials, are becoming more common to address security concerns. Duffel bags and rolling bags cater to different travel styles and preferences.
Product reviews play a significant role in consumer decision-making, with many relying on online reviews and recommendations from trusted sources to make informed purchases. The market continues to innovate, with new materials, designs, and technologies emerging to meet the evolving needs of business travelers.
Dive into Technavio's research methodology, blending expert interviews, extensive data synthesis, and validated models for unparalleled Travel and Business Bags Market insights. See full methodology.
|
Market Scope |
|
|
Report Coverage |
Details |
|
Page number |
218 |
|
Base year |
2024 |
|
Historic period |
2019-2023 |
|
Forecast period |
2025-2029 |
|
Growth momentum & CAGR |
Accelerate at a CAGR of 8.5% |
|
Market growth 2025-2029 |
USD 15.83 billion |
|
Market structure |
Fragmented |
|
YoY growth 2024-2025(%) |
7.7 |
|
Key countries |
US, China, UK, Canada, Japan, India, Germany, France, South Korea, and Italy |
|
Competitive landscape |
Leading Companies, Market Positioning of Companies, Competitive Strategies, and Industry Risks |
What are the Key Data Covered in this Travel And Business Bags Market Research and Growth Report?
- CAGR of the Travel And Business Bags industry during the forecast period
- Detailed information on factors that will drive the growth and forecasting between 2025 and 2029
- Precise estimation of the size of the market and its contribution of the industry in focus to the parent market
- Accurate predictions about upcoming growth and trends and changes in consumer behaviour
- Growth of the market across Europe, APAC, North America, Middle East and Africa, and South America
- Thorough analysis of the market's competitive landscape and detailed information about companies
- Comprehensive analysis of factors that will challenge the travel and business bags market growth of industry companies
We can help! Our analysts can customize this travel and business bags market research report to meet your requirements.
 RIA -
RIA - 
