
Travel Market Size 2026-2030
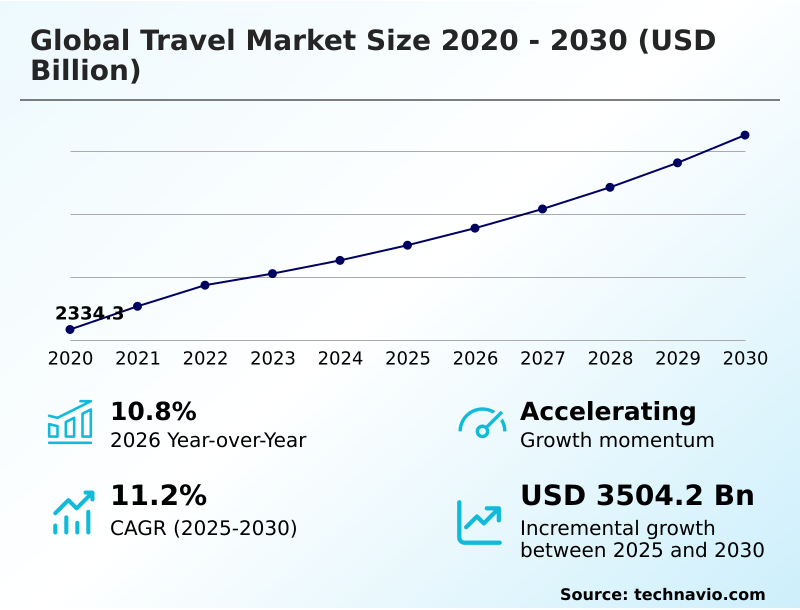
The travel market size is valued to increase by USD 3504.2 billion, at a CAGR of 11.2% from 2025 to 2030. Integration of generative AI and agentic personalization will drive the travel market.
Major Market Trends & Insights
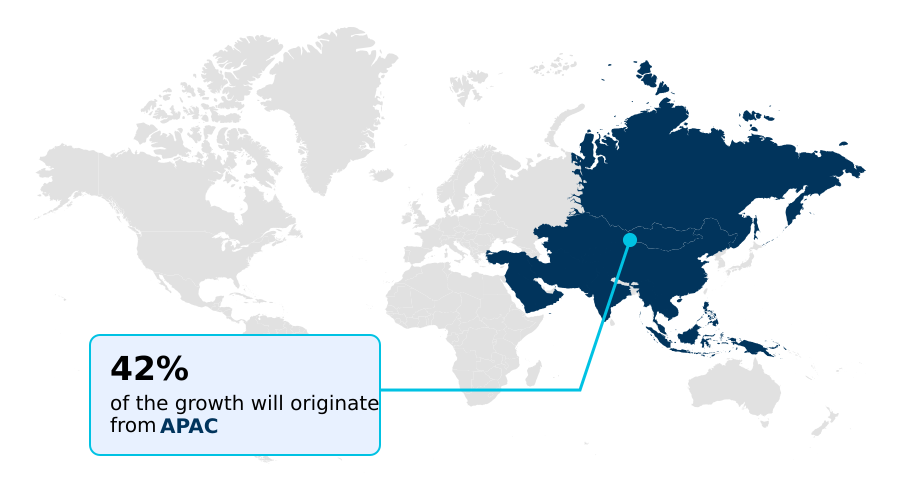
- APAC dominated the market and accounted for a 41.8% growth during the forecast period.
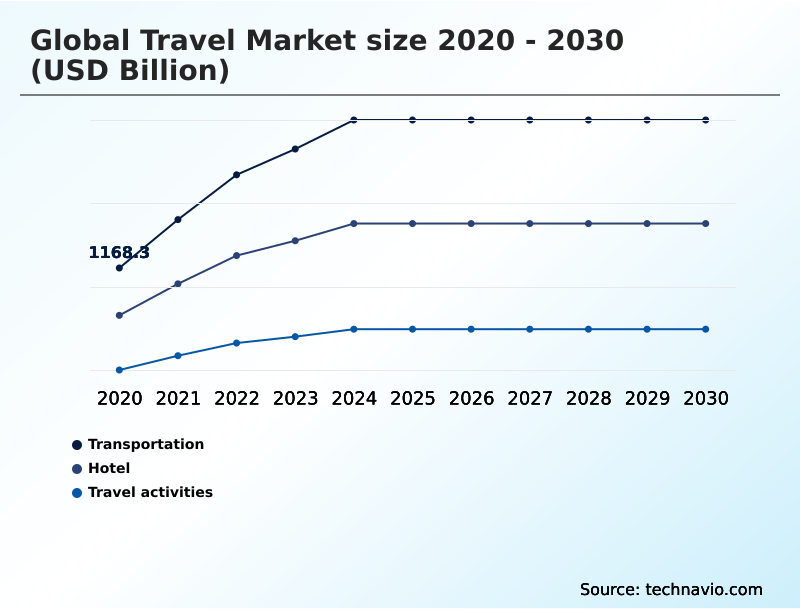
- By Sector - Transportation segment was valued at USD 2328.2 billion in 2024
- By Type - Leisure segment accounted for the largest market revenue share in 2024
Market Size & Forecast
- Market Opportunities: USD 6185.8 billion
- Market Future Opportunities: USD 3504.2 billion
- CAGR from 2025 to 2030 : 11.2%
Market Summary
- The travel market is undergoing a profound transformation, driven by technological integration and shifting consumer values. A key driver is the large-scale deployment of agentic AI systems that enable hyper-personalization at every stage of the traveler's journey, from initial planning with conversational interfaces to the creation of dynamic itineraries.
- This is complemented by a significant trend toward intentional, experience-centric travel, where activities like sleep tourism and edutainment trips are gaining prominence over traditional sightseeing. For instance, an airline can now use AI not just for demand forecasting but also for real-time fleet renewal decisions to optimize routes around geopolitical friction zones, enhancing operational efficiency.
- However, the industry faces challenges from persistent airfare inflation and complex regulatory frameworks, especially concerning data privacy with the use of biometric security and computer vision. Success in this evolving landscape requires a balance between technological innovation, offering curated high-value offerings that promise local authenticity, and building resilience against external shocks through robust crisis management.
What will be the Size of the Travel Market during the forecast period?
Get Key Insights on Market Forecast (PDF) Get Free Sample
How is the Travel Market Segmented?
The travel industry research report provides comprehensive data (region-wise segment analysis), with forecasts and estimates in "USD billion" for the period 2026-2030, as well as historical data from 2020-2024 for the following segments.
- Sector
- Transportation
- Hotel
- Travel activities
- Type
- Leisure
- Business
- End-user
- Solo
- Group
- Geography
- APAC
- China
- India
- Japan
- Europe
- Germany
- Spain
- France
- North America
- US
- Canada
- Mexico
- South America
- Brazil
- Colombia
- Middle East and Africa
- UAE
- Saudi Arabia
- South Africa
- Rest of World (ROW)
- APAC
By Sector Insights
The transportation segment is estimated to witness significant growth during the forecast period.
The transportation segment is pivotal, driven by the modernization of aviation and rail. A focus on operational efficiency has led to record-high load factors of approximately 84% as carriers maximize asset utilization amidst supply constraints.
This period is marked by significant fleet renewal, with the introduction of long-range narrowbody aircraft enhancing next-generation aircraft deployment and enabling new routes.
The widespread implementation of biometric security and automated baggage handling systems at major hubs, part of a push for biometric passenger processing, shows a clear industry direction. Sustainable transport infrastructure is also gaining traction with luxury high-speed rail projects.
Concurrently, sustainable aviation fuel mandates and carbon-neutral logistics are reshaping long-term strategies, pushing the sector toward greater technical resilience and low-carbon travel alternatives, all while under corporate travel budget scrutiny.
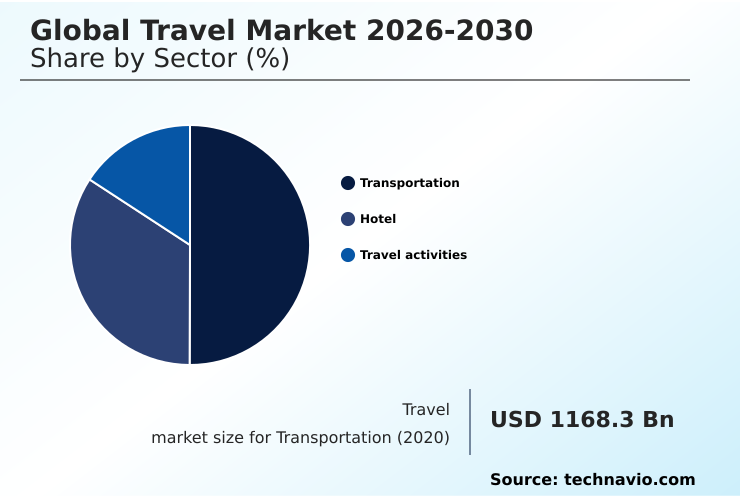
The Transportation segment was valued at USD 2328.2 billion in 2024 and showed a gradual increase during the forecast period.
Regional Analysis
APAC is estimated to contribute 41.8% to the growth of the global market during the forecast period.Technavio’s analysts have elaborately explained the regional trends and drivers that shape the market during the forecast period.
See How Travel Market Demand is Rising in APAC Get Free Sample
The APAC region is the fastest-growing geography, driven by an expanding middle class. A key development is the integration of interoperable digital payments, with one platform connecting to 40 overseas e-wallets, reducing friction for travelers.
The travel retail sector is surging, and digital nomad travel trends are encouraged by extended visa-free policies. Japan saw a 6.4% year-on-year increase in visitors, supported by improved passenger throughput.
This growth is enabled by unconventional accommodations and multi-step reasoning in booking platforms to handle complex itineraries. The region's embrace of technology, including conversational interface tools and long-term memory systems for personalization, is driving demand.
Advanced demand forecasting, ongoing fleet renewal, the rise of online travel activity booking, and a focus on experiential autonomy are also key trends shaping the region's market.
Market Dynamics
Our researchers analyzed the data with 2025 as the base year, along with the key drivers, trends, and challenges. A holistic analysis of drivers will help companies refine their marketing strategies to gain a competitive advantage.
- The strategic landscape is being reshaped by several interconnected factors. The impact of agentic AI on travel booking is profound, enabling a level of personalization that directly influences purchasing decisions. For boardroom consideration, the ROI of biometric security in airports is now a critical discussion, balancing security with the need for optimizing passenger throughput with technology.
- Operationally, navigating sustainable aviation fuel mandate compliance has become a central part of long-term fleet renewal for operational efficiency. The benefits of automated baggage handling systems are clear, but integrating IoT for hotel energy management offers another layer of cost control.
- Simultaneously, managing geopolitical risk in travel logistics has become a constant, while on the consumer front, companies are developing strategies for managing airfare inflation and addressing the challenges of dynamic pricing transparency.
- The growth of sleep tourism and coolcationing is forcing operators to rethink their offerings, while the rise of the silver solo demographic and the digital nomad impact on local economies are changing accommodation needs. This is where unified data foundations for guest personalization become essential.
- Marketing regenerative travel experiences and integrating bleisure travel integration in corporate policy are now key revenue strategies. All these shifts occur while addressing data privacy challenges with AI travel planners, navigating visa integrity fee changes, and improving demand forecasting using AI in hospitality.
- The market bifurcation is clear, with data showing luxury hotels significantly outperforming midscale properties in a high-cost environment.
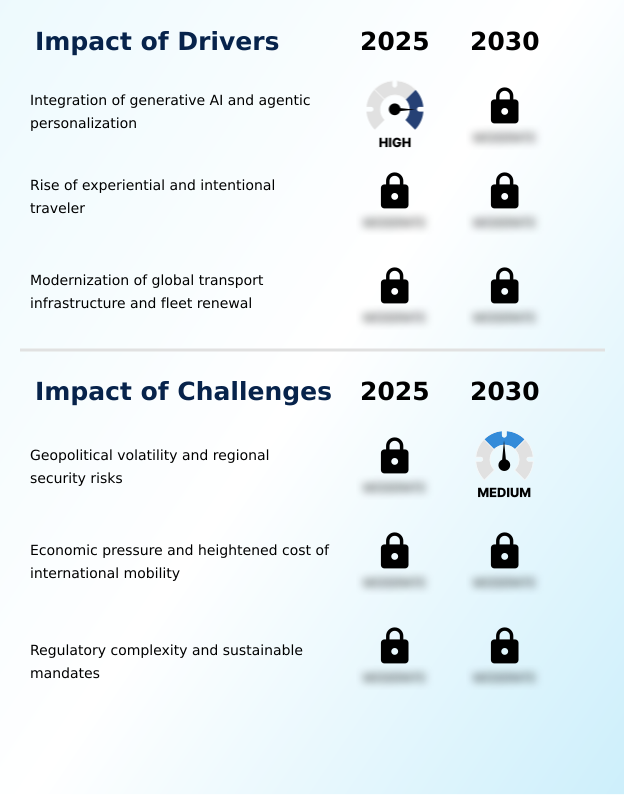
What are the key market drivers leading to the rise in the adoption of Travel Industry?
- The integration of generative AI and agentic systems for deep personalization is the primary driver shaping the market's growth trajectory.
- A fundamental driver is the shift in consumer values toward experience-centric travel, with 74% of younger travelers considering it a non-negotiable expense.
- This intentional traveler behavior is fueling niche sub-segments like sleep tourism and edutainment trips, forcing a move away from standardized packages. Providers now offer curated high-value offerings and snackable experiences that provide local authenticity.
- Another key driver is infrastructure modernization, with India reporting 12% year-on-year air traffic growth, supported by the evolution of AI travel planners into autonomous travel agents.
- The widespread adoption of agentic systems personalization allows for hyper-personalization platforms that create dynamic itineraries in real-time, boosting conversion rates and basket sizes significantly across the industry.
What are the market trends shaping the Travel Industry?
- The mainstreaming of sustainable operations is becoming a core operational driver. This shift is coupled with a rising consumer demand for regenerative travel.
- A primary trend is the shift toward regenerative travel, where consumer and regulatory pressures demand measurable climate action. This is evidenced by new regulations mandating a 2% reduction in greenhouse gas intensity for fuel supplies, promoting low-impact travel. The rise of coolcationing is part of a larger trend in milestone-driven travel where experiences are prioritized over simple tourism.
- This has accelerated adoption of tools like the flight emissions label, promoting environmental stewardship in travel. In response, providers are overhauling supply chains, integrating internet of things technology for real-time energy management and navigating new ancillary fees related to sustainability.
- The market is seeing more regenerative tourism models and low-carbon travel alternatives that focus on restoring ecosystems and providing authentic experiences.
What challenges does the Travel Industry face during its growth?
- Geopolitical volatility and escalating regional security risks present the most significant challenge to the industry's stability and growth.
- The most profound challenge is escalating geopolitical friction, which has led to widespread airspace closures requiring advanced customer service triage and causing over 21,000 flight cancellations. This geopolitical volatility impact forces operators to invest in crisis management and resilience strategies. Concurrently, persistent airfare inflation has heightened travel cost inflation.
- There is also increased regulatory complexity, particularly around dynamic pricing transparency and consumer data. The use of computer vision at airports introduces compliance burdens related to data privacy in hospitality and broader regulatory compliance in travel tech.
- These pressures are compounded by regional security risks and increased corporate travel budget scrutiny, creating a challenging environment where hotel occupancy in some hubs has fallen to 22.8%.
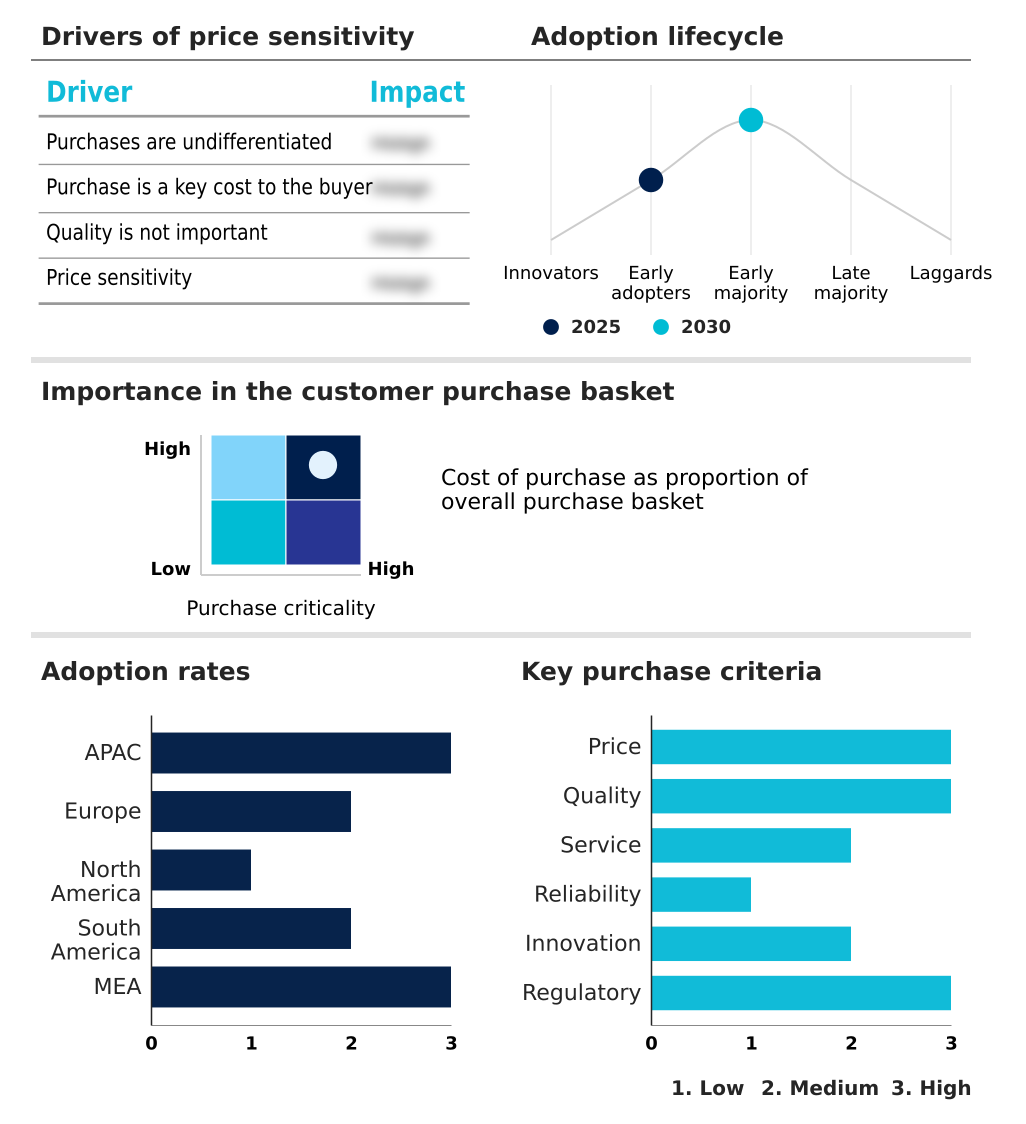
Exclusive Technavio Analysis on Customer Landscape
The travel market forecasting report includes the adoption lifecycle of the market, covering from the innovator’s stage to the laggard’s stage. It focuses on adoption rates in different regions based on penetration. Furthermore, the travel market report also includes key purchase criteria and drivers of price sensitivity to help companies evaluate and develop their market growth analysis strategies.
Customer Landscape of Travel Industry
Competitive Landscape
Companies are implementing various strategies, such as strategic alliances, travel market forecast, partnerships, mergers and acquisitions, geographical expansion, and product/service launches, to enhance their presence in the industry.
Accor S.A. - Offers integrated travel and hospitality solutions for leisure and corporate clients, encompassing booking, management, and technology-driven services.
The industry research and growth report includes detailed analyses of the competitive landscape of the market and information about key companies, including:
- Accor S.A.
- Adelman Travel System Inc.
- Airbnb Inc.
- American Express Co.
- BCD Travel
- Booking Holdings Inc.
- Corporate Travel Management Ltd
- CWT
- Direct Travel Inc.
- Expedia Group Inc.
- Fareportal Inc.
- Flight Centre Travel Group Ltd.
- FROSCH International Travel LLC
- Global Business Travel Group
- Hilton Worldwide Holdings Inc.
- Hyatt Hotels Corp.
- InterContinental Hotels Group
- Marriott International Inc.
- Omega World Travel Inc.
- World Travel Holdings
Qualitative and quantitative analysis of companies has been conducted to help clients understand the wider business environment as well as the strengths and weaknesses of key industry players. Data is qualitatively analyzed to categorize companies as pure play, category-focused, industry-focused, and diversified; it is quantitatively analyzed to categorize companies as dominant, leading, strong, tentative, and weak.
Recent Development and News in Travel market
- In January 2025, the United States Embassy in India implemented revised visa appointment procedures, introducing a one-time postponement option at no cost to improve efficiency and reduce applicant wait times.
- In March 2025, The European Commission initiated the first phase of its ReFuelEU Aviation mandate, requiring fuel suppliers at all major regional airports to incorporate a minimum 2% blend of sustainable aviation fuel.
- In October 2025, major corporate travel management firms reported a significant strategic shift among clients, with budgets increasing for in-person meetings and a pivot away from virtual-only formats to a hybrid model.
- In February 2025, The Emerging Markets Council was formed in a strategic collaboration to provide small and medium-sized travel businesses in Mexico and Latin America with digital marketing tools to reach global audiences.
Dive into Technavio’s robust research methodology, blending expert interviews, extensive data synthesis, and validated models for unparalleled Travel Market insights. See full methodology.
| Market Scope | |
|---|---|
| Page number | 291 |
| Base year | 2025 |
| Historic period | 2020-2024 |
| Forecast period | 2026-2030 |
| Growth momentum & CAGR | Accelerate at a CAGR of 11.2% |
| Market growth 2026-2030 | USD 3504.2 billion |
| Market structure | Fragmented |
| YoY growth 2025-2026(%) | 10.8% |
| Key countries | China, India, Japan, South Korea, Thailand, Indonesia, Germany, Spain, France, Italy, UK, The Netherlands, US, Canada, Mexico, Brazil, Colombia, Chile, UAE, Saudi Arabia, Egypt, South Africa and Israel |
| Competitive landscape | Leading Companies, Market Positioning of Companies, Competitive Strategies, and Industry Risks |
Research Analyst Overview
- The travel market's evolution is defined by a dual focus on hyper-personalization and operational efficiency. The core of this shift is the deployment of agentic AI, moving from simple conversational interface tools to systems capable of multi-step reasoning and leveraging long-term memory systems to create dynamic itineraries. This technology underpins critical functions like demand forecasting and customer service triage.
- On the consumer side, a move towards milestone-driven travel and experience-centric travel is fueling niche segments like sleep tourism, coolcationing, and edutainment trips. This demands curated high-value offerings that provide local authenticity through unconventional accommodations and snackable experiences.
- For boardroom-level strategy, the push for regenerative travel and low-impact travel, driven by sustainable aviation fuel mandates and tools like the flight emissions label, directly impacts capital expenditure on fleet renewal and carbon-neutral logistics.
- These investments, alongside technologies like biometric security, automated baggage handling, computer vision, and internet of things technology, are essential for improving passenger throughput, which has been shown to increase by up to 40%.
- However, this innovation occurs amidst challenges like geopolitical friction, which requires robust crisis management and resilience strategies, and economic pressures from airfare inflation, ancillary fees, and the need for dynamic pricing transparency.
What are the Key Data Covered in this Travel Market Research and Growth Report?
-
What is the expected growth of the Travel Market between 2026 and 2030?
-
USD 3504.2 billion, at a CAGR of 11.2%
-
-
What segmentation does the market report cover?
-
The report is segmented by Sector (Transportation, Hotel, and Travel activities), Type (Leisure, and Business), End-user (Solo, and Group) and Geography (APAC, Europe, North America, South America, Middle East and Africa)
-
-
Which regions are analyzed in the report?
-
APAC, Europe, North America, South America and Middle East and Africa
-
-
What are the key growth drivers and market challenges?
-
Integration of generative AI and agentic personalization, Geopolitical volatility and regional security risks
-
-
Who are the major players in the Travel Market?
-
Accor S.A., Adelman Travel System Inc., Airbnb Inc., American Express Co., BCD Travel, Booking Holdings Inc., Corporate Travel Management Ltd, CWT, Direct Travel Inc., Expedia Group Inc., Fareportal Inc., Flight Centre Travel Group Ltd., FROSCH International Travel LLC, Global Business Travel Group, Hilton Worldwide Holdings Inc., Hyatt Hotels Corp., InterContinental Hotels Group, Marriott International Inc., Omega World Travel Inc. and World Travel Holdings
-
Market Research Insights
- Market dynamics are shaped by the convergence of technology and consumer behavior. The adoption of agentic systems personalization is enabling autonomous travel agents and hyper-personalization platforms, with AI travel planners becoming standard. This intentional traveler behavior is met with next-generation aircraft deployment and the expansion of luxury high-speed rail, improving sustainable transport infrastructure.
- Biometric passenger processing is now common, though it raises data privacy in hospitality concerns. Environmental stewardship in travel is driving regenerative tourism models and low-carbon travel alternatives. However, regional security risks and geopolitical volatility impact operations, with one transit hub seeing occupancy drop to 22.8%. Travel cost inflation and corporate travel budget scrutiny are major economic pressures.
- Regulatory compliance in travel tech is tightening around intelligent property management and conversational concierge platforms.
- Success hinges on leveraging unified data foundations for system-driven personalization to cater to the digital nomad travel trends, the silver solo demographic, and the autonomy economy travel, which often involves online travel activity booking, digital detox retreats, and multigenerational group travel, all facilitated by interoperable digital payments within the travel retail sector.
We can help! Our analysts can customize this travel market research report to meet your requirements.
 RIA -
RIA - 
