Truck Platooning System Market Analysis North America, Europe, APAC, Middle East and Africa, South America - US, Germany, China, UK, Canada - Size and Forecast 2024-2028

Truck Platooning System Market Analysis North America, Europe, APAC, Middle East and Africa, South America - US, Germany, China, UK, Canada - Size and Forecast 2024-2028

Published: Jul 2024 158 Pages SKU: IRTNTR75342

Market Overview at a Glance

$2.25 B
Market Opportunity
77.99%
CAGR
59.83
YoY growth 2023-2024(%)

Truck Platooning System Market Size 2024-2028

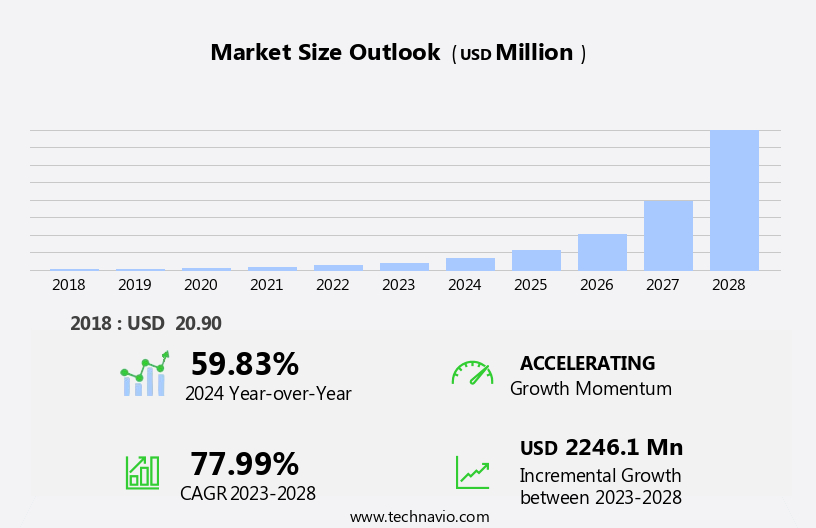
The truck platooning system market size is forecast to increase by USD 2.25 billion at a CAGR of 77.99% between 2023 and 2028.

  • The market is experiencing significant growth due to the increasing demand from fleet operators to reduce operating costs and fuel consumption. This trend is being driven by the adoption of self-driving trucks, which allow for closer vehicle following and aerodynamic benefits, leading to improved fuel efficiency. However, the high cost of implementing truck platooning systems remains a significant challenge for market growth. This includes the expense of purchasing the necessary technology and infrastructure, as well as the training and certification of drivers to operate in platoons.
  • Despite this, companies seeking to capitalize on the market opportunities presented by truck platooning should focus on collaborating with technology providers and industry partners to share costs and resources, as well as exploring government incentives and grants to offset implementation costs. By navigating these challenges effectively, companies can position themselves to benefit from the growing demand for fuel-efficient and cost-effective transportation solutions.

What will be the Size of the Truck Platooning System Market during the forecast period?

Truck Platooning System Market Size

 Request Free Sample

  • The truck platooning market is experiencing significant growth as vehicle-to-infrastructure (V2I) technology gains traction. IVECO S and the Ensemble Consortium are spearheading this innovation through their collaborative efforts. Autonomous truck platooning, a type of platooning, leverages v2v communication to enhance efficiency and reduce fuel consumption. Technology advancements in automation and connected vehicle technology are driving this trend. Private-public partnerships are essential for the market's expansion, with vehicle manufacturers and component suppliers playing pivotal roles. High costs associated with hardware and communication technology implementation remain a challenge.
  • Road safety benefits, such as forward collision avoidance and active brake assist, are compelling reasons for the trucking industry's adoption of platooning technology. Market expansion is expected to continue, with software advancements and the evolution of peloton technology being key factors. (March 2022)

How is this Truck Platooning System Industry segmented?

The truck platooning system industry research report provides comprehensive data (region-wise segment analysis), with forecasts and estimates in "USD million" for the period 2024-2028, as well as historical data from 2018-2022 for the following segments.
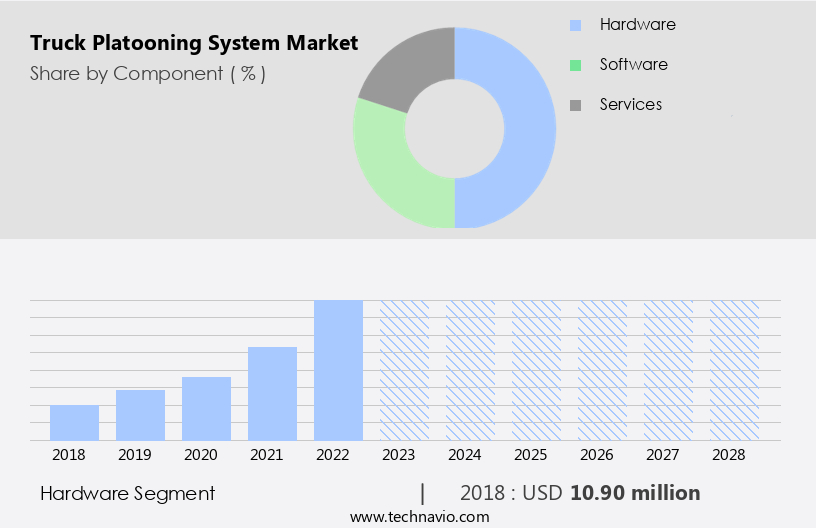
  • Component
    • Hardware
    • Software
    • Services
  • Vehicle Type
    • HCV
    • LCV
  • Geography
    • North America
      • US
      • Canada
    • Europe
      • Germany
      • UK
    • Middle East and Africa
      • APAC
        • China
      • South America
        • Rest of World (ROW)

        By Component Insights

        The hardware segment is estimated to witness significant growth during the forecast period.

        Truck platooning, a form of vehicle automation, relies on advanced hardware components to function effectively. These components include cameras, sensors, radar, and communication devices. The system's cameras, installed on the front, sides, and back of trucks, offer real-time video feeds to both the driver and platoon coordinator. They aid in detecting obstacles, monitoring traffic, and facilitating communication between platoon trucks. Sensors, primarily radio frequency and electronic types, are essential for detecting the distance between trucks and ensuring safe driving. They help maintain a safe following distance and regulate the relative speed of trucks in the platoon. Moreover, regulations, such as European Emission Standards, are driving the adoption of fuel-efficient technologies in the trucking industry.

        Autonomous driving components, including adaptive cruise control and active brake assist, are becoming increasingly popular. These technologies optimize fuel consumption, reduce emissions, and enhance road safety. Private-public partnerships and smart driving technologies, such as Vehicle-to-Infrastructure (V2I) and Vehicle-to-Vehicle (V2V) communication, are also transforming the trucking landscape. V2I enables real-time data exchange between vehicles and infrastructure, while V2V communication facilitates communication between vehicles. These technologies help improve traffic flow, reduce congestion, and enhance safety. Furthermore, the logistics industry is embracing truck platooning to improve efficiency and reduce costs. Platooning lanes and platoon coordination systems, like PlatoonPro, are being developed to facilitate the deployment of autonomous truck platoons.

        These systems optimize fuel savings by reducing wind resistance and aerodynamic drafting. However, challenges such as high costs, human error, and weather conditions pose hurdles to the widespread adoption of truck platooning. Market expansion and development work in communication technology and automation are ongoing to address these challenges. The future of truck platooning lies in the integration of fully autonomous vehicles and high-speed communication networks. In summary, hardware components, including cameras, sensors, radar, and communication devices, play a crucial role in the functioning of truck platooning systems. Regulations, smart driving technologies, and private-public partnerships are driving the growth of the market.

        Challenges, such as high costs and human error, are being addressed through ongoing development work in communication technology and automation.

        Truck Platooning System Market Size

        Get a glance at the market report of share of various segments Request Free Sample

        The Hardware segment was valued at USD 10.90 billion in 2018 and showed a gradual increase during the forecast period.

        Regional Analysis

        North America is estimated to contribute 40% to the growth of the global market during the forecast period.Technavio’s analysts have elaborately explained the regional trends and drivers that shape the market during the forecast period.

        Truck Platooning System Market Share by Geography

        For more insights on the market size of various regions, Request Free Sample

        The market is experiencing significant growth due to various factors. One key driver is the integration of advanced technologies, such as hardware upgrades and software upgrades, into vehicles. For instance, the adoption of forward collision avoidance systems, adaptive cruise control, and platooning type technologies is increasing, enabling trucks to maintain a safe distance from each other and optimize fuel consumption. Moreover, private-public partnerships and collaborations, such as the ENSEMBLE consortium, are fostering the development of smart driving technologies, including vehicle-to-vehicle (V2V) communication and vehicle-to-infrastructure (V2I) systems. These technologies enable real-time data exchange between vehicles and infrastructure, improving road safety and traffic flow.

        Another significant trend is the increasing focus on reducing emissions and improving fuel efficiency. Euro Norms and other regulations are driving the adoption of fuel-efficient technologies, such as aerodynamic drafting and platooning, which can reduce wind resistance and save fuel. Additionally, the logistics industry is adopting truck platooning to optimize long-haul operations and reduce traffic congestion. However, challenges such as high costs, human error, and weather conditions pose significant hurdles to market growth. To address these challenges, companies are investing in communication technology and developing autonomous driving components, such as lidar and radar sensors, to enhance safety and efficiency.

        Furthermore, the market is witnessing the emergence of fully autonomous vehicles and autonomous truck platooning, which offer significant growth opportunities. These technologies enable vehicles to communicate with each other and adapt to changing traffic conditions, improving overall road safety and reducing the need for human intervention. In conclusion, the market is witnessing significant advancements, driven by the integration of advanced technologies, growing demand for eco-friendly transportation solutions, and the need to improve road safety and reduce traffic congestion. Despite challenges, the market is expected to continue growing, with significant opportunities in the development of autonomous driving components and fully autonomous vehicles.

        Market Dynamics

        Our researchers analyzed the data with 2023 as the base year, along with the key drivers, trends, and challenges. A holistic analysis of drivers will help companies refine their marketing strategies to gain a competitive advantage.

        What are the key market drivers leading to the rise in the adoption of Truck Platooning System Industry?

        • Increase in demand to reduce operating cost and fuel consumption by fleet is the key driver of the market. 

        • The market is experiencing significant growth due to the increasing demand from fleet operators to minimize operating costs and optimize fuel consumption. This trend is driven by the need to enhance fuel efficiency and reduce emissions. By enabling trucks to travel in close formation, platooning systems decrease air resistance and aerodynamic drag, resulting in lower fuel usage and emissions. In the face of mounting pressure to cut operational expenses, these systems offer a viable solution. They boost efficiency, allowing fleets to transport larger volumes of goods and expedite deliveries.
        • Furthermore, automating the driving process through platooning systems reduces the risk of human error, ensuring safer and more dependable operations. Fleet operators stand to benefit immensely from the implementation of these systems.

        What are the market trends shaping the Truck Platooning System Industry?

        • Increase in adoption of self-driving trucks is the upcoming market trend. 

        • The market is witnessing a notable growth due to the rising demand for efficient and safe transportation of goods over long distances. Self-driving trucks, a key component of this market, are equipped with advanced technologies such as sensors, cameras, and GPS systems, enabling them to navigate roads autonomously. This feature allows self-driving trucks to travel long distances without requiring rest breaks, which is a significant advantage over human-driven trucks.
        • Another major advantage of self-driving trucks is their ability to travel in platoons, where trucks move closely together, reducing air resistance and improving fuel efficiency. The increasing adoption of self-driving trucks is expected to revolutionize the transportation industry by enhancing productivity, reducing fuel consumption, and ensuring road safety.

        What challenges does the Truck Platooning System Industry face during its growth?

        • High cost of implementing truck platooning system is a key challenge affecting the industry growth. 

        • Truck platooning, an advanced technology, is gaining traction in the logistics industry. This system enables a group of trucks to travel in a convoy, with the lead truck controlling the others via communication technology. The benefits of truck platooning are substantial, including reduced fuel consumption and increased efficiency for goods transportation. However, the high implementation cost is a significant barrier to widespread adoption.
        • Estimates suggest the cost can range from USD40,000 to USD100,000 per truck, which includes expenses for sensors, cameras, software, and driver training. This financial hurdle poses a challenge for many trucking companies. Despite the initial investment, the long-term savings and operational improvements may justify the expense for those in the transportation sector.

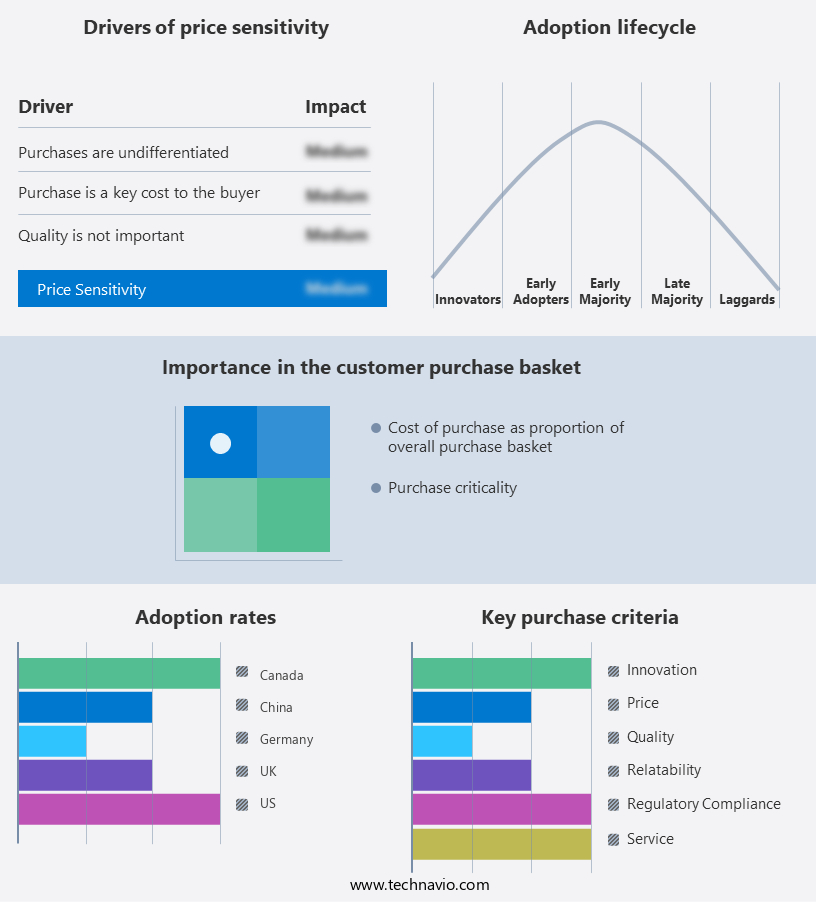
        Exclusive Customer Landscape

        The truck platooning system market forecasting report includes the adoption lifecycle of the market, covering from the innovator’s stage to the laggard’s stage. It focuses on adoption rates in different regions based on penetration. Furthermore, the truck platooning system market report also includes key purchase criteria and drivers of price sensitivity to help companies evaluate and develop their market growth analysis strategies.

        Truck Platooning System Market Share by Geography

         Customer Landscape

        Key Companies & Market Insights

        Companies are implementing various strategies, such as strategic alliances, truck platooning system market forecast, partnerships, mergers and acquisitions, geographical expansion, and product/service launches, to enhance their presence in the industry.

        AB Volvo - Volvo Trucks introduces advanced truck platooning technology, enabling seamless vehicle synchronization and fuel efficiency improvements for commercial fleets. This cutting-edge system streamlines transportation logistics by reducing gaps between trucks, optimizing fuel consumption, and enhancing road safety. By leveraging connectivity and automation, Volvo Trucks empowers fleet operators to boost productivity and reduce operational costs.

        The industry research and growth report includes detailed analyses of the competitive landscape of the market and information about key companies, including:

        • AB Volvo
        • Aptiv Plc
        • Continental AG
        • Daimler Truck AG
        • Iveco SpA
        • PACCAR Inc.
        • Peloton Technology Inc.
        • Robert Bosch GmbH
        • Toyota Tsusho Corp.
        • Traton SE
        • ZF Friedrichshafen AG

        Qualitative and quantitative analysis of companies has been conducted to help clients understand the wider business environment as well as the strengths and weaknesses of key industry players. Data is qualitatively analyzed to categorize companies as pure play, category-focused, industry-focused, and diversified; it is quantitatively analyzed to categorize companies as dominant, leading, strong, tentative, and weak.

        Research Analyst Overview

        The market is witnessing significant growth as the logistics industry seeks to enhance road safety, reduce fuel consumption, and mitigate the impact of environmental regulations. This market is characterized by the collaboration of various stakeholders, including vehicle manufacturers, technology developers, and government entities. Hardware upgrades are a crucial aspect of the truck platooning system, with the integration of advanced sensors and communication technologies playing a pivotal role. Ensemble consortiums, comprised of industry leaders, are spearheading the development of these systems, focusing on vehicle-to-infrastructure (V2I) and vehicle-to-vehicle (V2V) communication. Platooning technology is designed to optimize fuel efficiency by reducing air resistance through aerodynamic drafting.

        However, challenges such as accidents, terrain, weather conditions, and human error necessitate continuous software upgrades and the implementation of advanced safety features like active brake assist and adaptive cruise control. The adoption of platooning systems is gaining traction in the logistics industry due to their potential to alleviate the shortage of drivers and reduce fuel consumption. The growth opportunity is immense, with the market expansion expected to be driven by the increasing demand for real-time data and the implementation of European emission norms. Private-public partnerships are essential for the successful implementation of platooning systems, with governments and industry players collaborating to establish platooning lanes and supplementary infrastructure.

        The development work involves the integration of various components, including radars, lidar, and forward collision avoidance systems, to ensure seamless communication and coordination between vehicles. The trucking industry is embracing smart driving technologies to improve efficiency and reduce emissions. Platooning systems are a significant step towards autonomous trucking, with the potential to revolutionize long-haul operations. However, the high costs associated with the development and implementation of these systems pose a challenge. The evolving stage of platooning technology is marked by the integration of autonomous driving components and the gradual shift towards fully autonomous vehicles. The technology is expected to have a significant impact on the logistics sectors, with breakouts in various industries, including transportation and logistics, expected in the coming years.

        Despite the numerous benefits of platooning systems, challenges remain, including the need for reliable communication technology, the optimization of fuel-efficient platooning types, and the development of entrance/exit points for platoons. The market is expected to continue growing, driven by the need for improved road safety, optimized fuel consumption, and the reduction of greenhouse gas emissions. In conclusion, the market is a dynamic and evolving space, driven by the need for improved road safety, reduced fuel consumption, and the implementation of emission norms. The collaboration of various stakeholders, including vehicle manufacturers, technology developers, and government entities, is essential for the successful implementation of these systems.

        The challenges remain significant, but the potential benefits are immense, making the market an exciting and innovative space to watch.

        Market Scope

        Report Coverage

        Details

        Page number

        158

        Base year

        2023

        Historic period

        2018-2022

        Forecast period

        2024-2028

        Growth momentum & CAGR

        Accelerate at a CAGR of 77.99%

        Market growth 2024-2028

        USD 2246.1 million

        Market structure

        Concentrated

        YoY growth 2023-2024(%)

        59.83

        Key countries

        US, Germany, China, UK, and Canada

        Competitive landscape

        Leading Companies, Market Positioning of Companies, Competitive Strategies, and Industry Risks

        Request Free Sample

        What are the Key Data Covered in this Truck Platooning System Market Research and Growth Report?

        • CAGR of the Truck Platooning System industry during the forecast period
        • Detailed information on factors that will drive the growth and forecasting between 2024 and 2028
        • Precise estimation of the size of the market and its contribution of the industry in focus to the parent market
        • Accurate predictions about upcoming growth and trends and changes in consumer behaviour
        • Growth of the market across North America, Europe, APAC, Middle East and Africa, and South America
        • Thorough analysis of the market’s competitive landscape and detailed information about companies
        • Comprehensive analysis of factors that will challenge the truck platooning system market growth of industry companies

        We can help! Our analysts can customize this truck platooning system market research report to meet your requirements.

        Get in touch


        1 Executive Summary

        • 1.1 Market overview
          • Executive Summary - Chart on Market Overview
          • Executive Summary - Data Table on Market Overview
          • Executive Summary - Chart on Global Market Characteristics
          • Executive Summary - Chart on Market by Geography
          • Executive Summary - Chart on Market Segmentation by Component
          • Executive Summary - Chart on Market Segmentation by Vehicle Type
          • Executive Summary - Chart on Incremental Growth
          • Executive Summary - Data Table on Incremental Growth
          • Executive Summary - Chart on Company Market Positioning

        2 Market Landscape

        • 2.1 Market ecosystem
          • Parent Market
          • Data Table on - Parent Market
        • 2.2 Market characteristics
          • Market characteristics analysis
        • 2.3 Value chain analysis
          • Value Chain Analysis

        3 Market Sizing

        • 3.1 Market definition
          • Offerings of companies included in the market definition
        • 3.2 Market segment analysis
          • Market segments
        • 3.3 Market size 2023
          • 3.4 Market outlook: Forecast for 2023-2028
            • Chart on Global - Market size and forecast 2023-2028 ($ million)
            • Data Table on Global - Market size and forecast 2023-2028 ($ million)
            • Chart on Global Market: Year-over-year growth 2023-2028 (%)
            • Data Table on Global Market: Year-over-year growth 2023-2028 (%)

          4 Historic Market Size

          • 4.1 Global Truck Platooning System Market 2018 - 2022
            • Historic Market Size - Data Table on Global Truck Platooning System Market 2018 - 2022 ($ million)
          • 4.2 Component segment analysis 2018 - 2022
            • Historic Market Size - Component Segment 2018 - 2022 ($ million)
          • 4.3 Vehicle Type segment analysis 2018 - 2022
            • Historic Market Size - Vehicle Type Segment 2018 - 2022 ($ million)
          • 4.4 Geography segment analysis 2018 - 2022
            • Historic Market Size - Geography Segment 2018 - 2022 ($ million)
          • 4.5 Country segment analysis 2018 - 2022
            • Historic Market Size - Country Segment 2018 - 2022 ($ million)

          5 Five Forces Analysis

          • 5.1 Five forces summary
            • Five forces analysis - Comparison between 2023 and 2028
          • 5.2 Bargaining power of buyers
            • Bargaining power of buyers - Impact of key factors 2023 and 2028
          • 5.3 Bargaining power of suppliers
            • Bargaining power of suppliers - Impact of key factors in 2023 and 2028
          • 5.4 Threat of new entrants
            • Threat of new entrants - Impact of key factors in 2023 and 2028
          • 5.5 Threat of substitutes
            • Threat of substitutes - Impact of key factors in 2023 and 2028
          • 5.6 Threat of rivalry
            • Threat of rivalry - Impact of key factors in 2023 and 2028
          • 5.7 Market condition
            • Chart on Market condition - Five forces 2023 and 2028

          6 Market Segmentation by Component

          • 6.1 Market segments
            • Chart on Component - Market share 2023-2028 (%)
            • Data Table on Component - Market share 2023-2028 (%)
          • 6.2 Comparison by Component
            • Chart on Comparison by Component
            • Data Table on Comparison by Component
          • 6.3 Hardware - Market size and forecast 2023-2028
            • Chart on Hardware - Market size and forecast 2023-2028 ($ million)
            • Data Table on Hardware - Market size and forecast 2023-2028 ($ million)
            • Chart on Hardware - Year-over-year growth 2023-2028 (%)
            • Data Table on Hardware - Year-over-year growth 2023-2028 (%)
          • 6.4 Software - Market size and forecast 2023-2028
            • Chart on Software - Market size and forecast 2023-2028 ($ million)
            • Data Table on Software - Market size and forecast 2023-2028 ($ million)
            • Chart on Software - Year-over-year growth 2023-2028 (%)
            • Data Table on Software - Year-over-year growth 2023-2028 (%)
          • 6.5 Services - Market size and forecast 2023-2028
            • Chart on Services - Market size and forecast 2023-2028 ($ million)
            • Data Table on Services - Market size and forecast 2023-2028 ($ million)
            • Chart on Services - Year-over-year growth 2023-2028 (%)
            • Data Table on Services - Year-over-year growth 2023-2028 (%)
          • 6.6 Market opportunity by Component
            • Market opportunity by Component ($ million)
            • Data Table on Market opportunity by Component ($ million)

          7 Market Segmentation by Vehicle Type

          • 7.1 Market segments
            • Chart on Vehicle Type - Market share 2023-2028 (%)
            • Data Table on Vehicle Type - Market share 2023-2028 (%)
          • 7.2 Comparison by Vehicle Type
            • Chart on Comparison by Vehicle Type
            • Data Table on Comparison by Vehicle Type
          • 7.3 HCV - Market size and forecast 2023-2028
            • Chart on HCV - Market size and forecast 2023-2028 ($ million)
            • Data Table on HCV - Market size and forecast 2023-2028 ($ million)
            • Chart on HCV - Year-over-year growth 2023-2028 (%)
            • Data Table on HCV - Year-over-year growth 2023-2028 (%)
          • 7.4 LCV - Market size and forecast 2023-2028
            • Chart on LCV - Market size and forecast 2023-2028 ($ million)
            • Data Table on LCV - Market size and forecast 2023-2028 ($ million)
            • Chart on LCV - Year-over-year growth 2023-2028 (%)
            • Data Table on LCV - Year-over-year growth 2023-2028 (%)
          • 7.5 Market opportunity by Vehicle Type
            • Market opportunity by Vehicle Type ($ million)
            • Data Table on Market opportunity by Vehicle Type ($ million)

          8 Customer Landscape

          • 8.1 Customer landscape overview
            • Analysis of price sensitivity, lifecycle, customer purchase basket, adoption rates, and purchase criteria

          9 Geographic Landscape

          • 9.1 Geographic segmentation
            • Chart on Market share by geography 2023-2028 (%)
            • Data Table on Market share by geography 2023-2028 (%)
          • 9.2 Geographic comparison
            • Chart on Geographic comparison
            • Data Table on Geographic comparison
          • 9.3 North America - Market size and forecast 2023-2028
            • Chart on North America - Market size and forecast 2023-2028 ($ million)
            • Data Table on North America - Market size and forecast 2023-2028 ($ million)
            • Chart on North America - Year-over-year growth 2023-2028 (%)
            • Data Table on North America - Year-over-year growth 2023-2028 (%)
          • 9.4 Europe - Market size and forecast 2023-2028
            • Chart on Europe - Market size and forecast 2023-2028 ($ million)
            • Data Table on Europe - Market size and forecast 2023-2028 ($ million)
            • Chart on Europe - Year-over-year growth 2023-2028 (%)
            • Data Table on Europe - Year-over-year growth 2023-2028 (%)
          • 9.5 APAC - Market size and forecast 2023-2028
            • Chart on APAC - Market size and forecast 2023-2028 ($ million)
            • Data Table on APAC - Market size and forecast 2023-2028 ($ million)
            • Chart on APAC - Year-over-year growth 2023-2028 (%)
            • Data Table on APAC - Year-over-year growth 2023-2028 (%)
          • 9.6 Middle East and Africa - Market size and forecast 2023-2028
            • Chart on Middle East and Africa - Market size and forecast 2023-2028 ($ million)
            • Data Table on Middle East and Africa - Market size and forecast 2023-2028 ($ million)
            • Chart on Middle East and Africa - Year-over-year growth 2023-2028 (%)
            • Data Table on Middle East and Africa - Year-over-year growth 2023-2028 (%)
          • 9.7 South America - Market size and forecast 2023-2028
            • Chart on South America - Market size and forecast 2023-2028 ($ million)
            • Data Table on South America - Market size and forecast 2023-2028 ($ million)
            • Chart on South America - Year-over-year growth 2023-2028 (%)
            • Data Table on South America - Year-over-year growth 2023-2028 (%)
          • 9.8 US - Market size and forecast 2023-2028
            • Chart on US - Market size and forecast 2023-2028 ($ million)
            • Data Table on US - Market size and forecast 2023-2028 ($ million)
            • Chart on US - Year-over-year growth 2023-2028 (%)
            • Data Table on US - Year-over-year growth 2023-2028 (%)
          • 9.9 Germany - Market size and forecast 2023-2028
            • Chart on Germany - Market size and forecast 2023-2028 ($ million)
            • Data Table on Germany - Market size and forecast 2023-2028 ($ million)
            • Chart on Germany - Year-over-year growth 2023-2028 (%)
            • Data Table on Germany - Year-over-year growth 2023-2028 (%)
          • 9.10 China - Market size and forecast 2023-2028
            • Chart on China - Market size and forecast 2023-2028 ($ million)
            • Data Table on China - Market size and forecast 2023-2028 ($ million)
            • Chart on China - Year-over-year growth 2023-2028 (%)
            • Data Table on China - Year-over-year growth 2023-2028 (%)
          • 9.11 UK - Market size and forecast 2023-2028
            • Chart on UK - Market size and forecast 2023-2028 ($ million)
            • Data Table on UK - Market size and forecast 2023-2028 ($ million)
            • Chart on UK - Year-over-year growth 2023-2028 (%)
            • Data Table on UK - Year-over-year growth 2023-2028 (%)
          • 9.12 Canada - Market size and forecast 2023-2028
            • Chart on Canada - Market size and forecast 2023-2028 ($ million)
            • Data Table on Canada - Market size and forecast 2023-2028 ($ million)
            • Chart on Canada - Year-over-year growth 2023-2028 (%)
            • Data Table on Canada - Year-over-year growth 2023-2028 (%)
          • 9.13 Market opportunity by geography
            • Market opportunity by geography ($ million)
            • Data Tables on Market opportunity by geography ($ million)

          10 Drivers, Challenges, and Opportunity/Restraints

          • 10.1 Market drivers
            • 10.2 Market challenges
              • 10.3 Impact of drivers and challenges
                • Impact of drivers and challenges in 2023 and 2028
              • 10.4 Market opportunities/restraints

                11 Competitive Landscape

                • 11.1 Overview
                  • 11.2 Competitive Landscape
                    • Overview on criticality of inputs and factors of differentiation
                  • 11.3 Landscape disruption
                    • Overview on factors of disruption
                  • 11.4 Industry risks
                    • Impact of key risks on business

                  12 Competitive Analysis

                  • 12.1 Companies profiled
                    • Companies covered
                  • 12.2 Market positioning of companies
                    • Matrix on companies position and classification
                  • 12.3 AB Volvo
                    • AB Volvo - Overview
                    • AB Volvo - Business segments
                    • AB Volvo - Key news
                    • AB Volvo - Key offerings
                    • AB Volvo - Segment focus
                  • 12.4 Aptiv Plc
                    • Aptiv Plc - Overview
                    • Aptiv Plc - Business segments
                    • Aptiv Plc - Key news
                    • Aptiv Plc - Key offerings
                    • Aptiv Plc - Segment focus
                  • 12.5 Continental AG
                    • Continental AG - Overview
                    • Continental AG - Business segments
                    • Continental AG - Key news
                    • Continental AG - Key offerings
                    • Continental AG - Segment focus
                  • 12.6 Daimler Truck AG
                    • Daimler Truck AG - Overview
                    • Daimler Truck AG - Business segments
                    • Daimler Truck AG - Key news
                    • Daimler Truck AG - Key offerings
                    • Daimler Truck AG - Segment focus
                  • 12.7 Iveco SpA
                    • Iveco SpA - Overview
                    • Iveco SpA - Product / Service
                    • Iveco SpA - Key offerings
                  • 12.8 PACCAR Inc.
                    • PACCAR Inc. - Overview
                    • PACCAR Inc. - Business segments
                    • PACCAR Inc. - Key news
                    • PACCAR Inc. - Key offerings
                    • PACCAR Inc. - Segment focus
                  • 12.9 Peloton Technology Inc.
                    • Peloton Technology Inc. - Overview
                    • Peloton Technology Inc. - Product / Service
                    • Peloton Technology Inc. - Key offerings
                  • 12.10 Robert Bosch GmbH
                    • Robert Bosch GmbH - Overview
                    • Robert Bosch GmbH - Product / Service
                    • Robert Bosch GmbH - Key news
                    • Robert Bosch GmbH - Key offerings
                  • 12.11 Toyota Tsusho Corp.
                    • Toyota Tsusho Corp. - Overview
                    • Toyota Tsusho Corp. - Business segments
                    • Toyota Tsusho Corp. - Key news
                    • Toyota Tsusho Corp. - Key offerings
                    • Toyota Tsusho Corp. - Segment focus
                  • 12.12 Traton SE
                    • Traton SE - Overview
                    • Traton SE - Business segments
                    • Traton SE - Key offerings
                    • Traton SE - Segment focus
                  • 12.13 ZF Friedrichshafen AG
                    • ZF Friedrichshafen AG - Overview
                    • ZF Friedrichshafen AG - Business segments
                    • ZF Friedrichshafen AG - Key news
                    • ZF Friedrichshafen AG - Key offerings
                    • ZF Friedrichshafen AG - Segment focus

                  13 Appendix

                  • 13.1 Scope of the report
                    • 13.2 Inclusions and exclusions checklist
                      • Inclusions checklist
                      • Exclusions checklist
                    • 13.3 Currency conversion rates for US$
                      • Currency conversion rates for US$
                    • 13.4 Research methodology
                      • Research methodology
                    • 13.5 Data procurement
                      • Information sources
                    • 13.6 Data validation
                      • Data validation
                    • 13.7 Validation techniques employed for market sizing
                      • Validation techniques employed for market sizing
                    • 13.8 Data synthesis
                      • Data synthesis
                    • 13.9 360 degree market analysis
                      • 360 degree market analysis
                    • 13.10 List of abbreviations
                      • List of abbreviations

                    Research Methodology

                    Technavio presents a detailed picture of the market by way of study, synthesis, and summation of data from multiple sources. The analysts have presented the various facets of the market with a particular focus on identifying the key industry influencers. The data thus presented is comprehensive, reliable, and the result of extensive research, both primary and secondary.

                    INFORMATION SOURCES

                    Primary sources

                    • Manufacturers and suppliers
                    • Channel partners
                    • Industry experts
                    • Strategic decision makers

                    Secondary sources

                    • Industry journals and periodicals
                    • Government data
                    • Financial reports of key industry players
                    • Historical data
                    • Press releases

                    DATA ANALYSIS

                    Data Synthesis

                    • Collation of data
                    • Estimation of key figures
                    • Analysis of derived insights

                    Data Validation

                    • Triangulation with data models
                    • Reference against proprietary databases
                    • Corroboration with industry experts

                    REPORT WRITING

                    Qualitative

                    • Market drivers
                    • Market challenges
                    • Market trends
                    • Five forces analysis

                    Quantitative

                    • Market size and forecast
                    • Market segmentation
                    • Geographical insights
                    • Competitive landscape

                    Interested in this report?

                    Get your sample now to see our research methodology and insights!

                    Download Now

                    Frequently Asked Questions

                    Truck Platooning System market growth will increase by $ 2246.1 mn during 2024-2028.

                    The Truck Platooning System market is expected to grow at a CAGR of 77.99% during 2024-2028.

                    Truck Platooning System market is segmented by Component( Hardware, Software, Services) Vehicle Type( HCV, LCV)

                    AB Volvo, Aptiv Plc, Continental AG, Daimler Truck AG, Iveco SpA, PACCAR Inc., Peloton Technology Inc., Robert Bosch GmbH, Toyota Tsusho Corp., Traton SE, ZF Friedrichshafen AG are a few of the key vendors in the Truck Platooning System market.

                    North America will register the highest growth rate of 40% among the other regions. Therefore, the Truck Platooning System market in North America is expected to garner significant business opportunities for the vendors during the forecast period.

                    US, Germany, China, UK, Canada

                    • Increase in demand to reduce operating cost and fuel consumption by fleetThe truck platooning system is witnessing increased demand for reducing operating costs and fuel computations by the fleet. This is due to the growing need to optimize fuel consumption and operating efficiency. The system enables trucks to travel closely together in a formation is the driving factor this market.
                    • reducing air resistance and aerodynamic drag is the driving factor this market.
                    • resulting in lower fuel consumption and lower emissions. Fleet operators face immense pressure to reduce operational costs is the driving factor this market.
                    • and truck platooning systems provide an effective solution. These systems increase efficiency is the driving factor this market.
                    • allowing fleets to transport more goods and deliver them faster. By automating the driving process is the driving factor this market.
                    • truck platooning systems also reduce the likelihood of human error is the driving factor this market.
                    • leading to safer and more reliable operations. Additionally is the driving factor this market.
                    • truck platooning systems can improve overall road safety by reducing the number of accidents that occur on highways. By maintaining a close distance between the vehicles in the platoon is the driving factor this market.
                    • the system can respond more quickly to road hazards is the driving factor this market.
                    • and safer braking distances can be maintained. Thus is the driving factor this market.
                    • such factors are expected to drive the growth of the market in focus during the forecast period. is the driving factor this market.

                    The Truck Platooning System market vendors should focus on grabbing business opportunities from the Hardware segment as it accounted for the largest market share in the base year.