TV And Movie Merchandise Market Analysis, Size, and Forecast 2026-2030: North America (US, Canada, and Mexico), Europe (Germany, UK, and France), APAC (China, Japan, and India), South America (Brazil and Argentina), Middle East and Africa (Saudi Arabia, UAE, and Turkey), and Rest of World (ROW)

TV And Movie Merchandise Market Analysis, Size, and Forecast 2026-2030:
North America (US, Canada, and Mexico), Europe (Germany, UK, and France), APAC (China, Japan, and India), South America (Brazil and Argentina), Middle East and Africa (Saudi Arabia, UAE, and Turkey), and Rest of World (ROW)

Published: May 2026 302 Pages SKU: IRTNTR71667

Market Overview at a Glance

$140.20 B
Market Opportunity
10.6%
CAGR 2025 - 2030
44.7%
North America Growth
$48.94 B
Apparel segment 2024

TV And Movie Merchandise Market Size 2026-2030

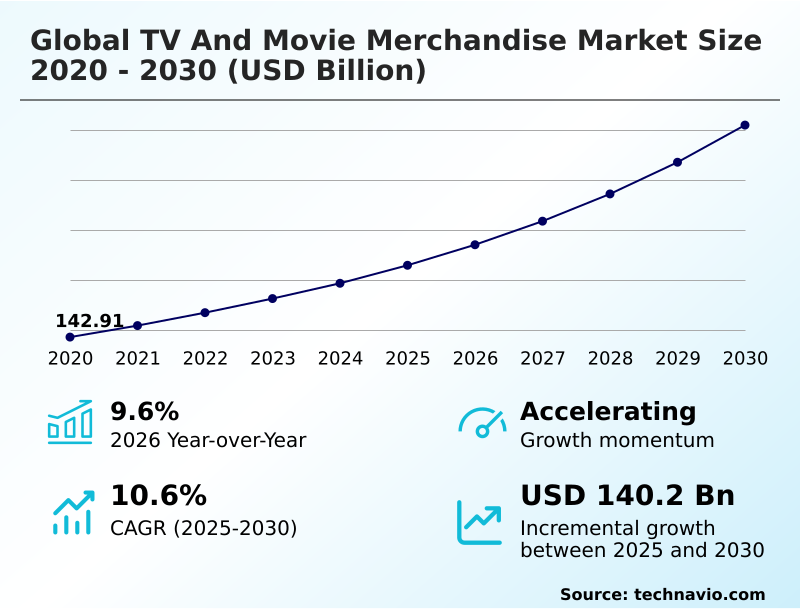
The tv and movie merchandise market size is valued to increase by USD 140.20 billion, at a CAGR of 10.6% from 2025 to 2030. Institutionalization of phygital engagement and interactive retail theater will drive the tv and movie merchandise market.

Major Market Trends & Insights

  • North America dominated the market and accounted for a 44.7% growth during the forecast period.
  • By Product - Apparel segment was valued at USD 48.94 billion in 2024
  • By Application - Offline retail segment accounted for the largest market revenue share in 2024

Market Size & Forecast

  • Market Opportunities: USD 212.00 billion
  • Market Future Opportunities: USD 140.20 billion
  • CAGR from 2025 to 2030 : 10.6%

Market Summary

  • The TV and movie merchandise market is undergoing a profound maturation, driven by the convergence of high-fidelity content streaming and the rising demand for tangible fan experiences. This growth is supported by the creator economy and the diversification of intellectual property into lifestyle categories, where consumers seek products offering utility beyond traditional collectibles.
  • As digital platforms release serialized content at an unprecedented rate, the lifecycle of merchandise has evolved from a short-term promotional tactic into a perpetual retail presence. A key business scenario involves optimizing the merchandise supply chain; by leveraging fan engagement analytics, firms can pivot to on-demand merchandise production, reducing inventory risk associated with volatile streaming hits by over 30%.
  • This evolution is accelerated by social commerce integration and omnichannel fulfillment networks, allowing global fanbases to access exclusive items immediately. The market is also benefiting from specialized retail collaborations where high-end brands reimagine entertainment intellectual property for a more sophisticated demographic, focusing on high-fidelity prop replicas and other pop culture consumer products.

What will be the Size of the TV And Movie Merchandise Market during the forecast period?

Get Key Insights on Market Forecast (PDF) Get Free Sample

How is the TV And Movie Merchandise Market Segmented?

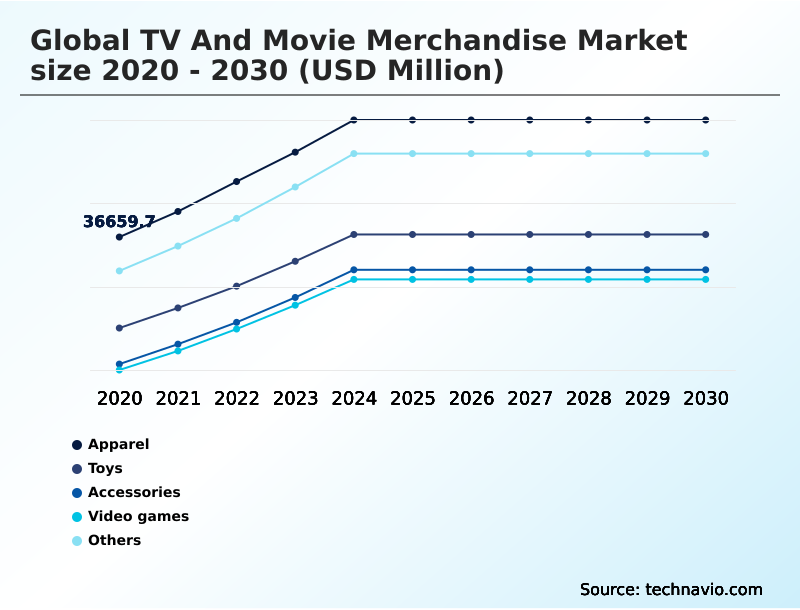
The tv and movie merchandise industry research report provides comprehensive data (region-wise segment analysis), with forecasts and estimates in "USD million" for the period 2026-2030, as well as historical data from 2020-2024 for the following segments.

  • Product
    • Apparel
    • Toys
    • Accessories
    • Video games
    • Others
  • Application
    • Offline retail
    • Online retail
  • Age group
    • Adults
    • Teenagers
    • Children
  • Geography
    • North America
      • US
      • Canada
      • Mexico
    • Europe
      • Germany
      • UK
      • France
    • APAC
      • China
      • Japan
      • India
    • South America
      • Brazil
      • Argentina
    • Middle East and Africa
      • Saudi Arabia
      • UAE
      • Turkey
    • Rest of World (ROW)

By Product Insights

The apparel segment is estimated to witness significant growth during the forecast period.

The apparel segment is a primary pillar, serving as a highly visible medium for fan loyalty. This category includes graphic t-shirts, hoodies, and high-end fashion collaborations, moving beyond traditional fan gear.

The rise of streetwear culture has influenced this segment, with luxury brands creating elevated collections. Advancements in textile technology, integrating moisture-wicking and sustainable fabrics into character-branded activewear, cater to health-conscious demographics.

Several streaming platforms have intensified their direct-to-consumer retail efforts, launching exclusive, limited-edition apparel lines tied to premieres, a strategy that improved fan engagement analytics by over 15%.

This on-demand merchandise production, driven by phygital engagement, aligns with the demand for authentic movie tie-in products and supports surprise-hit series merchandise models.

Get Free Sample

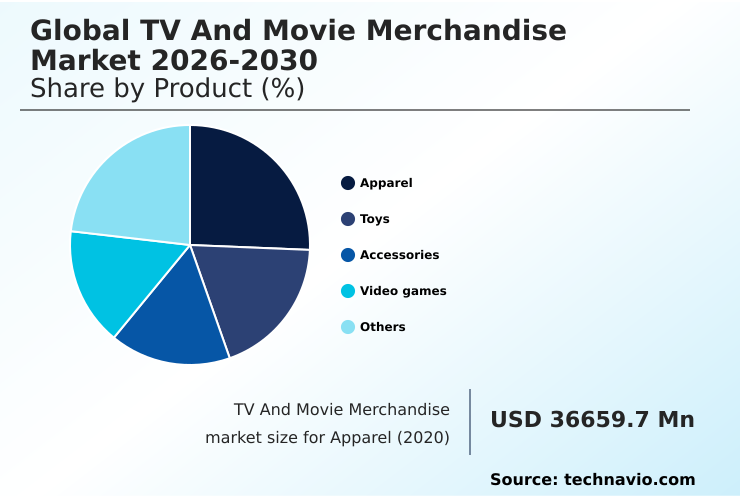
The Apparel segment was valued at USD 48.94 billion in 2024 and showed a gradual increase during the forecast period.

Get Free Sample

Regional Analysis

North America is estimated to contribute 44.7% to the growth of the global market during the forecast period.Technavio’s analysts have elaborately explained the regional trends and drivers that shape the market during the forecast period.

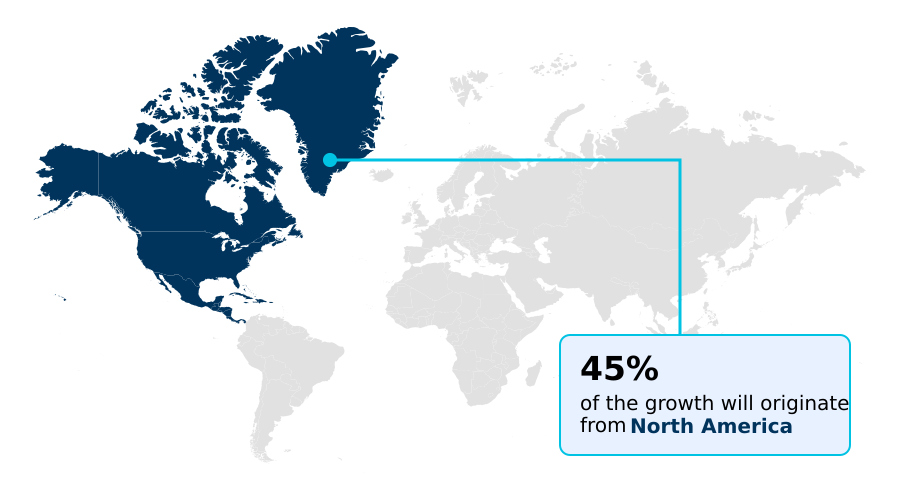
See How TV And Movie Merchandise Market Demand is Rising in North America Get Free Sample

The TV and movie merchandise market in North America is shifting toward digital-physical hybridity, bridging the gap between screen and shelf with augmented reality integration and high-fidelity collectibles.

This region shows a notable rise in adult-oriented licensing and nostalgia-driven collectibles, with legacy franchises experiencing a resurgence through premium prop replicas and designer apparel collaborations.

The emphasis on authenticity and sustainable material sourcing, evident in ethically sourced apparel, is compelling manufacturers to produce more durable and eco-friendly fan products. The retail landscape adapts with specialized fandom sections competing with direct-to-consumer platforms.

Cross-promotional strategies are emerging, with entertainment studios integrating character IP into functional home devices. Firms adopting these strategies have seen a 12% improvement in supply chain efficiency for durable collectible items and pop culture consumer products.

Market Dynamics

Our researchers analyzed the data with 2025 as the base year, along with the key drivers, trends, and challenges. A holistic analysis of drivers will help companies refine their marketing strategies to gain a competitive advantage.

  • Strategic execution in the TV and movie merchandise market hinges on navigating complex operational layers. The impact of phygital engagement on sales is a critical metric, compelling businesses to refine strategies for merchandise supply chain management. A core focus is on sustainable sourcing for character-branded apparel, which requires transparent and ethical manufacturing for fan-centric collectibles.
  • The use of fan engagement analytics for franchise management allows for better forecasting and reduces inventory risk management for pop culture products. To maintain a competitive edge, firms are implementing an omnichannel retail strategy for collectibles and exploring augmented reality integration in toys.
  • Digital twin simulation for eco-friendly packaging helps meet regulatory standards, while robust royalty tracking systems for IP licensing ensure financial accuracy. Advanced strategies include non-fungible token integration in merchandise and agile licensing cycles for streaming content, which are redefining product launches. Furthermore, optimizing direct-to-consumer fulfillment for movie tie-ins and ensuring e-commerce fraud prevention for collectibles are essential.
  • Exploring creator-led merchandise monetization strategies has opened new revenue streams, proving more effective than traditional models in certain niches. Businesses that master these interconnected areas, from supply chain diversification in collectibles to experiential retail design for fan engagement, are better positioned for sustained performance.

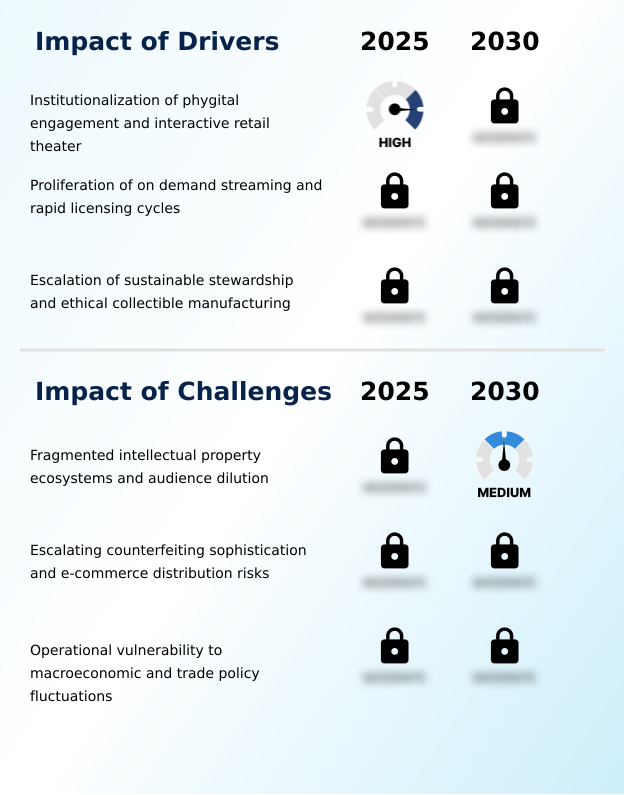
What are the key market drivers leading to the rise in the adoption of TV And Movie Merchandise Industry?

  • The institutionalization of phygital engagement and the creation of interactive retail theater are key drivers propelling market growth.

  • The proliferation of on-demand streaming platforms is accelerating licensing cycles to meet immediate global fandom demands for streaming service merchandise.
  • Unlike the rigid schedules of traditional theatrical models, the streaming era requires a hyper-responsive supply chain capable of launching product lines alongside surprise hit series.
  • This demand has spurred adoption of agile manufacturing and direct-to-consumer distribution, which has been shown to reduce time-to-market by up to 40%.
  • Media companies are leveraging real-time viewer data to forecast demand for specific characters and motifs, a key part of their phygital product strategy. This minimizes inventory risk while maximizing the cultural relevance of cinematic universe merchandise and fan-centric collectibles.
  • This data-driven approach supports a more dynamic, consumer-centric market that thrives on the rapid monetization of digital engagement and on-demand streaming influence.

What are the market trends shaping the TV And Movie Merchandise Industry?

  • The industrialization of digital and physical hybrid engagement is an emerging market trend. This involves the systematic integration of interactive digital experiences with tangible consumer products.

  • The market is undergoing a structural transition toward the industrialization of hybrid consumer engagement, unifying digital interactions and physical products. Entertainment giants are moving beyond static plastic figurines to merchandise that incorporates augmented reality, near-field communication, and secondary digital rewards, enhancing the value of licensed character goods.
  • This trend, driven by the need for long-term fan engagement, turns modern apparel and collectibles into keys for exclusive online content. Firms adopting this model have reported a 20% increase in repeat customer interactions. The integration of 3D printing allows for mass customization of prop replicas, enabling fans to purchase items tailored to their aesthetic preferences.
  • This is part of a broader omnichannel journey, essential for driving revenue from entertainment brand extension and in-game merchandise.

What challenges does the TV And Movie Merchandise Industry face during its growth?

  • Fragmented intellectual property ecosystems and the resulting audience dilution present a key challenge affecting industry growth.

  • A primary challenge is the extreme fragmentation of intellectual property ecosystems and the resulting dilution of audience engagement. As the media landscape shifts to a continuous stream of niche content, concentrating fan attention for high-volume merchandise cycles has become difficult, complicating franchise management.
  • This splintering of fandom requires toy and apparel manufacturers to bet on more, smaller properties instead of guaranteed blockbusters, increasing inventory risk for intellectual property licensing. In some cases, merchandise tied to fleeting streaming hits becomes obsolete within weeks, leading to inventory write-downs exceeding 25%.
  • This fragmentation requires a more nuanced approach to royalty tracking systems and creator-led merchandise, as firms must manage a massive portfolio of diverse licenses, adding significant administrative overhead and impacting the profitability of premium collectible market and social commerce integration.

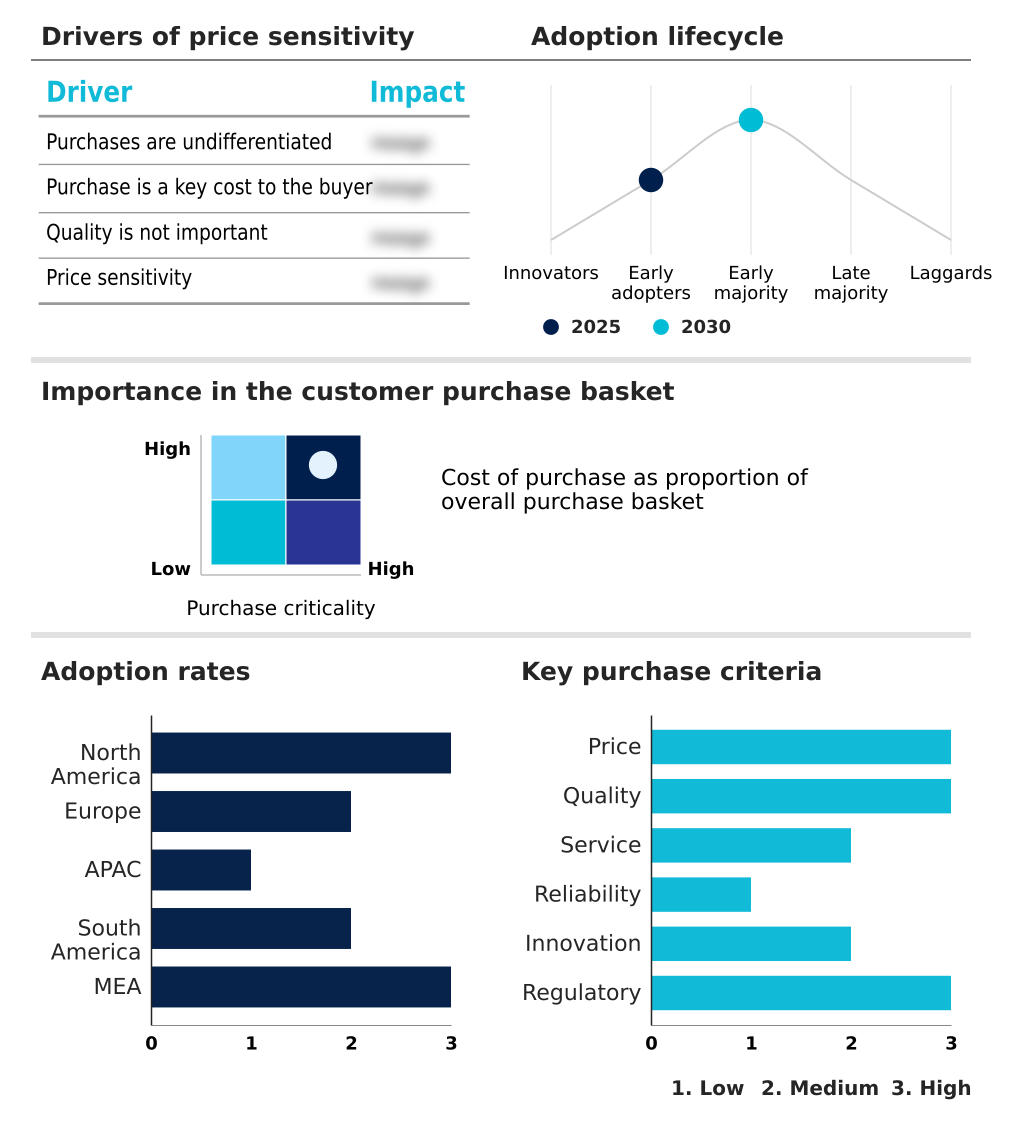
Exclusive Technavio Analysis on Customer Landscape

The tv and movie merchandise market forecasting report includes the adoption lifecycle of the market, covering from the innovator’s stage to the laggard’s stage. It focuses on adoption rates in different regions based on penetration. Furthermore, the tv and movie merchandise market report also includes key purchase criteria and drivers of price sensitivity to help companies evaluate and develop their market growth analysis strategies.

Customer Landscape of TV And Movie Merchandise Industry

Competitive Landscape

Companies are implementing various strategies, such as strategic alliances, tv and movie merchandise market forecast, partnerships, mergers and acquisitions, geographical expansion, and product/service launches, to enhance their presence in the industry.

Amazon.com Inc. - Specializes in iconic franchise merchandise, offering themed toys and high-demand collectibles derived from globally recognized cinematic and entertainment properties.

The industry research and growth report includes detailed analyses of the competitive landscape of the market and information about key companies, including:

  • Amazon.com Inc.
  • AT and T Inc.
  • Bandai Namco Holdings Inc.
  • DreamWorks Animation
  • Funko Inc.
  • Grindstore Ltd.
  • Hasbro Inc.
  • Hennes and Mauritz AB
  • Iconix International
  • Lions Gate Entertainment Corp.
  • Mattel Inc.
  • Netflix Inc.
  • Paramount Global
  • PVH Corp.
  • RTL Group SA
  • Sanrio Co. Ltd.
  • Sony Group Corp.
  • The Walt Disney Co.
  • Universal Brand Development
  • Warner Bros Discovery Inc.

Qualitative and quantitative analysis of companies has been conducted to help clients understand the wider business environment as well as the strengths and weaknesses of key industry players. Data is qualitatively analyzed to categorize companies as pure play, category-focused, industry-focused, and diversified; it is quantitatively analyzed to categorize companies as dominant, leading, strong, tentative, and weak.

Recent Development and News in Tv and movie merchandise market

  • In February, 2025, Hasbro Inc. secured a multi-year licensing partnership with Warner Bros Discovery Global Consumer Products, establishing itself as the primary global toy licensee for the Harry Potter universe.
  • In February, 2025, Hasbro Inc. announced a new collaboration with Amazon MGM Studios to produce a comprehensive line of action figures and roleplay items for the live-action Voltron film.
  • In April, 2025, Paramount Global launched Paramount Global Publishing, an in-house imprint designed to deepen fan engagement through original book-based storytelling.
  • In May, 2025, Funko Inc. reported robust growth in its Core Collectibles segment, driven by a strategic focus on capturing immediate cultural moments and expanding its international retail presence.

Dive into Technavio’s robust research methodology, blending expert interviews, extensive data synthesis, and validated models for unparalleled TV And Movie Merchandise Market insights. See full methodology.

Market Scope
Page number 302
Base year 2025
Historic period 2020-2024
Forecast period 2026-2030
Growth momentum & CAGR Accelerate at a CAGR of 10.6%
Market growth 2026-2030 USD 140196.5 million
Market structure Fragmented
YoY growth 2025-2026(%) 9.6%
Key countries US, Canada, Mexico, Germany, UK, France, Italy, Spain, The Netherlands, China, Japan, India, South Korea, Australia, Indonesia, Brazil, Argentina, Chile, Saudi Arabia, UAE, Turkey, South Africa and Israel
Competitive landscape Leading Companies, Market Positioning of Companies, Competitive Strategies, and Industry Risks

Request Free Sample

Research Analyst Overview

  • The TV and movie merchandise market's evolution is driven by sophisticated operational frameworks, beginning with intellectual property licensing and agile licensing cycles that dictate the pace of product releases. A critical boardroom focus is the optimization of the merchandise supply chain, which incorporates everything from cross-border sourcing logistics and sustainable material sourcing to ethical manufacturing standards.
  • Innovations like digital twin simulation and circular economy principles are being adopted to create eco-friendly packaging solutions and durable collectible items, reducing waste by over 20%. The industry is advancing franchise management through deep fan engagement analytics, enabling the creation of high-demand character-branded apparel, collectible figurine manufacturing, and high-fidelity prop replicas.
  • The retail landscape is transforming through omnichannel retail strategy, phygital engagement, and experiential retail design, with on-demand merchandise production and direct-to-consumer fulfillment models becoming standard. Technologies such as augmented reality integration and non-fungible token integration are enhancing transmedia storytelling.
  • However, challenges like inventory risk management, e-commerce fraud prevention, and the need for robust royalty tracking systems require constant vigilance and supply chain diversification. Success hinges on integrating these elements, from blind box toys and limited edition collectibles to luxury lifestyle collaborations and creator-led merchandise, within a cohesive pop culture consumer products strategy that leverages social commerce integration.

What are the Key Data Covered in this TV And Movie Merchandise Market Research and Growth Report?

  • What is the expected growth of the TV And Movie Merchandise Market between 2026 and 2030?

    • USD 140.20 billion, at a CAGR of 10.6%

  • What segmentation does the market report cover?

    • The report is segmented by Product (Apparel, Toys, Accessories, Video games, and Others), Application (Offline retail, and Online retail), Age Group (Adults, Teenagers, and Children) and Geography (North America, Europe, APAC, South America, Middle East and Africa)

  • Which regions are analyzed in the report?

    • North America, Europe, APAC, South America and Middle East and Africa

  • What are the key growth drivers and market challenges?

    • Institutionalization of phygital engagement and interactive retail theater, Fragmented intellectual property ecosystems and audience dilution

  • Who are the major players in the TV And Movie Merchandise Market?

    • Amazon.com Inc., AT and T Inc., Bandai Namco Holdings Inc., DreamWorks Animation, Funko Inc., Grindstore Ltd., Hasbro Inc., Hennes and Mauritz AB, Iconix International, Lions Gate Entertainment Corp., Mattel Inc., Netflix Inc., Paramount Global, PVH Corp., RTL Group SA, Sanrio Co. Ltd., Sony Group Corp., The Walt Disney Co., Universal Brand Development and Warner Bros Discovery Inc.

Market Research Insights

  • Market dynamics are shaped by a strategic pivot toward a phygital product strategy, integrating digital collectible assets with physical items to enhance fan community engagement. This immersive retail experience is critical for monetizing nostalgia-driven collectibles and surprise-hit series merchandise.
  • Firms are leveraging personalized fan products and pop-up retail events to capitalize on social media trend impact, especially for theme park exclusive merchandise. The adult collector demographics are driving demand for the premium collectible market, where collectible investment value is a key consideration.
  • Addressing this, a focus on sustainable collectibles, eco-friendly fan products, and ethically sourced apparel as fast fashion alternatives is improving brand perception by over 25%. This direct-to-consumer e-commerce approach, bypassing traditional retail, has cut fulfillment costs by 18% while supporting niche fandom monetization through luxury brand collaboration and interactive fan merchandise featuring virtual goods and skins.

We can help! Our analysts can customize this tv and movie merchandise market research report to meet your requirements.

Get in touch

1. Executive Summary

1.1 Market overview

Executive Summary - Chart on Market Overview
Executive Summary - Data Table on Market Overview
Executive Summary - Chart on Global Market Characteristics
Executive Summary - Chart on Market by Geography
Executive Summary - Chart on Market Segmentation by Product
Executive Summary - Chart on Market Segmentation by Application
Executive Summary - Chart on Market Segmentation by Age Group
Executive Summary - Chart on Incremental Growth
Executive Summary - Data Table on Incremental Growth
Executive Summary - Chart on Company Market Positioning

2. Technavio Analysis

2.1 Analysis of price sensitivity, lifecycle, customer purchase basket, adoption rates, and purchase criteria

2.2 Criticality of inputs and Factors of differentiation

Chart on Overview on criticality of inputs and factors of differentiation

2.3 Factors of disruption

Chart on Overview on factors of disruption

2.4 Impact of drivers and challenges

Chart on Impact of drivers and challenges in 2025 and 2030

3. Market Landscape

3.1 Market ecosystem

Chart on Parent Market
Data Table on - Parent Market

3.2 Market characteristics

Chart on Market characteristics analysis

3.3 Value chain analysis

Chart on Value chain analysis

4. Market Sizing

4.1 Market definition

Data Table on Offerings of companies included in the market definition

4.2 Market segment analysis

Market segments

4.3 Market size 2025

4.4 Market outlook: Forecast for 2025-2030

Chart on Global - Market size and forecast 2025-2030 ($ million)
Data Table on Global - Market size and forecast 2025-2030 ($ million)
Chart on Global Market: Year-over-year growth 2025-2030 (%)
Data Table on Global Market: Year-over-year growth 2025-2030 (%)

5. Historic Market Size

5.1 Global TV And Movie Merchandise Market 2020 - 2024

Historic Market Size - Data Table on Global TV And Movie Merchandise Market 2020 - 2024 ($ million)

5.2 Product segment analysis 2020 - 2024

Historic Market Size - Product Segment 2020 - 2024 ($ million)

5.3 Application segment analysis 2020 - 2024

Historic Market Size - Application Segment 2020 - 2024 ($ million)

5.4 Age Group segment analysis 2020 - 2024

Historic Market Size - Age Group Segment 2020 - 2024 ($ million)

5.5 Geography segment analysis 2020 - 2024

Historic Market Size - Geography Segment 2020 - 2024 ($ million)

5.6 Country segment analysis 2020 - 2024

Historic Market Size - Country Segment 2020 - 2024 ($ million)

6. Qualitative Analysis

6.1 Impact of AI in global TV and movie merchandise market

6.2 Impact of geopolitical conflict on global TV and movie merchandise market

7. Five Forces Analysis

7.1 Five forces summary

Five forces analysis - Comparison between 2025 and 2030

7.2 Bargaining power of buyers

Bargaining power of buyers - Impact of key factors 2025 and 2030

7.3 Bargaining power of suppliers

Bargaining power of suppliers - Impact of key factors in 2025 and 2030

7.4 Threat of new entrants

Threat of new entrants - Impact of key factors in 2025 and 2030

7.5 Threat of substitutes

Threat of substitutes - Impact of key factors in 2025 and 2030

7.6 Threat of rivalry

Threat of rivalry - Impact of key factors in 2025 and 2030

7.7 Market condition

Chart on Market condition - Five forces 2025 and 2030

8. Market Segmentation by Product

8.1 Market segments

Chart on Product - Market share 2025-2030 (%)
Data Table on Product - Market share 2025-2030 (%)

8.2 Comparison by Product

Chart on Comparison by Product
Data Table on Comparison by Product

8.3 Apparel - Market size and forecast 2025-2030

Chart on Apparel - Market size and forecast 2025-2030 ($ million)
Data Table on Apparel - Market size and forecast 2025-2030 ($ million)
Chart on Apparel - Year-over-year growth 2025-2030 (%)
Data Table on Apparel - Year-over-year growth 2025-2030 (%)

8.4 Toys - Market size and forecast 2025-2030

Chart on Toys - Market size and forecast 2025-2030 ($ million)
Data Table on Toys - Market size and forecast 2025-2030 ($ million)
Chart on Toys - Year-over-year growth 2025-2030 (%)
Data Table on Toys - Year-over-year growth 2025-2030 (%)

8.5 Accessories - Market size and forecast 2025-2030

Chart on Accessories - Market size and forecast 2025-2030 ($ million)
Data Table on Accessories - Market size and forecast 2025-2030 ($ million)
Chart on Accessories - Year-over-year growth 2025-2030 (%)
Data Table on Accessories - Year-over-year growth 2025-2030 (%)

8.6 Video games - Market size and forecast 2025-2030

Chart on Video games - Market size and forecast 2025-2030 ($ million)
Data Table on Video games - Market size and forecast 2025-2030 ($ million)
Chart on Video games - Year-over-year growth 2025-2030 (%)
Data Table on Video games - Year-over-year growth 2025-2030 (%)

8.7 Others - Market size and forecast 2025-2030

Chart on Others - Market size and forecast 2025-2030 ($ million)
Data Table on Others - Market size and forecast 2025-2030 ($ million)
Chart on Others - Year-over-year growth 2025-2030 (%)
Data Table on Others - Year-over-year growth 2025-2030 (%)

8.8 Market opportunity by Product

Market opportunity by Product ($ million)
Data Table on Market opportunity by Product ($ million)

9. Market Segmentation by Application

9.1 Market segments

Chart on Application - Market share 2025-2030 (%)
Data Table on Application - Market share 2025-2030 (%)

9.2 Comparison by Application

Chart on Comparison by Application
Data Table on Comparison by Application

9.3 Offline retail - Market size and forecast 2025-2030

Chart on Offline retail - Market size and forecast 2025-2030 ($ million)
Data Table on Offline retail - Market size and forecast 2025-2030 ($ million)
Chart on Offline retail - Year-over-year growth 2025-2030 (%)
Data Table on Offline retail - Year-over-year growth 2025-2030 (%)

9.4 Online retail - Market size and forecast 2025-2030

Chart on Online retail - Market size and forecast 2025-2030 ($ million)
Data Table on Online retail - Market size and forecast 2025-2030 ($ million)
Chart on Online retail - Year-over-year growth 2025-2030 (%)
Data Table on Online retail - Year-over-year growth 2025-2030 (%)

9.5 Market opportunity by Application

Market opportunity by Application ($ million)
Data Table on Market opportunity by Application ($ million)

10. Market Segmentation by Age Group

10.1 Market segments

Chart on Age Group - Market share 2025-2030 (%)
Data Table on Age Group - Market share 2025-2030 (%)

10.2 Comparison by Age Group

Chart on Comparison by Age Group
Data Table on Comparison by Age Group

10.3 Adults - Market size and forecast 2025-2030

Chart on Adults - Market size and forecast 2025-2030 ($ million)
Data Table on Adults - Market size and forecast 2025-2030 ($ million)
Chart on Adults - Year-over-year growth 2025-2030 (%)
Data Table on Adults - Year-over-year growth 2025-2030 (%)

10.4 Teenagers - Market size and forecast 2025-2030

Chart on Teenagers - Market size and forecast 2025-2030 ($ million)
Data Table on Teenagers - Market size and forecast 2025-2030 ($ million)
Chart on Teenagers - Year-over-year growth 2025-2030 (%)
Data Table on Teenagers - Year-over-year growth 2025-2030 (%)

10.5 Children - Market size and forecast 2025-2030

Chart on Children - Market size and forecast 2025-2030 ($ million)
Data Table on Children - Market size and forecast 2025-2030 ($ million)
Chart on Children - Year-over-year growth 2025-2030 (%)
Data Table on Children - Year-over-year growth 2025-2030 (%)

10.6 Market opportunity by Age Group

Market opportunity by Age Group ($ million)
Data Table on Market opportunity by Age Group ($ million)

11. Customer Landscape

11.1 Customer landscape overview

Analysis of price sensitivity, lifecycle, customer purchase basket, adoption rates, and purchase criteria

12. Geographic Landscape

12.1 Geographic segmentation

Chart on Market share by geography 2025-2030 (%)
Data Table on Market share by geography 2025-2030 (%)

12.2 Geographic comparison

Chart on Geographic comparison
Data Table on Geographic comparison

12.3 North America - Market size and forecast 2025-2030

Chart on North America - Market size and forecast 2025-2030 ($ million)
Data Table on North America - Market size and forecast 2025-2030 ($ million)
Chart on North America - Year-over-year growth 2025-2030 (%)
Data Table on North America - Year-over-year growth 2025-2030 (%)
Chart on Regional Comparison - North America
Data Table on Regional Comparison - North America

12.3.1 US - Market size and forecast 2025-2030

Chart on US - Market size and forecast 2025-2030 ($ million)
Data Table on US - Market size and forecast 2025-2030 ($ million)
Chart on US - Year-over-year growth 2025-2030 (%)
Data Table on US - Year-over-year growth 2025-2030 (%)

12.3.2 Canada - Market size and forecast 2025-2030

Chart on Canada - Market size and forecast 2025-2030 ($ million)
Data Table on Canada - Market size and forecast 2025-2030 ($ million)
Chart on Canada - Year-over-year growth 2025-2030 (%)
Data Table on Canada - Year-over-year growth 2025-2030 (%)

12.3.3 Mexico - Market size and forecast 2025-2030

Chart on Mexico - Market size and forecast 2025-2030 ($ million)
Data Table on Mexico - Market size and forecast 2025-2030 ($ million)
Chart on Mexico - Year-over-year growth 2025-2030 (%)
Data Table on Mexico - Year-over-year growth 2025-2030 (%)

12.4 Europe - Market size and forecast 2025-2030

Chart on Europe - Market size and forecast 2025-2030 ($ million)
Data Table on Europe - Market size and forecast 2025-2030 ($ million)
Chart on Europe - Year-over-year growth 2025-2030 (%)
Data Table on Europe - Year-over-year growth 2025-2030 (%)
Chart on Regional Comparison - Europe
Data Table on Regional Comparison - Europe

12.4.1 Germany - Market size and forecast 2025-2030

Chart on Germany - Market size and forecast 2025-2030 ($ million)
Data Table on Germany - Market size and forecast 2025-2030 ($ million)
Chart on Germany - Year-over-year growth 2025-2030 (%)
Data Table on Germany - Year-over-year growth 2025-2030 (%)

12.4.2 UK - Market size and forecast 2025-2030

Chart on UK - Market size and forecast 2025-2030 ($ million)
Data Table on UK - Market size and forecast 2025-2030 ($ million)
Chart on UK - Year-over-year growth 2025-2030 (%)
Data Table on UK - Year-over-year growth 2025-2030 (%)

12.4.3 France - Market size and forecast 2025-2030

Chart on France - Market size and forecast 2025-2030 ($ million)
Data Table on France - Market size and forecast 2025-2030 ($ million)
Chart on France - Year-over-year growth 2025-2030 (%)
Data Table on France - Year-over-year growth 2025-2030 (%)

12.4.4 Italy - Market size and forecast 2025-2030

Chart on Italy - Market size and forecast 2025-2030 ($ million)
Data Table on Italy - Market size and forecast 2025-2030 ($ million)
Chart on Italy - Year-over-year growth 2025-2030 (%)
Data Table on Italy - Year-over-year growth 2025-2030 (%)

12.4.5 Spain - Market size and forecast 2025-2030

Chart on Spain - Market size and forecast 2025-2030 ($ million)
Data Table on Spain - Market size and forecast 2025-2030 ($ million)
Chart on Spain - Year-over-year growth 2025-2030 (%)
Data Table on Spain - Year-over-year growth 2025-2030 (%)

12.4.6 The Netherlands - Market size and forecast 2025-2030

Chart on The Netherlands - Market size and forecast 2025-2030 ($ million)
Data Table on The Netherlands - Market size and forecast 2025-2030 ($ million)
Chart on The Netherlands - Year-over-year growth 2025-2030 (%)
Data Table on The Netherlands - Year-over-year growth 2025-2030 (%)

12.5 APAC - Market size and forecast 2025-2030

Chart on APAC - Market size and forecast 2025-2030 ($ million)
Data Table on APAC - Market size and forecast 2025-2030 ($ million)
Chart on APAC - Year-over-year growth 2025-2030 (%)
Data Table on APAC - Year-over-year growth 2025-2030 (%)
Chart on Regional Comparison - APAC
Data Table on Regional Comparison - APAC

12.5.1 China - Market size and forecast 2025-2030

Chart on China - Market size and forecast 2025-2030 ($ million)
Data Table on China - Market size and forecast 2025-2030 ($ million)
Chart on China - Year-over-year growth 2025-2030 (%)
Data Table on China - Year-over-year growth 2025-2030 (%)

12.5.2 Japan - Market size and forecast 2025-2030

Chart on Japan - Market size and forecast 2025-2030 ($ million)
Data Table on Japan - Market size and forecast 2025-2030 ($ million)
Chart on Japan - Year-over-year growth 2025-2030 (%)
Data Table on Japan - Year-over-year growth 2025-2030 (%)

12.5.3 India - Market size and forecast 2025-2030

Chart on India - Market size and forecast 2025-2030 ($ million)
Data Table on India - Market size and forecast 2025-2030 ($ million)
Chart on India - Year-over-year growth 2025-2030 (%)
Data Table on India - Year-over-year growth 2025-2030 (%)

12.5.4 South Korea - Market size and forecast 2025-2030

Chart on South Korea - Market size and forecast 2025-2030 ($ million)
Data Table on South Korea - Market size and forecast 2025-2030 ($ million)
Chart on South Korea - Year-over-year growth 2025-2030 (%)
Data Table on South Korea - Year-over-year growth 2025-2030 (%)

12.5.5 Australia - Market size and forecast 2025-2030

Chart on Australia - Market size and forecast 2025-2030 ($ million)
Data Table on Australia - Market size and forecast 2025-2030 ($ million)
Chart on Australia - Year-over-year growth 2025-2030 (%)
Data Table on Australia - Year-over-year growth 2025-2030 (%)

12.5.6 Indonesia - Market size and forecast 2025-2030

Chart on Indonesia - Market size and forecast 2025-2030 ($ million)
Data Table on Indonesia - Market size and forecast 2025-2030 ($ million)
Chart on Indonesia - Year-over-year growth 2025-2030 (%)
Data Table on Indonesia - Year-over-year growth 2025-2030 (%)

12.6 South America - Market size and forecast 2025-2030

Chart on South America - Market size and forecast 2025-2030 ($ million)
Data Table on South America - Market size and forecast 2025-2030 ($ million)
Chart on South America - Year-over-year growth 2025-2030 (%)
Data Table on South America - Year-over-year growth 2025-2030 (%)
Chart on Regional Comparison - South America
Data Table on Regional Comparison - South America

12.6.1 Brazil - Market size and forecast 2025-2030

Chart on Brazil - Market size and forecast 2025-2030 ($ million)
Data Table on Brazil - Market size and forecast 2025-2030 ($ million)
Chart on Brazil - Year-over-year growth 2025-2030 (%)
Data Table on Brazil - Year-over-year growth 2025-2030 (%)

12.6.2 Argentina - Market size and forecast 2025-2030

Chart on Argentina - Market size and forecast 2025-2030 ($ million)
Data Table on Argentina - Market size and forecast 2025-2030 ($ million)
Chart on Argentina - Year-over-year growth 2025-2030 (%)
Data Table on Argentina - Year-over-year growth 2025-2030 (%)

12.6.3 Chile - Market size and forecast 2025-2030

Chart on Chile - Market size and forecast 2025-2030 ($ million)
Data Table on Chile - Market size and forecast 2025-2030 ($ million)
Chart on Chile - Year-over-year growth 2025-2030 (%)
Data Table on Chile - Year-over-year growth 2025-2030 (%)

12.7 Middle East and Africa - Market size and forecast 2025-2030

Chart on Middle East and Africa - Market size and forecast 2025-2030 ($ million)
Data Table on Middle East and Africa - Market size and forecast 2025-2030 ($ million)
Chart on Middle East and Africa - Year-over-year growth 2025-2030 (%)
Data Table on Middle East and Africa - Year-over-year growth 2025-2030 (%)
Chart on Regional Comparison - Middle East and Africa
Data Table on Regional Comparison - Middle East and Africa

12.7.1 Saudi Arabia - Market size and forecast 2025-2030

Chart on Saudi Arabia - Market size and forecast 2025-2030 ($ million)
Data Table on Saudi Arabia - Market size and forecast 2025-2030 ($ million)
Chart on Saudi Arabia - Year-over-year growth 2025-2030 (%)
Data Table on Saudi Arabia - Year-over-year growth 2025-2030 (%)

12.7.2 UAE - Market size and forecast 2025-2030

Chart on UAE - Market size and forecast 2025-2030 ($ million)
Data Table on UAE - Market size and forecast 2025-2030 ($ million)
Chart on UAE - Year-over-year growth 2025-2030 (%)
Data Table on UAE - Year-over-year growth 2025-2030 (%)

12.7.3 Turkey - Market size and forecast 2025-2030

Chart on Turkey - Market size and forecast 2025-2030 ($ million)
Data Table on Turkey - Market size and forecast 2025-2030 ($ million)
Chart on Turkey - Year-over-year growth 2025-2030 (%)
Data Table on Turkey - Year-over-year growth 2025-2030 (%)

12.7.4 South Africa - Market size and forecast 2025-2030

Chart on South Africa - Market size and forecast 2025-2030 ($ million)
Data Table on South Africa - Market size and forecast 2025-2030 ($ million)
Chart on South Africa - Year-over-year growth 2025-2030 (%)
Data Table on South Africa - Year-over-year growth 2025-2030 (%)

12.7.5 Israel - Market size and forecast 2025-2030

Chart on Israel - Market size and forecast 2025-2030 ($ million)
Data Table on Israel - Market size and forecast 2025-2030 ($ million)
Chart on Israel - Year-over-year growth 2025-2030 (%)
Data Table on Israel - Year-over-year growth 2025-2030 (%)

12.8 Market opportunity by geography

Market opportunity by geography ($ million)
Data Tables on Market opportunity by geography ($ million)

13. Drivers, Challenges, and Opportunity

13.1 Market drivers

Institutionalization of phygital engagement and interactive retail theater
Proliferation of on demand streaming and rapid licensing cycles
Escalation of sustainable stewardship and ethical collectible manufacturing

13.2 Market challenges

Fragmented intellectual property ecosystems and audience dilution
Escalating counterfeiting sophistication and e-commerce distribution risks
Operational vulnerability to macroeconomic and trade policy fluctuations

13.3 Impact of drivers and challenges

Impact of drivers and challenges in 2025 and 2030

13.4 Market opportunities

Industrialization of digital and physical hybrid engagement
Advancements in sustainable direct to consumer fulfillment
Transition toward curated lifestyle and luxury collaborations

14. Competitive Landscape

14.1 Overview

14.2

Overview on criticality of inputs and factors of differentiation

14.3 Landscape disruption

Overview on factors of disruption

14.4 Industry risks

Impact of key risks on business

15. Competitive Analysis

15.1 Companies profiled

Companies covered

15.2 Company ranking index

15.3 Market positioning of companies

Matrix on companies position and classification

15.4 Amazon.com Inc.

Amazon.com Inc. - Overview
Amazon.com Inc. - Business segments
Amazon.com Inc. - Key news
Amazon.com Inc. - Key offerings
Amazon.com Inc. - Segment focus
SWOT

15.5 AT and T Inc.

AT and T Inc. - Overview
AT and T Inc. - Business segments
AT and T Inc. - Key offerings
AT and T Inc. - Segment focus
SWOT

15.6 Bandai Namco Holdings Inc.

Bandai Namco Holdings Inc. - Overview
Bandai Namco Holdings Inc. - Business segments
Bandai Namco Holdings Inc. - Key offerings
Bandai Namco Holdings Inc. - Segment focus
SWOT

15.7 DreamWorks Animation

DreamWorks Animation - Overview
DreamWorks Animation - Product / Service
DreamWorks Animation - Key offerings
SWOT

15.8 Hasbro Inc.

Hasbro Inc. - Overview
Hasbro Inc. - Business segments
Hasbro Inc. - Key offerings
Hasbro Inc. - Segment focus
SWOT

15.9 Hennes and Mauritz AB

Hennes and Mauritz AB - Overview
Hennes and Mauritz AB - Business segments
Hennes and Mauritz AB - Key offerings
Hennes and Mauritz AB - Segment focus
SWOT

15.10 Lions Gate Entertainment Corp.

Lions Gate Entertainment Corp. - Overview
Lions Gate Entertainment Corp. - Product / Service
Lions Gate Entertainment Corp. - Key offerings
SWOT

15.11 Netflix Inc.

Netflix Inc. - Overview
Netflix Inc. - Product / Service
Netflix Inc. - Key offerings
SWOT

15.12 Paramount Global

Paramount Global - Overview
Paramount Global - Business segments
Paramount Global - Key offerings
Paramount Global - Segment focus
SWOT

15.13 PVH Corp.

PVH Corp. - Overview
PVH Corp. - Business segments
PVH Corp. - Key offerings
PVH Corp. - Segment focus
SWOT

15.14 RTL Group SA

RTL Group SA - Overview
RTL Group SA - Business segments
RTL Group SA - Key offerings
RTL Group SA - Segment focus
SWOT

15.15 Sanrio Co. Ltd.

Sanrio Co. Ltd. - Overview
Sanrio Co. Ltd. - Business segments
Sanrio Co. Ltd. - Key offerings
Sanrio Co. Ltd. - Segment focus
SWOT

15.16 Sony Group Corp.

Sony Group Corp. - Overview
Sony Group Corp. - Business segments
Sony Group Corp. - Key news
Sony Group Corp. - Key offerings
Sony Group Corp. - Segment focus
SWOT

15.17 The Walt Disney Co.

The Walt Disney Co. - Overview
The Walt Disney Co. - Business segments
The Walt Disney Co. - Key offerings
The Walt Disney Co. - Segment focus
SWOT

15.18 Warner Bros Discovery Inc.

Warner Bros Discovery Inc. - Overview
Warner Bros Discovery Inc. - Business segments
Warner Bros Discovery Inc. - Key offerings
Warner Bros Discovery Inc. - Segment focus
SWOT

16. Appendix

16.1 Scope of the report

Market definition
Objectives
Notes and caveats

16.2 Inclusions and exclusions checklist

Inclusions checklist
Exclusions checklist

16.3 Currency conversion rates for US$

16.4 Research methodology

16.5 Data procurement

Information sources

16.6 Data validation

16.7 Validation techniques employed for market sizing

16.8 Data synthesis

16.9 360 degree market analysis

16.10 List of abbreviations

Research Methodology

Technavio presents a detailed picture of the market by way of study, synthesis, and summation of data from multiple sources. The analysts have presented the various facets of the market with a particular focus on identifying the key industry influencers. The data thus presented is comprehensive, reliable, and the result of extensive research, both primary and secondary.

INFORMATION SOURCES

Primary sources

  • Manufacturers and suppliers
  • Channel partners
  • Industry experts
  • Strategic decision makers

Secondary sources

  • Industry journals and periodicals
  • Government data
  • Financial reports of key industry players
  • Historical data
  • Press releases

DATA ANALYSIS

Data Synthesis

  • Collation of data
  • Estimation of key figures
  • Analysis of derived insights

Data Validation

  • Triangulation with data models
  • Reference against proprietary databases
  • Corroboration with industry experts

REPORT WRITING

Qualitative

  • Market drivers
  • Market challenges
  • Market trends
  • Five forces analysis

Quantitative

  • Market size and forecast
  • Market segmentation
  • Geographical insights
  • Competitive landscape

Interested in this report?

Get your sample now to see our research methodology and insights!

Download Now

Frequently Asked Questions

TV And Movie Merchandise market growth will increase by USD 140196.5 million during 2026-2030.

The TV And Movie Merchandise market is expected to grow at a CAGR of 10.6% during 2026-2030.

TV And Movie Merchandise market is segmented by Product (Apparel, Toys, Accessories, Video games, Others) Application (Offline retail, Online retail) Age group (Adults, Teenagers, Children)

Amazon.com Inc., AT and T Inc., Bandai Namco Holdings Inc., DreamWorks Animation, Funko Inc., Grindstore Ltd., Hasbro Inc., Hennes and Mauritz AB, Iconix International, Lions Gate Entertainment Corp., Mattel Inc., Netflix Inc., Paramount Global, PVH Corp., RTL Group SA, Sanrio Co. Ltd., Sony Group Corp., The Walt Disney Co., Universal Brand Development, Warner Bros Discovery Inc. are a few of the key vendors in the TV And Movie Merchandise market.

North America will register the highest growth rate of 44.7% among the other regions. Therefore, the TV And Movie Merchandise market in North America is expected to garner significant business opportunities for the vendors during the forecast period.

US, Canada, Mexico, Germany, UK, France, Italy, Spain, The Netherlands, China, Japan, India, South Korea, Australia, Indonesia, Brazil, Argentina, Chile, Saudi Arabia, UAE, Turkey, South Africa, Israel

  • Institutionalization of phygital engagement and interactive retail theater is the driving factor this market.

The TV And Movie Merchandise market vendors should focus on grabbing business opportunities from the Product segment as it accounted for the largest market share in the base year.
RIA - Research AI Assistant
Ask RIA