Two Rotor Screw Pump Market Size 2024-2028
The two rotor screw pump market size is forecast to increase by USD 270.7 million at a CAGR of 5.9% between 2023 and 2028.
- The market is witnessing significant growth due to several key trends and challenges. One of the primary growth factors is the increasing regulations in the food and beverage industries, which necessitate the use of hygienic and efficient pumping solutions. Additionally, the integration of pumps with Industrial Internet of Things (IoT) technology is gaining traction, enabling real-time monitoring and predictive maintenance, thereby enhancing operational efficiency.
- However, the market is also facing the challenge of volatility in raw material prices, which can impact the cost structure of pump manufacturers and ultimately, the end-users. Rotor screw pumps are designed to optimize flow control and pump performance, even in the most challenging conditions. Their strong design allows them to handle a wide viscosity range, from low to high viscosity liquids, making them ideal for industrial automation in various industries. Overall, these trends and challenges are shaping the growth trajectory of the market.
What will be the Size of the Two Rotor Screw Pump Market During the Forecast Period?
- The two rotor screw pump market plays a vital role in the bulk liquid handling industry, particularly in vessel unloading and loading applications. These pumps are renowned for their ability to handle high viscosity liquids, making them indispensable in chemical processing and rail tanker transportation.
- Pressure regulation is a crucial factor in ensuring pumping efficiency during these processes.Pump selection is a critical aspect of rail tanker operations, and rotor screw pumps offer reliable pumping solutions for both high-pressure and low-pressure applications. Their design ensures minimal pump downtime, reducing the need for frequent pump replacement. In the realm of industrial pumps, rotor screw pumps excel in pumping systems for tanker truck unloading and loading, as well as pipeline maintenance.
-
Moreover, their fluid dynamics properties enable seamless liquid transfer and efficient pump operation. Moreover, these pumps are integral to hydraulic systems, pipeline transportation, and fluid transfer systems. Their importance extends to tank unloading and tanker truck loading, where they ensure pumping solutions that meet the highest industry standards. Despite their complexity, rotor screw pumps are relatively easy to install and maintain. Their role in process automation and pump troubleshooting is essential in ensuring the smooth operation of industrial pumping systems. In summary, rotor screw pumps are a vital component in the bulk liquid handling industry, offering efficient and reliable pumping solutions for a wide range of applications.
How is this Two Rotor Screw Pump Industry segmented and which is the largest segment?
The two rotor screw pump industry research report provides comprehensive data (region-wise segment analysis), with forecasts and estimates in "USD million" for the period 2024-2028, as well as historical data from 2018-2022 for the following segments.
- Application
- Petrochemicals
- Food and beverages
- Geography
- Middle East and Africa
- North America
- Canada
- US
- Europe
- Germany
- UK
- APAC
- China
- India
- Japan
- South America
- Middle East and Africa
By Application Insights
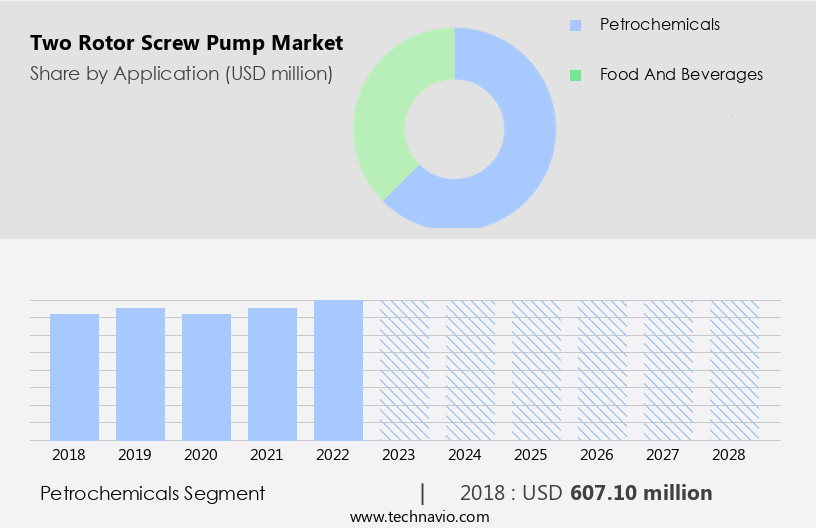
- The petrochemicals segment is estimated to witness significant growth during the forecast period.
The petrochemical industry relies heavily on two rotor screw pumps for continuous production and ensuring worker safety. These pumps are essential in handling viscous liquids and maintaining efficiency in the chemical industry. Two rotor screw pumps are commonly used in oil refining, petrochemical, and chemical sectors to move various types of non-corrosive liquids, including crude oil, fuels, oils, bitumen, and paraffin residues. These pumps offer lubricating properties and do not contain abrasive impurities, making them ideal for multiphase pumping applications. In the backpressure mode, two rotor screw pumps can boost pressure and enhance the pumping efficiency. Overall, the demand for two rotor screw pumps remains high in the petrochemical industry due to their ability to handle demanding applications while ensuring dependable and efficient production.
Get a glance at the Two Rotor Screw Pump Industry report of share of various segments Request Free Sample
The petrochemicals segment was valued at USD 607.10 million in 2018 and showed a gradual increase during the forecast period.
Regional Analysis
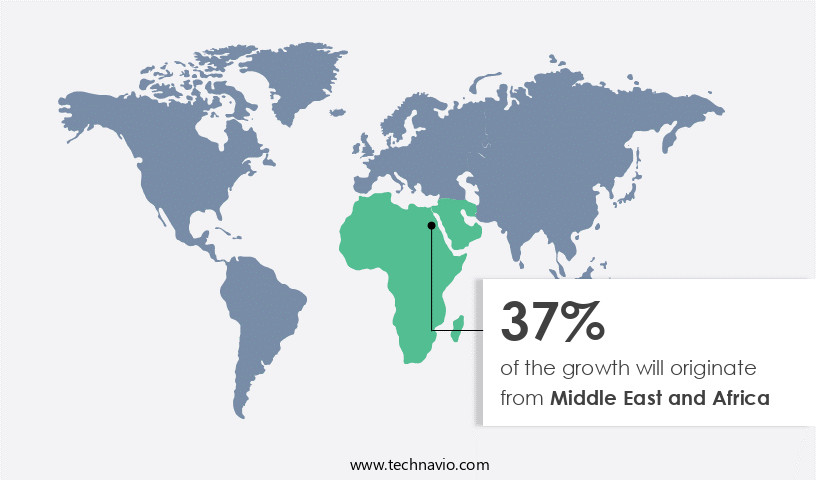
- Middle East and Africa is estimated to contribute 37% to the growth of the global market during the forecast period.
Technavio's analysts have elaborately explained the regional trends and drivers that shape the market during the forecast period.
For more insights on the market share of various regions, Request Free Sample
In the Middle East and Africa (MEA) region, the oil and gas industry's expansion, particularly in countries like Saudi Arabia, the UAE, Iran, and Qatar, drives the demand for two rotor screw pumps. Upcoming projects in Africa, such as those in Mozambique, Kenya, South Africa, and Tanzania, will increase oil drilling activities and necessitate the installation of gas pipelines, storage tanks, and LNG pipelines. Additionally, the adoption of gas detection systems supports market growth. In Africa, economic growth in several developing nations has led to an increase in disposable income levels, boosting demand for high-quality, hygienic food and beverages. Two rotor screw pumps are essential in the food and beverage industry for transferring liquids, including wastewater and emulsions, in various applications. These pumps' ability to handle high solids content and prevent hydrate blockage naturally makes them a preferred choice.
Market Dynamics
Our two rotor screw pump market researchers analyzed the data with 2023 as the base year, along with the key drivers, trends, and challenges. A holistic analysis of drivers will help companies refine their marketing strategies to gain a competitive advantage.
What are the key market drivers leading to the rise in adoption of Two Rotor Screw Pump Industry?
Increasingly stringent regulations in food and beverage industries is the key driver of the market.
- In the US market, two rotor screw pumps are extensively used in various industries, including food and beverage, pharmaceutical, biotechnology, and sterile applications. These industries are heavily regulated, with stringent safety standards enforced by numerous governing bodies such as the US Food and Drug Administration (FDA), European Hygienic Engineering and Design Group (EHEDG), 3-A Sanitary Standards Inc, US Dairy Association (USDA), National Sanitation Foundation (NSF), US Environmental Protection Agency (EPA), EU Machine Guidelines, GMP Rules and Regulations, and EU Foodstuff Hygienic Guidelines. These regulations ensure the design and material construction of positive displacement pumps, including multiple screw pumps and non-multiphase pumps, meet high standards for hygiene and cleanliness.
- Moreover, two rotor screw pumps are commonly used in road tankers for transporting chemicals, wastewater, and other liquids. In road tanker applications, these pumps ensure consistent speed, outflow, and flow rate, even during unloading and tank loading, preventing hydrate blockage and pulsation on the input side. They are also used in multiphase pumps and hydraulic fracturing, providing backpressure and handling emulsions effectively. Despite the increasing regulations, the demand for two rotor screw pumps continues to grow due to their efficiency, reliability, and ability to handle a wide range of applications.
What are the market trends shaping the Two Rotor Screw Pump Industry?
Integration of pumps with IIoT is the upcoming trend in the market.
- The market is experiencing significant growth due to the increasing demand for efficient and reliable pumps in various industries. One of the primary sectors driving this growth is the oil and gas industry, where the implementation of hydraulic fracturing techniques has led to an increase in the use of multiple screw pumps in road tankers. These pumps offer advantages such as high outflow rates, improved speed, and the ability to handle multiphase fluids, including emulsions and wastewater. The integration of advanced technologies, such as the Industrial Internet of Things (IIoT), is also contributing to the market's growth. IIoT enables real-time monitoring and analysis of pump performance and process parameters, leading to increased efficiency and reduced downtime.
- Furthermore, this technology is particularly useful in applications such as tank loading and unloading, where maintaining consistent flow rates and pressure is crucial. However, challenges such as hydrate blockage and pulsation can impact the performance of non-multiphase pumps. To address these issues, manufacturers are developing pumps with innovative features, such as backpressure capabilities and hydraulically balanced chambers. These advancements are helping to improve the overall efficiency and reliability of the market. In summary, the market is experiencing growth due to the increasing demand for efficient and reliable pumps in various industries, particularly in the oil and gas sector. The integration of advanced technologies, such as IIoT, is driving innovation and improving pump performance, while challenges such as hydrate blockage and pulsation are being addressed through the development of new features and designs.
What challenges does Two Rotor Screw Pump Industry face during the growth?
Volatility in raw material prices is a key challenge affecting the industry growth.
- The market faces challenges due to the volatile prices of raw materials used in manufacturing, such as cast iron, bronze, stainless steel, aluminum, and copper. This can hinder the adoption of these pumps in price-sensitive markets, particularly in developing countries. The price fluctuations are influenced by various factors, including increased taxes, duties, and tariffs, as well as production disruptions in metal ore-producing countries. These price changes can significantly impact the entire supply chain, from the input side of the pump manufacturing process to the unloading of the finished product at terminals. In the oil and gas industry, two rotor screw pumps are widely used in applications such as hydraulic fracturing, road tanker loading, and wastewater treatment.
- In addition, they offer advantages such as high outflow rates, positive displacement, and the ability to handle multiphase fluids, emulsions, and non-multiphase liquids. However, challenges related to hydrate blockage, pulsation, and backpressure can affect their performance and efficiency. Despite these challenges, the market for two rotor screw pumps is expected to grow due to their ability to handle a wide range of applications and fluids, including chemicals and wastewater. The pumps' ability to maintain consistent flow rates and handle high pressures makes them a popular choice for various industries.
Exclusive Customer Landscape
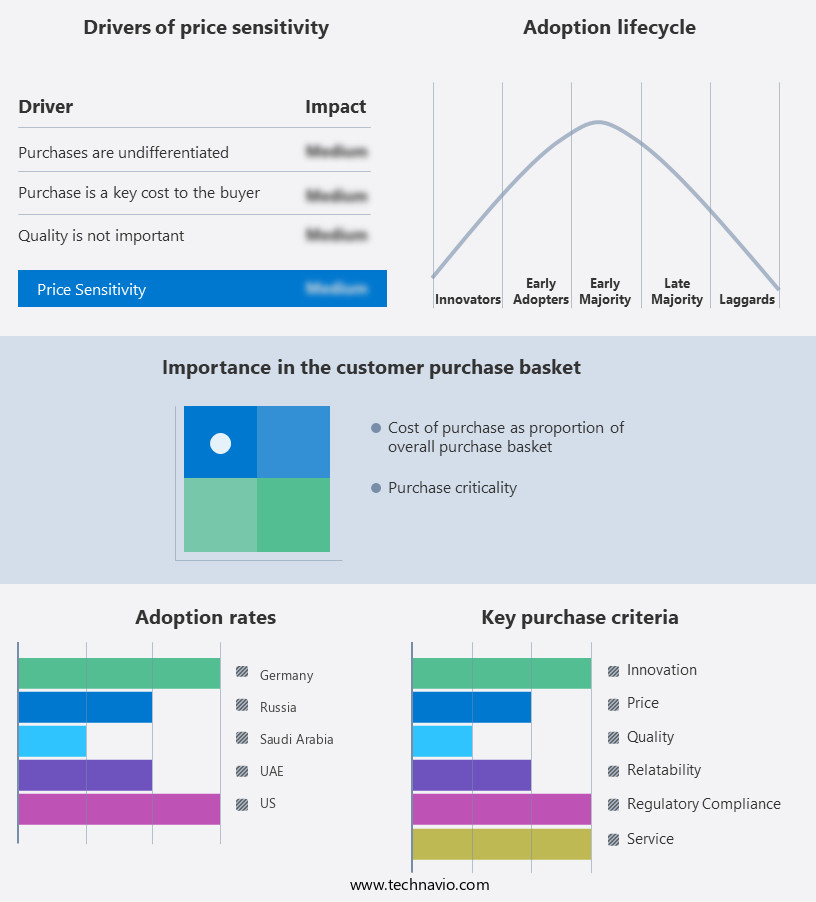
The two rotor screw pump market forecasting report includes the adoption lifecycle of the market, covering from the innovator's stage to the laggard's stage. It focuses on adoption rates in different regions based on penetration. Furthermore, the market report also includes key purchase criteria and drivers of price sensitivity to help companies evaluate and develop their market growth analysis strategies.
Customer Landscape
Key Companies & Market Insights
Companies are implementing various strategies, such as strategic alliances, market forecast, partnerships, mergers and acquisitions, geographical expansion, and product/service launches, to enhance their presence in the industry.
The two rotor screw pump industry research and growth report includes detailed analyses of the competitive landscape of the market and information about key companies, including:
- Alfa Laval AB
- Ampco Pumps Co.
- Axiflow Technologies Inc.
- CIRCOR International
- Delta-p Pumpe og Kompressor Systemer AS
- Erich NETZSCH BV and Co. Holding KG
- Flowserve Corp.
- Holland Legacy Pump Group BV
- Houttuin BV
- Huangshan RSP Manufacturing Co. Ltd.
- ITT Inc.
- KRAL GmbH
- Leistritz Advanced Technologies Corp.
- PSG Dover
- Pumpenfabrik Wangen GmbH
- SEIM Srl
- SPX FLOW Inc.
- TAPFLO AB
Qualitative and quantitative analysis of companies has been conducted to help clients understand the wider business environment as well as the strengths and weaknesses of key industry players. Data is qualitatively analyzed to categorize companies as pure play, category-focused, industry-focused, and diversified; it is quantitatively analyzed to categorize companies as dominant, leading, strong, tentative, and weak.
Research Analyst Overview
These pumps employ the principle of positive displacement, which means they move fluid by trapping it in chambers and forcing it out through the discharge port. This mechanism ensures consistent flow rates, making rotor screw pumps an ideal choice for applications requiring precise fluid handling. The two rotor screw pump market is driven by several factors, including the increasing demand for these pumps in various industries such as hydraulic fracturing, wastewater treatment, and transportation of chemicals.
Moreover, in the hydraulic fracturing sector, rotor screw pumps are used to transport fluids at high pressures and temperatures, enabling the extraction of shale gas and oil. In the wastewater treatment industry, these pumps are employed for the unloading of wastewater from road tankers. The ability of rotor screw pumps to handle multiphase fluids, including emulsions, and low viscous liquids makes them a preferred choice for wastewater treatment applications. The pumps' high-pressure capabilities also enable the efficient transfer of wastewater from tankers to treatment facilities. The design of rotor screw pumps allows them to operate efficiently even when dealing with backpressure, making them suitable for use in terminals and other applications where pressure fluctuations are common.
Furthermore, these pumps' strongness and reliability make them a popular choice in the chemical industry, where they are used for the transfer of chemicals from storage vessels to processing units. Despite their advantages, rotor screw pumps face challenges such as hydrate blockage, which can occur when water comes into contact with hydrocarbons at low temperatures. This issue can lead to reduced flow rates and even pump failure. To mitigate this challenge, manufacturers have developed pumps with specialized designs, such as those with pitched rotors, which help prevent hydrate formation. Another challenge faced by rotor screw pumps is pulsation, which can occur due to the positive displacement mechanism.
In addition, this issue can lead to pressure fluctuations and vibrations, which can negatively impact pump performance and potentially cause damage. To address this challenge, manufacturers have developed technologies such as increase tanks and pulsation dampeners to help stabilize pump operation. Pump selection for liquid transfer systems requires considering factors like solid free operation, the handling of low viscosity, and the efficiency of high-pressure pumping. Proper pump design and pump installation are essential for tasks such as vessel loading and liquid transfer via rail tankers, with ongoing pump repair needed for optimal performance.
|
Two Rotor Screw Pump Market Scope |
|
|
Report Coverage |
Details |
|
Page number |
168 |
|
Base year |
2023 |
|
Historic period |
2018-2022 |
|
Forecast period |
2024-2028 |
|
Growth momentum & CAGR |
Accelerate at a CAGR of 5.9% |
|
Market growth 2024-2028 |
USD 270.7 million |
|
Market structure |
Fragmented |
|
YoY growth 2023-2024(%) |
5.5 |
|
Key countries |
US, Saudi Arabia, UAE, Russia, Germany, Japan, China, Canada, UK, and India |
|
Competitive landscape |
Leading Companies, Market Positioning of Companies, Competitive Strategies, and Industry Risks |
What are the Key Data Covered in this Market Research and Growth Report?
- CAGR of the Two Rotor Screw Pump industry during the forecast period
- Detailed information on factors that will drive the market growth and forecasting between 2024 and 2028
- Precise estimation of the size of the market and its contribution of the industry in focus to the parent market
- Accurate predictions about upcoming market growth and trends and changes in consumer behaviour
- Growth of the market across Middle East and Africa, North America, Europe, APAC, and South America
- Thorough analysis of the market's competitive landscape and detailed information about companies
- Comprehensive analysis of factors that will challenge the growth of industry companies
We can help! Our analysts can customize this market research report to meet your requirements. Get in touch


