
Type 2 Diabetes Market Size 2025-2029
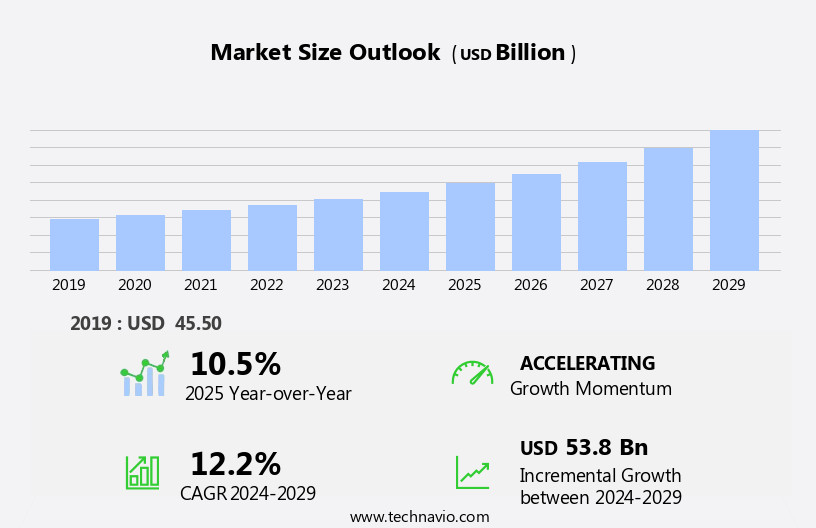
The type 2 diabetes market size is forecast to increase by USD 53.8 billion, at a CAGR of 12.2% between 2024 and 2029.
- The market is experiencing significant growth due to the rising prevalence of diabetes, fueled by an increasing geriatric population. This demographic trend, coupled with the underdiagnosis of the condition, presents both opportunities and challenges for market participants. The large, untapped population of undiagnosed individuals represents a significant market opportunity for innovative diagnostic solutions. However, the low diagnosis rate also poses a challenge, as untreated diabetes can lead to severe health complications and increased healthcare costs. The geriatric population, with its higher susceptibility to diabetes, further exacerbates this challenge.
- To capitalize on the market opportunities and navigate these challenges effectively, companies must focus on developing innovative diagnostic tools and effective patient education programs. By addressing the unmet needs in diabetes diagnosis and management, market participants can differentiate themselves and capture a larger share of this growing market.
What will be the Size of the Type 2 Diabetes Market during the forecast period?
Explore in-depth regional segment analysis with market size data - historical 2019-2023 and forecasts 2025-2029 - in the full report.
Request Free Sample
The market continues to evolve, driven by advancements in diabetes management, public health, and weight management. Pancreatic beta-cell destruction and the subsequent need for insulin therapy remain at the forefront of market dynamics. Diabetes burden is a significant concern, with diabetic nephropathy, diabetic retinopathy, and diabetic neuropathy posing significant health risks. SGLT2 inhibitors have emerged as a promising treatment option, addressing both glycemic control and cardiovascular disease. Healthcare access and access to care are crucial factors shaping the market. Global health initiatives and healthcare costs are influencing the development of diabetes technology, including insulin delivery devices, glucose sensors, and remote monitoring.
Precision medicine, data analytics, and machine learning are transforming diabetes education and patient engagement. Lifestyle modifications, such as dietary changes and physical activity, remain essential components of diabetes management. Insulin resistance, insulin therapy, and HbA1c testing continue to be key areas of focus in the medical device industry. Ongoing research in areas like Genetic Testing, Stem Cell Therapy, and primary care physician engagement is further shaping the market. Health disparities, early detection, and glycemic control are critical public health concerns. Diabetes prevention and healthcare provider collaboration are essential to improving health outcomes. The market is continually unfolding, with ongoing drug development, clinical trials, and advancements in diabetes technology driving innovation.
How is this Type 2 Diabetes Industry segmented?
The type 2 diabetes industry research report provides comprehensive data (region-wise segment analysis), with forecasts and estimates in "USD billion" for the period 2025-2029, as well as historical data from 2019-2023 for the following segments.
- Drug Class
- Insulin
- DPP-4 inhibitor
- GLP-1 receptor agonists
- SGLT-2 inhibitors
- Others
- Distribution Channel
- Retail pharmacies
- Hospital pharmacies
- Online pharmacies
- Delivery Mode
- Oral
- Injectable
- Continuous glucose monitoring (CGM)
- Geography
- North America
- US
- Canada
- Europe
- France
- Germany
- Italy
- UK
- APAC
- China
- India
- Japan
- South Korea
- Rest of World (ROW)
- North America
.
By Drug Class Insights
The insulin segment is estimated to witness significant growth during the forecast period.
Type 2 diabetes is a complex condition characterized by insulin resistance and pancreatic beta-cell dysfunction, leading to elevated blood glucose levels. Metabolic syndrome, an autoimmune disease, and a precursor to type 2 diabetes, affects millions worldwide. The medical device industry is responding with innovative solutions, such as artificial pancreas systems and insulin delivery devices, to improve glycemic control and enhance quality of life. Artificial intelligence and machine learning are revolutionizing diabetes management by facilitating early detection, personalized treatment plans, and remote monitoring. Diabetes burden is significant, with complications including diabetic foot ulcers, diabetic retinopathy, diabetic neuropathy, and diabetic nephropathy.
Prevention and management involve lifestyle modifications, such as dietary changes and physical activity, as well as pharmacological interventions, including oral antidiabetic medications, insulin therapy, and newer classes like GLP-1 receptor agonists and SGLT2 inhibitors. Health disparities and access to care remain critical concerns in diabetes management. Primary care physicians play a vital role in diagnosing and managing diabetes, while healthcare providers and clinical trials are advancing our understanding of the disease and developing new treatments. Precision medicine, genetic testing, and stem cell therapy offer promising avenues for future research. The diabetes market is dynamic, with ongoing advancements in insulin delivery devices, blood glucose monitoring, and HbA1c testing.
Diabetes education, patient engagement, and remote monitoring are essential components of effective diabetes management. Healthcare costs and global health are significant concerns, with a growing emphasis on drug development and public health initiatives to address the diabetes epidemic.
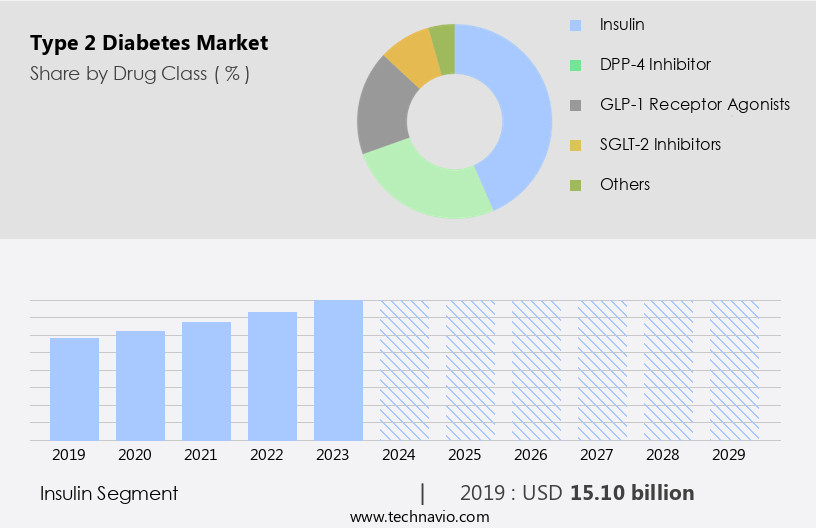
The Insulin segment was valued at USD 15.10 billion in 2019 and showed a gradual increase during the forecast period.
Regional Analysis
North America is estimated to contribute 39% to the growth of the global market during the forecast period. Technavio's analysts have elaborately explained the regional trends and drivers that shape the market during the forecast period.

The market in North America experiences significant growth due to the rising prevalence of diabetes in the region. Approximately 26.9 million people in North America, representing 8.2% of the population, have been diagnosed with Type 2 diabetes. The US, Canada, and Mexico have the highest diabetes incidence rates. Obesity, a major contributor to Type 2 diabetes, affects over 42% of the US population. The Centers for Disease Control and Prevention (CDC) reports that obesity-related health conditions, including heart disease, stroke, and certain types of cancer, are leading causes of preventable, premature death in the US. Metabolic syndrome, an autoimmune disease characterized by high blood sugar levels, insulin resistance, and obesity, is a significant risk factor for Type 2 diabetes.
The medical device industry plays a crucial role in diabetes management through innovations like artificial pancreas systems, insulin pumps, and continuous glucose sensors. Artificial intelligence (AI) and machine learning are revolutionizing diabetes care by enabling early detection, glycemic control, and patient engagement. Precision medicine and genetic testing offer personalized diabetes treatment plans. Dietary changes, physical activity, and lifestyle modifications are essential for diabetes prevention and management. Diabetes complications, such as diabetic foot ulcers, diabetic retinopathy, diabetic nephropathy, and diabetic neuropathy, significantly impact patients' quality of life and healthcare costs. Health disparities in diabetes care, particularly in underserved communities, require increased healthcare access and education.
Primary care physicians, healthcare providers, and clinical trials are instrumental in diabetes research and drug development. The diabetes burden is substantial, with high healthcare costs and a significant impact on global health. Insulin therapy, oral antidiabetic medications, and sglt2 inhibitors are common treatments for Type 2 diabetes. Diabetes education and remote monitoring are essential for effective diabetes management. Cardiovascular disease, a common complication of diabetes, poses a significant health risk. Public health initiatives and weight management programs aim to address the root causes of diabetes and improve overall health outcomes. Diabetes prevention and early detection are crucial for reducing the burden of this chronic condition.
Market Dynamics
Our researchers analyzed the data with 2024 as the base year, along with the key drivers, trends, and challenges. A holistic analysis of drivers will help companies refine their marketing strategies to gain a competitive advantage.
What are the key market drivers leading to the rise in the adoption of Type 2 Diabetes Industry?
- The increasing prevalence of diabetes serves as the primary driver for the market's growth.
- Type 2 diabetes is a chronic condition characterized by the body's inability to effectively use insulin, leading to high blood glucose levels. This disease is the most prevalent form of diabetes worldwide, with excess body weight and physical inactivity being the primary causes. Type 2 diabetes was once considered an adult-onset condition, but its prevalence among children has been increasing. The early diagnosis of Type 2 diabetes can be challenging due to its non-specific symptoms. To manage Type 2 diabetes, various diagnostic tools and treatments are available. HbA1c testing is a common method for diagnosing and monitoring the disease's progression.
- Blood glucose monitoring helps patients keep track of their glucose levels throughout the day. For pregnant women, gestational diabetes is a type of diabetes that requires special attention. Patient engagement is crucial in managing Type 2 diabetes. Technological advancements, such as machine learning algorithms and insulin pumps, have improved diabetes management. Genetic testing can help identify individuals at high risk for developing Type 2 diabetes. Diabetes complications include diabetic retinopathy, which can lead to blindness, and foot care issues. Oral antidiabetic medications and physical activity are essential components of managing Type 2 diabetes.
- While Type 1 diabetes is an autoimmune condition, Type 2 diabetes is a metabolic disorder. In conclusion, the rise in obesity and physical inactivity has led to a significant increase in the prevalence of Type 2 diabetes. Early diagnosis and effective management are crucial to prevent complications and improve patient outcomes. Diagnostic tools, treatments, and technological advancements continue to evolve, offering new opportunities for managing this chronic condition.
What are the market trends shaping the Type 2 Diabetes Industry?
- The geriatric population is experiencing significant growth and represents an emerging market trend. This demographic shift offers numerous opportunities for businesses and industries catering to the unique needs of older adults.
- Type 2 diabetes, a chronic condition characterized by insulin resistance and impaired pancreatic beta-cell function, poses a significant challenge to public health, particularly for aging populations. The global diabetes burden is escalating due to the combined effects of aging and lifestyle factors such as weight management. According to recent research, age-related insulin resistance is primarily linked to adiposity, sarcopenia, and physical inactivity. As people age, the beta cells of the pancreas undergo apoptosis, leading to a decline in their proliferative ability. Diabetes complications, including diabetic nephropathy and diabetic neuropathy, can significantly increase healthcare costs.
- Lifestyle modifications, such as weight management and regular exercise, are crucial for diabetes management. Pharmacological interventions, including SGLT2 inhibitors and insulin therapy, are essential for managing blood sugar levels. Healthcare access and affordability are critical factors in diabetes management. Inadequate access to care can lead to poor disease management, complications, and increased healthcare costs. Therefore, it is essential to prioritize diabetes prevention and management in healthcare policies and programs to mitigate the burden of this condition on individuals and healthcare systems. In conclusion, the aging population's increasing susceptibility to Type 2 diabetes, coupled with the associated complications and healthcare costs, necessitates a comprehensive approach to diabetes prevention and management.
- This includes lifestyle modifications, pharmacological interventions, and policies that ensure access to affordable and effective care.
What challenges does the Type 2 Diabetes Industry face during its growth?
- The low diagnosis rate poses a significant challenge to the industry's growth trajectory. In order to address this issue and foster industry expansion, it is crucial to invest in advanced diagnostic technologies and research initiatives.
- Type 2 diabetes, a chronic condition characterized by insulin resistance and high blood glucose levels, affects millions of people in the US. According to recent research, the disease may go undiagnosed for up to 12 years after its onset. Of those diagnosed, only half receive treatment from healthcare professionals. This means that a significant number of individuals with Type 2 diabetes are not receiving optimal care, potentially impacting health outcomes. Diabetes technology, such as glucose sensors and remote monitoring, plays a crucial role in managing the condition. Diabetes education is also essential for effective self-management.
- Healthcare providers, including primary care physicians, are key players in diabetes prevention and treatment. Drug development is ongoing to improve treatment options and reduce the risk of complications, including cardiovascular disease. Remote monitoring and clinical trials enable healthcare providers to closely monitor patients and adjust treatment plans accordingly. Diabetes prevention efforts are also underway to reduce the number of new cases. As the prevalence of Type 2 diabetes continues to rise, it is essential to prioritize early diagnosis and effective treatment to improve health outcomes for those affected.
Exclusive Customer Landscape
The type 2 diabetes market forecasting report includes the adoption lifecycle of the market, covering from the innovator's stage to the laggard's stage. It focuses on adoption rates in different regions based on penetration. Furthermore, the type 2 diabetes market report also includes key purchase criteria and drivers of price sensitivity to help companies evaluate and develop their market growth analysis strategies.

Customer Landscape
Key Companies & Market Insights
Companies are implementing various strategies, such as strategic alliances, type 2 diabetes market forecast, partnerships, mergers and acquisitions, geographical expansion, and product/service launches, to enhance their presence in the industry.
Amgen Inc. - The company specializes in developing Type 2 diabetes treatments utilizing small molecule inhibitors of the 11?-hydroxysteroid dehydrogenase 1 (11?-HSD1) enzyme.
The industry research and growth report includes detailed analyses of the competitive landscape of the market and information about key companies, including:
- Amgen Inc.
- AstraZeneca Plc
- Baxter International Inc.
- Biocon Ltd.
- Boehringer Ingelheim International GmbH
- Cadila Pharmaceuticals Ltd.
- Daiichi Sankyo Co. Ltd.
- DM Pharma Marketing Pvt. Ltd.
- Eli Lilly and Co.
- GlaxoSmithKline Plc
- Glenmark Pharmaceuticals Ltd.
- Johnson and Johnson Services Inc.
- Merck KGaA
- Novartis AG
- Novo Nordisk AS
- Pfizer Inc.
- Practo Technologies Pvt. Ltd.
- Sanofi SA
- Takeda Pharmaceutical Co. Ltd.
- Tonghua Dongbao Pharmaceutical Co. Ltd.
Qualitative and quantitative analysis of companies has been conducted to help clients understand the wider business environment as well as the strengths and weaknesses of key industry players. Data is qualitatively analyzed to categorize companies as pure play, category-focused, industry-focused, and diversified; it is quantitatively analyzed to categorize companies as dominant, leading, strong, tentative, and weak.
Recent Development and News in Type 2 Diabetes Market
- In February 2023, Novo Nordisk, a global healthcare company, announced the FDA approval of Rybelsus (semaglutide tablets), an once-daily oral medication for adults with type 2 diabetes. This new treatment option, which is taken by mouth instead of injection, is expected to expand the company's diabetes care portfolio and cater to patient preferences for non-insulin therapies (Novo Nordisk Press Release, 2023).
- In April 2024, Merck & Co. and Pfizer entered into a strategic collaboration to co-develop and co-commercialize their type 2 diabetes combination therapy, MK-3657 and semaglutide. This partnership aims to leverage the strengths of both companies and accelerate the development of a potentially effective and convenient treatment for diabetes patients (Merck & Co. Press Release, 2024).
- In June 2024, Roche Holding AG received FDA approval for its new insulin therapy, Basaglar U-300 KwikPen, a long-acting insulin treatment for type 2 diabetes. This approval marks an expansion of Roche's diabetes care portfolio and provides patients with a new, more convenient dosing option (Roche Holding AG Press Release, 2024).
Research Analyst Overview
- In the dynamic the market, diabetes advocacy groups play a pivotal role in raising awareness and promoting effective diabetes care. Diabetes complications management, including diabetic nephropathy progression and diabetic retinopathy screening, is a significant focus for researchers and healthcare providers. Diabetes research funding is crucial for advancing diabetes care, with ongoing efforts in islet cell transplantation, pancreatic transplantation, and metabolic surgery. Personalized medicine, such as insulin resistance testing and insulin sensitivity assessment, is transforming diabetes treatment, enabling more effective glucose homeostasis management.
- Diabetes technology adoption, including closed-loop systems, is revolutionizing diabetes care, improving metabolic control and reducing hypoglycemic unawareness. Diabetes policy and diabetes data sharing are essential for optimizing diabetes care pathways and ensuring equitable access to diabetes care. Type 2 diabetes reversal and diabetic foot care are critical areas of ongoing research and innovation, with a growing emphasis on metabolic control and diabetes complications management.
Dive into Technavio's robust research methodology, blending expert interviews, extensive data synthesis, and validated models for unparalleled Type 2 Diabetes Market insights. See full methodology.
|
Market Scope |
|
|
Report Coverage |
Details |
|
Page number |
221 |
|
Base year |
2024 |
|
Historic period |
2019-2023 |
|
Forecast period |
2025-2029 |
|
Growth momentum & CAGR |
Accelerate at a CAGR of 12.2% |
|
Market growth 2025-2029 |
USD 53.8 billion |
|
Market structure |
Fragmented |
|
YoY growth 2024-2025(%) |
10.5 |
|
Key countries |
US, Germany, Canada, China, UK, India, France, Japan, Italy, and South Korea |
|
Competitive landscape |
Leading Companies, Market Positioning of Companies, Competitive Strategies, and Industry Risks |
What are the Key Data Covered in this Type 2 Diabetes Market Research and Growth Report?
- CAGR of the Type 2 Diabetes industry during the forecast period
- Detailed information on factors that will drive the growth and forecasting between 2025 and 2029
- Precise estimation of the size of the market and its contribution of the industry in focus to the parent market
- Accurate predictions about upcoming growth and trends and changes in consumer behaviour
- Growth of the market across North America, Europe, Asia, and Rest of World (ROW)
- Thorough analysis of the market's competitive landscape and detailed information about companies
- Comprehensive analysis of factors that will challenge the type 2 diabetes market growth of industry companies
We can help! Our analysts can customize this type 2 diabetes market research report to meet your requirements.