
UK Used Car Market Size 2025-2029
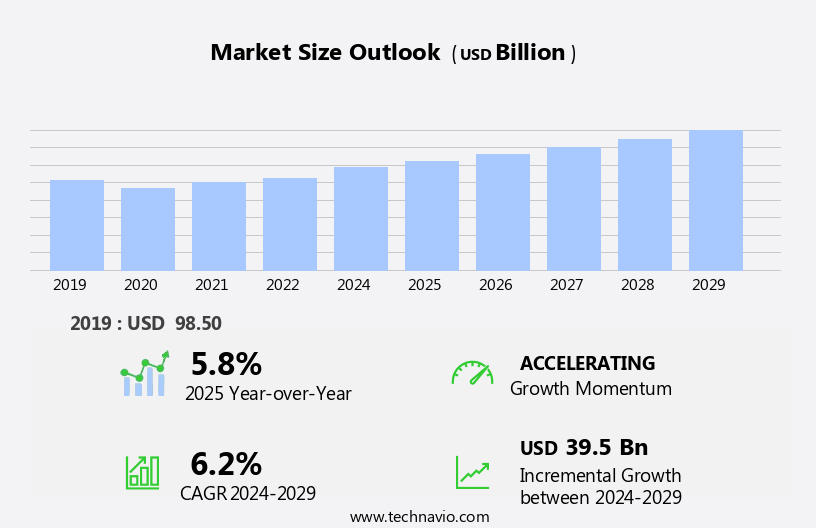
The uk used car market size is forecast to increase by USD 39.5 billion, at a CAGR of 6.2% between 2024 and 2029.
- The Used Car Market in the UK is driven by the excellent value for money proposition that pre-owned vehicles offer, making them an attractive alternative to new cars for many consumers. Another significant trend shaping the market is the increasing preference for car subscription services, which provide flexibility and convenience for customers. However, the market also faces challenges, including the growing importance of digital touchpoints in the car buying process and the need for dealers to adapt and improve their online presence.
- Additionally, the rise of car subscription services poses a threat to traditional dealership models, requiring dealers to explore new business models and revenue streams to remain competitive. Companies seeking to capitalize on market opportunities and navigate challenges effectively should focus on enhancing their digital presence, offering flexible and convenient purchasing options, and exploring partnerships with car subscription services.
What will be the size of the UK Used Car Market during the forecast period?
Explore in-depth regional segment analysis with market size data - historical 2019-2023 and forecasts 2025-2029 - in the full report.
Request Free Sample
- The used car market in the UK is influenced by various factors, including the exterior and interior condition of the vehicles, financial history, economic trends, and consumer demand. Financially sound buyers prefer cars with well-maintained exteriors and interiors, ensuring lower car ownership costs in the long run. Economic trends, such as inflation and interest rates, impact car financing options and vehicle affordability. Maintaining a vehicle's fuel consumption within acceptable limits and adhering to the vehicle maintenance schedule is crucial for reliable performance and resale value. Financial institutions consider a vehicle's title, accident history, and service records when assessing car financing options.
- Emerging technologies, such as electric vehicles and autonomous driving, are transforming the industry, while insurance coverage, safety ratings, and vehicle age & mileage remain essential factors in consumer decision-making. Previous owners, engine size & type, transmission options, and vehicle features & equipment also influence consumer preferences. Car repair costs, loan terms, car financing options, and industry innovations contribute to market volatility. Registration documents, vehicle history records, and insurance coverage are essential for transparency and trust. Understanding the impact of these factors on car ownership costs is crucial for businesses operating in the UK used car market.
How is this market segmented?
The market research report provides comprehensive data (region-wise segment analysis), with forecasts and estimates in "USD billion" for the period 2025-2029, as well as historical data from 2019-2023 for the following segments.
- Channel
- Organized
- Unorganized
- Vehicle Type
- Compact car
- SUV
- Mid size
- Sales Channel
- Dealerships
- Online Platforms
- Private Sales
- Fuel Type
- Petrol
- Diesel
- Hybrid
- Electric
- Geography
- Europe
- UK
- Europe
By Channel Insights
The organized segment is estimated to witness significant growth during the forecast period.
The used car market in the UK is characterized by various entities that influence its dynamics and trends. Depreciation and car insurance premiums are significant factors that impact the affordability of used cars. Safety features, a priority for consumers, are increasingly being incorporated into used vehicles through refinishing and upgrades. Car rental companies offer flexible mobility solutions, while automotive technology advances drive the adoption of vehicle diagnostics and digital car retailing. Used car dealerships and online marketplaces facilitate transactions with vehicle inspections, mileage verification, and consumer reviews. Sustainable transportation initiatives and online payment systems are shaping the market, as are car leasing agreements, price elasticity, and inflation rates.
Fuel efficiency, car finance options, and driving assistance systems are key considerations for buyers. Government incentives and emissions standards influence consumer spending patterns, with a growing interest in alternative fuel vehicles and hybrid car technology. Fleet management services and car maintenance costs are essential services for businesses and individuals alike. Industry regulations and consumer protection laws ensure transparency and trust in the market. Used car warranty, customer satisfaction ratings, and brand reputation are crucial factors for buyers. The market share dynamics of organized companies, including dealership chains, online marketplaces, and OEM-affiliated dealerships, are shaped by their ability to provide guarantees, technical expertise, and digitalization.
The electric vehicle market and car transport services are emerging areas of growth. Demand forecasting and engine reconditioning are essential practices for dealers and buyers, influenced by economic indicators and vehicle reliability. Car parts market, service history records, and spare parts sourcing are essential components of the used car ecosystem. Overall, the used car market in the UK is a complex and evolving ecosystem, shaped by various interconnected factors.
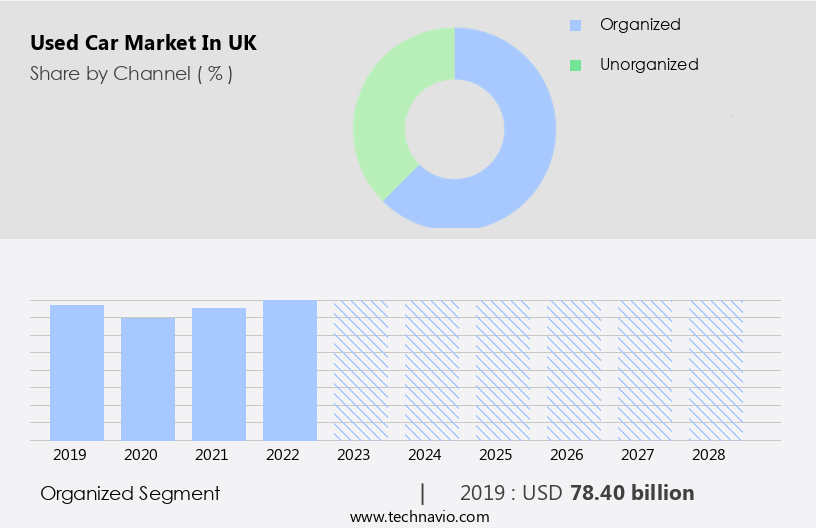
The Organized segment was valued at USD 78.40 billion in 2019 and showed a gradual increase during the forecast period.
Market Dynamics
Our researchers analyzed the data with 2024 as the base year, along with the key drivers, trends, and challenges. A holistic analysis of drivers will help companies refine their marketing strategies to gain a competitive advantage.
What are the UK Used Car Market drivers leading to the rise in adoption of the Industry?
- The significant value proposition of used cars, characterized by excellent return on investment, serves as the primary catalyst for the market's growth.
- The used car market in the UK is experiencing significant growth due to several factors. With an increasing number of automakers entering this sector and the proliferation of online used car dealerships, the perception of used cars' quality is improving. However, potential buyers remain cautious about the vehicle's history and any undisclosed damage, which may occur after purchase and fall outside of the warranty. To build trust, used car dealers offer additional services such as extended warranties, vehicle inspections, mileage verification, and car refinishing. Car rental companies also contribute to the market by selling their fleet vehicles once they reach a certain age or mileage.
- Automotive technology advances, including vehicle diagnostics and safety features, further enhance the appeal of used cars. Online car marketplaces facilitate the buying process, making it more accessible and convenient for consumers. Sustainable transportation initiatives also contribute to the growing popularity of used cars as an eco-friendly alternative to new vehicles.
What are the UK Used Car Market trends shaping the Industry?
- Improving touchpoint management is an essential trend in today's market. By effectively managing interactions between a business and its customers at various touchpoints, organizations can enhance the customer experience and build stronger relationships.
- Used cars in the UK market are gaining significant traction online, with dealers and manufacturers utilizing digital platforms to showcase their inventories. These websites serve as a primary touchpoint for potential buyers, offering research services tailored to individual preferences. Consumers extensively investigate car models, features, prices, and locations before making a purchase decision. Online used car dealers must prioritize creating user-friendly and visually appealing sites to capture customer interest. Several websites provide customized research services, making it essential for dealers to offer seamless online experiences. Key features that influence buyer decisions include vehicle history reports, price elasticity, fuel efficiency, and car finance options.
- Inflation rates and emissions standards also play a role in the purchasing process. Advancements in technology, such as digital car retailing and driving assistance systems, add value to the used car market. Consumer reviews and fleet management services further enhance the buying experience. Online payment systems ensure a secure and convenient purchasing process. Vehicle valuation tools help buyers make informed decisions based on market trends. In conclusion, the UK used car market is characterized by extensive research, technological advancements, and a shift towards digital platforms. Dealers must prioritize creating an engaging online presence to cater to the evolving needs of potential buyers.
How does UK Used Car Market faces challenges face during its growth?
- The rising demand for car subscription services poses a significant challenge to the automotive industry's growth trajectory.
- The used car market in the UK is experiencing significant shifts with the emergence of car subscription services. This business model, which allows consumers to lease different vehicle models for a set period and miles, is gaining popularity among those seeking personal transportation without the long-term commitment and investment of owning a single vehicle. Car subscription services offer several advantages, including reduced financial strain for buyers as they pay only a fraction of the vehicle's cost. This trend could potentially decrease the number of used car buyers, as the subscription model is often more economical than purchasing a used car.
- Government incentives for alternative fuel vehicles and industry regulations aim to promote eco-friendly transportation solutions, influencing consumer spending patterns. Car maintenance costs, service history records, and consumer satisfaction ratings are crucial factors for potential buyers when considering a used car purchase. The car parts market plays a vital role in the used car industry, with the availability and affordability of high-quality parts affecting the overall value and desirability of a used vehicle. Brand reputation and customer satisfaction ratings are essential for used car dealers, as they can significantly impact market share dynamics. Road tax regulations and used car warranty options are essential considerations for buyers, ensuring they are aware of the ongoing costs associated with owning a used vehicle.
- The UK used car market remains subject to various industry regulations, ensuring fair business practices and consumer protection. In conclusion, the UK used car market is influenced by various factors, including car subscription services, consumer spending patterns, car parts market, government incentives, and industry regulations. Understanding these dynamics is crucial for businesses looking to navigate this market effectively.
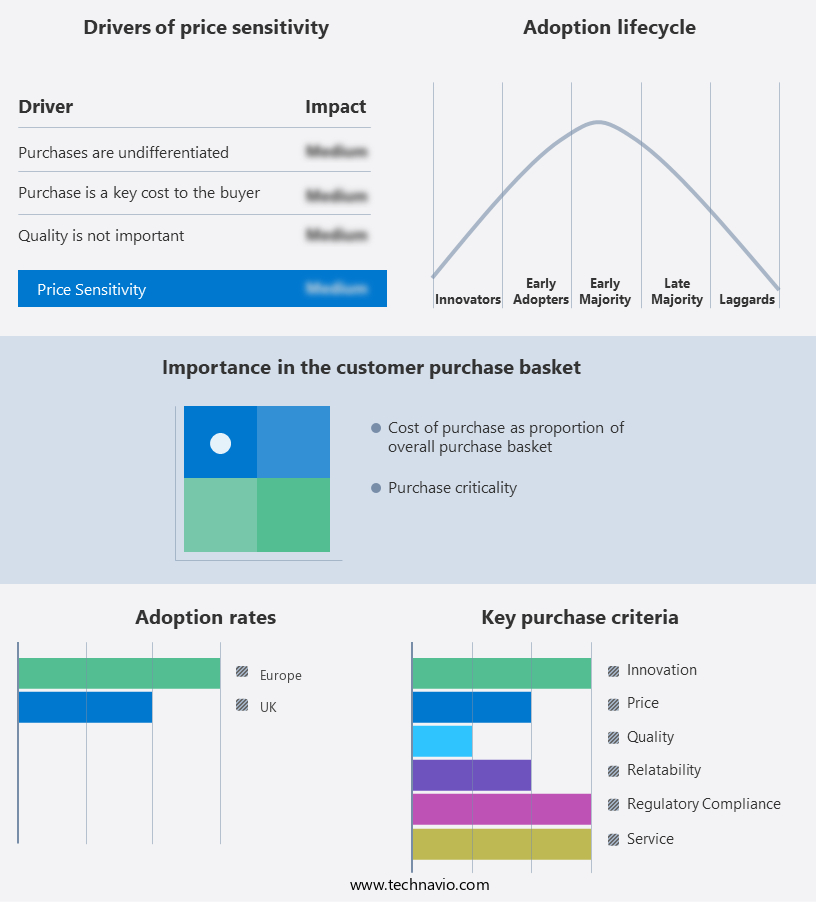
Exclusive UK Used Car Market Customer Landscape
The market forecasting report includes the adoption lifecycle of the market, covering from the innovator’s stage to the laggard’s stage. It focuses on adoption rates in different regions based on penetration. Furthermore, the report also includes key purchase criteria and drivers of price sensitivity to help companies evaluate and develop their market growth analysis strategies.
Customer Landscape
Key Companies & Market Insights
Companies are implementing various strategies, such as strategic alliances, market forecast partnerships, mergers and acquisitions, geographical expansion, and product/service launches, to enhance their presence in the market.
The market research and growth report includes detailed analyses of the competitive landscape of the market and information about key companies, including:
- Alibaba Group Holding Ltd.
- Aramis Group
- Arnold Clark Automobiles Ltd.
- Auto Trader Group Plc
- Bauer Media Group
- Car Giant Ltd.
- Carcraft.co.uk
- CarGurus Inc.
- CarMax Inc.
- Cazoo Ltd.
- Cinch Cars Ltd.
- Constellation Automotive Group Ltd.
- Group 1 Automotive Inc.
- Hertz Global Holdings Inc.
- Lithia Motors Inc.
- McCarthy Cars UK Ltd.
- Motors.co.uk Ltd.
- Penske Corp.
- Toyota Motor Corp.
- TrueCar Inc.
Qualitative and quantitative analysis of companies has been conducted to help clients understand the wider business environment as well as the strengths and weaknesses of key market players. Data is qualitatively analyzed to categorize companies as pure play, category-focused, industry-focused, and diversified; it is quantitatively analyzed to categorize companies as dominant, leading, strong, tentative, and weak.
Recent Development and News in Used Car Market In UK
- In January 2024, the UK's largest used car retailer, CarGurus UK, announced a strategic partnership with the Royal Automobile Club (RAC), enabling CarGurus to offer RAC Inspections and Warranties on its platform, enhancing consumer trust and confidence (CarGurus UK Press Release).
- In March 2024, Cox Automotive, a leading global automotive marketplace, completed the acquisition of Motors.Co.Uk, a significant UK used car marketplace, further expanding its digital marketplace presence and increasing its market share (Cox Automotive Press Release).
- In May 2025, the UK government introduced a new policy to incentivize the sale of used electric vehicles (UEVs) by offering grants of up to £2,500 for eligible buyers, aiming to boost the UEV market and reduce carbon emissions (GOV.UK Press Release).
- In the same month, Tesla, the electric vehicle manufacturer, launched its Tesla Used Vehicles platform in the UK, allowing consumers to purchase pre-owned Tesla vehicles directly from the company, bypassing traditional dealerships and offering competitive pricing (Tesla Press Release).
Research Analyst Overview
The used car market in the UK continues to evolve, driven by a multitude of dynamic factors. Online payment systems facilitate seamless transactions, enabling used car exports to expand globally. Car leasing agreements offer flexibility for businesses and individuals alike, while price elasticity and inflation rates influence consumer spending patterns. Driving assistance systems and vehicle history reports are increasingly important considerations for buyers, as are fuel efficiency and car finance options. Consumer reviews shape perceptions and inform decision-making, with fleet management services optimizing operations for businesses. Emissions standards and sustainable transportation solutions are shaping the future of the industry, alongside digital car retailing and car subscription services.
Car maintenance costs, government incentives, and consumer protection laws also play significant roles in the market. The car parts market, service history records, and automotive logistics ensure vehicles remain operational, while car rental companies offer short-term mobility solutions. Market share dynamics, brand reputation, and industry regulations influence competition, with car buyer personas and road tax regulations shaping consumer behaviour. Alternative fuel vehicles, hybrid car technology, and electric vehicle market growth further complicate the landscape, requiring ongoing analysis and adaptation. The used car market's continuous dynamism underscores the importance of staying informed and agile.
Dive into Technavio’s robust research methodology, blending expert interviews, extensive data synthesis, and validated models for unparalleled Used Car Market in UK insights. See full methodology.
|
Market Scope |
|
|
Report Coverage |
Details |
|
Page number |
157 |
|
Base year |
2024 |
|
Historic period |
2019-2023 |
|
Forecast period |
2025-2029 |
|
Growth momentum & CAGR |
Accelerate at a CAGR of 6.2% |
|
Market growth 2025-2029 |
USD 39.5 billion |
|
Market structure |
Fragmented |
|
YoY growth 2024-2025(%) |
5.8 |
|
Competitive landscape |
Leading Companies, Market Positioning of Companies, Competitive Strategies, and Industry Risks |
What are the Key Data Covered in this Market Research Report?
- CAGR of the market during the forecast period
- Detailed information on factors that will drive the market growth and forecasting between 2025 and 2029
- Precise estimation of the size of the market and its contribution of the market in focus to the parent market
- Accurate predictions about upcoming market growth and trends and changes in consumer behaviour
- Growth of the market across UK
- Thorough analysis of the market’s competitive landscape and detailed information about companies
- Comprehensive analysis of factors that will challenge the growth of market companies
We can help! Our analysts can customize this market research report to meet your requirements Get in touch
 RIA -
RIA - 
