Ultrasound Equipment Market Size 2025-2029
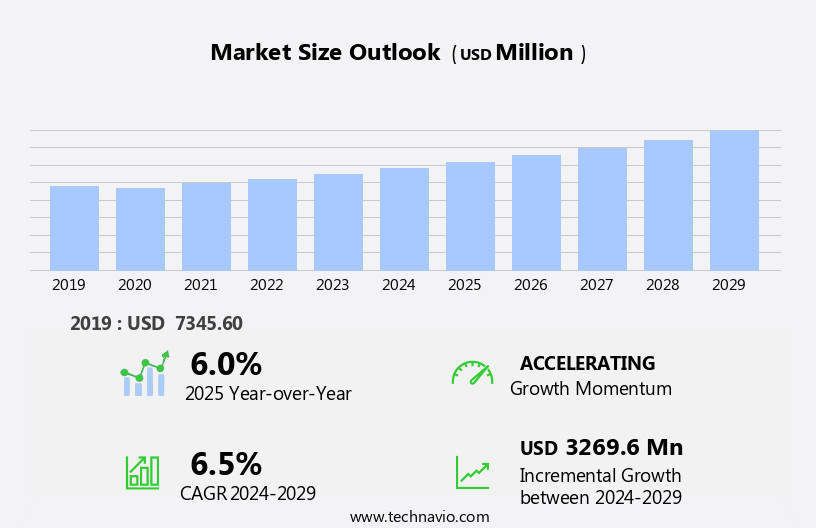
The ultrasound equipment market size is forecast to increase by USD 3.27 billion, at a CAGR of 6.5% between 2024 and 2029.
- The market is driven by the expanding applications of ultrasound technology beyond traditional diagnostic uses. This includes areas such as therapeutic interventions, image-guided procedures, and non-invasive surgeries. Another significant trend shaping the market is the integration of Artificial Intelligence (AI) into ultrasound systems, enabling advanced image analysis and diagnosis. However, the market faces challenges due to the saturation in developed markets, where the majority of the population already has access to ultrasound technology. To capitalize on opportunities and navigate these challenges, companies must focus on innovation, expanding their customer base in emerging markets, and collaborating with healthcare providers to offer comprehensive solutions.
- By addressing these trends and challenges, players in the market can effectively contribute to the advancement of healthcare and improve patient outcomes.
What will be the Size of the Ultrasound Equipment Market during the forecast period?
Explore in-depth regional segment analysis with market size data - historical 2019-2023 and forecasts 2025-2029 - in the full report.
Request Free Sample
The market continues to evolve, driven by advancements in technology and expanding applications across various sectors. Ultrasound guided biopsy, a minimally invasive diagnostic procedure, is increasingly being adopted in healthcare settings. Ultrasound systems are being integrated with high-frequency ultrasound for improved imaging in various fields, including vascular and obstetric applications. Ultrasound guided surgery and telehealth are revolutionizing the way medical procedures are performed and delivered. Real-time imaging and signal processing are key features enhancing the diagnostic accuracy of ultrasound imaging.
Ultrasound biopsy and guided drainage are essential interventions in the management of various conditions. The integration of ultrasound technology with robotics, telemedicine, injections, therapy, cryosurgery, biometrics, and contrast agents is expanding its reach and potential. The dynamic nature of this market ensures continuous innovation and growth.
How is this Ultrasound Equipment Industry segmented?
The ultrasound equipment industry research report provides comprehensive data (region-wise segment analysis), with forecasts and estimates in "USD million" for the period 2025-2029, as well as historical data from 2019-2023 for the following segments.
- End-user
- Hospitals
- Imaging centers
- Research centers
- Others
- Product Type
- Stationary ultrasound equipment
- Portable ultrasound equipment
- Application
- Diagnostic
- Therapeutic
- Technology
- 2D Ultrasound
- 3D Ultrasound
- 4D Ultrasound
- Doppler Ultrasound
- Component
- Transducers/Probes
- Workstations
- Software
- Accessories
- Geography
- North America
- US
- Canada
- Europe
- France
- Germany
- Italy
- UK
- Middle East and Africa
- UAE
- APAC
- China
- India
- Japan
- South Korea
- South America
- Brazil
- Rest of World (ROW)
- North America
.
By End-user Insights
The hospitals segment is estimated to witness significant growth during the forecast period.
The market encompasses various applications, including abdominal ultrasound, vascular ultrasound, obstetric ultrasound, and ultrasound guided procedures such as biopsy, drainage, and surgery. Ultrasound scanners utilize high-frequency and low-frequency ultrasound waves to produce real-time imaging, enabling early and accurate diagnosis. Ultrasound imaging is essential in guiding minimally invasive procedures, such as ultrasound-guided injections, osteotomy, and cryosurgery. Advancements in technology have led to the development of innovative ultrasound equipment, including 4D ultrasound, ultrasound transducers, and robotic systems. Ultrasound guided telehealth and telemedicine have gained popularity, expanding access to diagnostic services in remote areas. Image processing and signal processing technologies enhance the accuracy and quality of ultrasound images.
Ultrasound contrast agents improve the visualization of internal structures, particularly in complex cases. High-end private hospitals invest in the latest ultrasound equipment due to their focus on providing advanced diagnostic and therapeutic services to high-income patients. In contrast, government general hospitals face budget constraints and rely on diagnostic centers for sophisticated equipment. Ultrasound guided biofeedback and biometrics applications offer potential for improved patient care and outcomes. Doppler ultrasound and ultrasound software are essential tools for diagnosing vascular diseases and processing ultrasound data, respectively. The market continues to evolve, driven by technological advancements and increasing demand for non-invasive diagnostic procedures.
Ultrasound guided procedures, such as ultrasound-guided surgery and biopsy, offer minimally invasive alternatives to traditional surgical methods, reducing recovery time and complications. The integration of ultrasound technology in various medical fields, from cardiology to obstetrics, underscores its importance in modern healthcare.
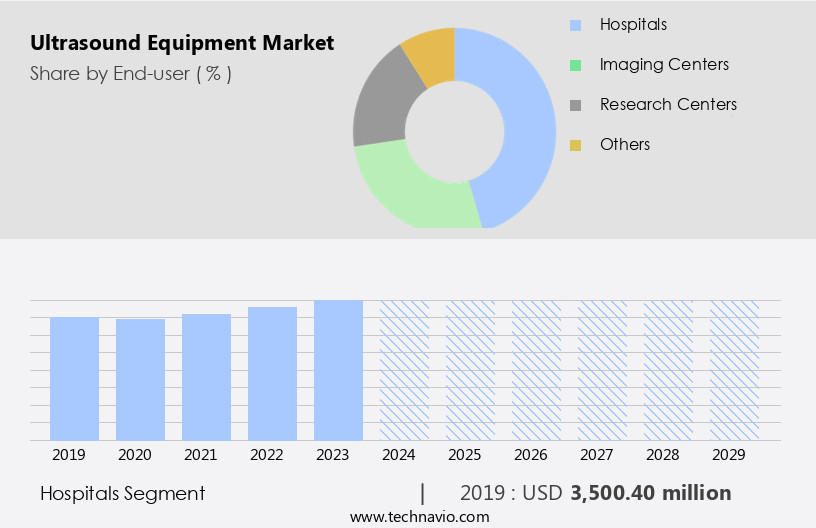
The Hospitals segment was valued at USD 3.5 billion in 2019 and showed a gradual increase during the forecast period.
Regional Analysis
North America is estimated to contribute 35% to the growth of the global market during the forecast period. Technavio's analysts have elaborately explained the regional trends and drivers that shape the market during the forecast period.
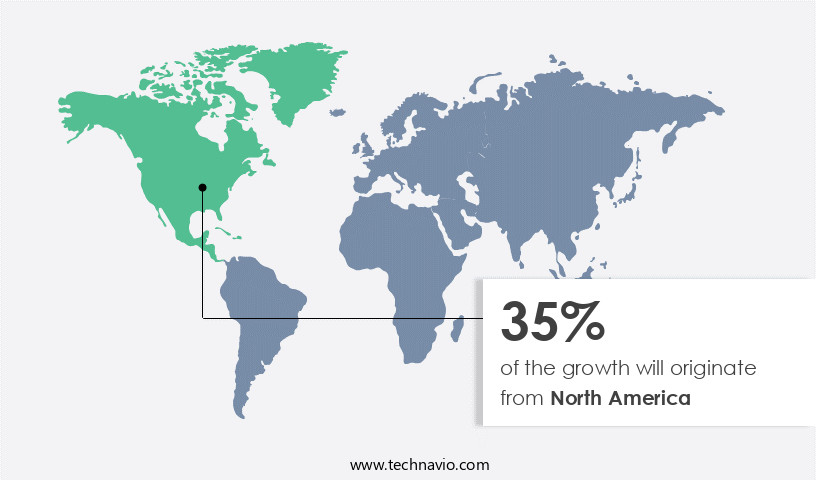
The market in North America, with a significant presence from the US, continued its growth trajectory in 2024, reaching an estimated USD2.68 billion. Portable ultrasound equipment's increasing utilization in hospitals and homecare settings fueled this expansion. Advanced ultrasound technologies, such as 3D and 4D devices, automated breast ultrasound (ABUS), Doppler, and 5D ultrasound, are driving diagnostic and therapeutic advancements. These technologies are increasingly adopted for breast cancer detection and obstetrics and gynecology applications. The American Cancer Society's emphasis on early preventive measures for breast cancer and a steady birth rate of 12.009 per 1,000 people further propel market growth.
Ultrasound guided biofeedback, osteotomy, surgery, biopsy, drainage, telehealth, injections, therapy, cryosurgery, image processing, biometrics, contrast agents, and robotics are other evolving trends in the market. Ultrasound imaging, software, and real-time signal processing technologies are essential components of these advanced applications.
Market Dynamics
Our researchers analyzed the data with 2024 as the base year, along with the key drivers, trends, and challenges. A holistic analysis of drivers will help companies refine their marketing strategies to gain a competitive advantage.
What are the key market drivers leading to the rise in the adoption of Ultrasound Equipment Industry?
- Ultrasound equipment's expanding range of applications is the primary market growth driver.
- Ultrasound technology, employing waves at various frequencies, plays a crucial role in medical imaging and diagnosis. Ultrasound equipment operates primarily at frequencies between 1-10MHz, contributing significantly to the detection and confirmation of intricate conditions, particularly in cardiology, cancer diagnosis, and obstetrics and gynecology. The global increase in birth rates and the proliferation of in-vitro fertilization methods necessitate high-resolution imaging, thereby driving the diagnostic ultrasound segment's growth. The International Agency for Research on Cancer (IARC) reported a staggering 19.3 million new cancer cases and 10 million deaths in 2020, further emphasizing the importance of early and accurate diagnosis.
- Ultrasound-guided procedures, such as biofeedback and osteotomy, expand the application spectrum of ultrasound technology, enriching the healthcare industry's diagnostic capabilities. Vascular ultrasound, another essential application, monitors blood flow and detects vascular diseases, contributing to the overall market expansion.
What are the market trends shaping the Ultrasound Equipment Industry?
- Artificial Intelligence (AI) integration is becoming a significant trend in the ultrasound market. Ultrasound technology is increasingly being enhanced with AI capabilities to improve diagnostic accuracy and efficiency.
- The market is witnessing significant advancements with the integration of Artificial Intelligence (AI) technology. High-end ultrasound systems, such as Philips Epiq and Affiniti, are incorporating AI to automatically identify, segment, and color code anatomy in the scanning field, enhancing workflow in breast imaging. This technology offers visual mapping and annotation of the screened anatomy with minimal user interaction. Furthermore, Konica Minolta's latest Sonimage HS1 version utilizes AI-voice recognition controls for hands-free operation. The adoption of AI in ultrasound equipment is revolutionizing diagnostic accuracy and efficiency, making it an essential tool in various medical applications, including ultrasound guided biopsy, ultrasound guided surgery, ultrasound imaging, ultrasound biopsy, and ultrasound guided drainage.
- Additionally, ultrasound guided telehealth is gaining popularity, enabling remote diagnosis and consultation, thereby expanding the market's reach and accessibility.
What challenges does the Ultrasound Equipment Industry face during its growth?
- In developed markets, the industry faces a significant challenge due to market saturation, which negatively impacts growth.
- The market in developed regions, including the US, has reached maturity, leading to increased competition among existing companies. This saturation has made it challenging for new entrants to establish a foothold in these markets. The ultrasound industry in developed countries, including the US, Europe, and Japan, has been impacted by the uncertainty surrounding healthcare reforms and reduced reimbursements for medical devices. The economic downturn in these regions, including Europe, Japan, and the US, has further dampened demand for exports. Advancements in ultrasound technology, such as 4D ultrasound, 3D ultrasound, ultrasound-guided robotics, ultrasound-guided telemedicine, ultrasound-guided injections, ultrasound therapy, and ultrasound-guided cryosurgery, continue to drive market growth.
- These innovations offer enhanced diagnostic capabilities, improved patient outcomes, and increased efficiency, making ultrasound an essential tool in modern healthcare. Despite the challenges, the market remains a significant and dynamic industry, with ongoing research and development efforts aimed at addressing the evolving needs of healthcare providers and patients.
Exclusive Customer Landscape
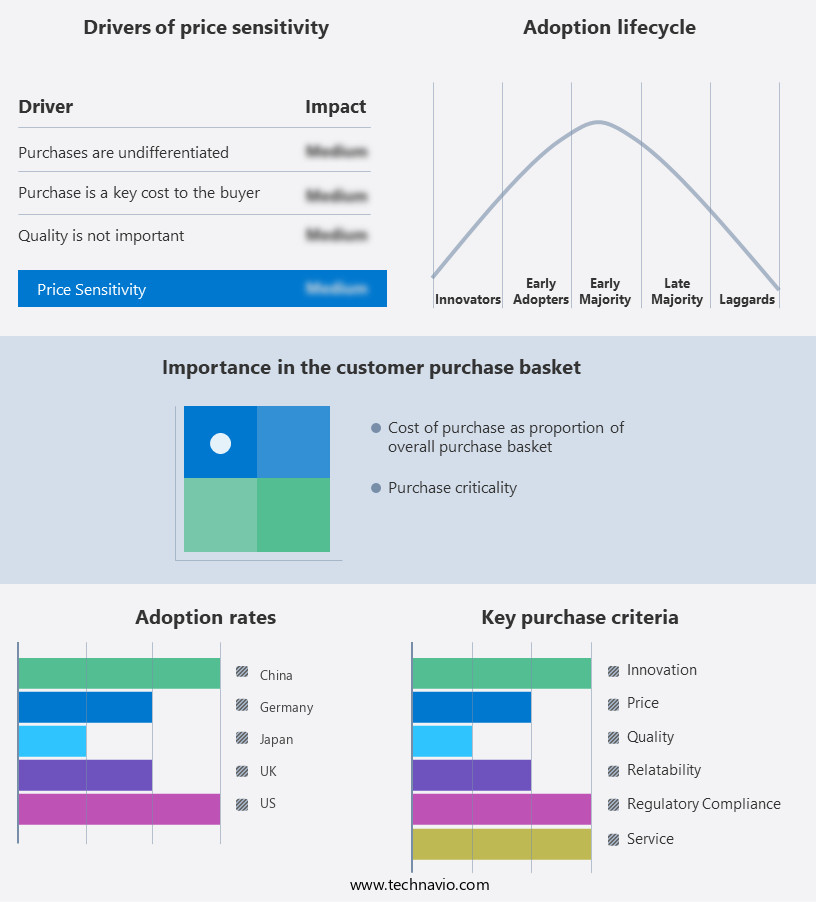
The ultrasound equipment market forecasting report includes the adoption lifecycle of the market, covering from the innovator's stage to the laggard's stage. It focuses on adoption rates in different regions based on penetration. Furthermore, the ultrasound equipment market report also includes key purchase criteria and drivers of price sensitivity to help companies evaluate and develop their market growth analysis strategies.
Customer Landscape
Key Companies & Market Insights
Companies are implementing various strategies, such as strategic alliances, ultrasound equipment market forecast, partnerships, mergers and acquisitions, geographical expansion, and product/service launches, to enhance their presence in the industry.
Boston Scientific Corp. - The company specializes in providing advanced ultrasound equipment, including the iLab ultrasound imaging system.
The industry research and growth report includes detailed analyses of the competitive landscape of the market and information about key companies, including:
- Boston Scientific Corp.
- Canon Inc.
- Carestream Health Inc.
- Chison Medical Technologies Co. Ltd.
- ContextVision AB
- Esaote Spa
- FUJIFILM Corp.
- GE Healthcare Technologies Inc.
- GlobalMedia Group LLC
- Healcerion Co. Ltd.
- Hitachi Ltd.
- Hologic Inc.
- Iljin Co. Ltd.
- Konica Minolta Inc.
- Koninklijke Philips NV
- Samsung Electronics Co. Ltd.
- Shenzhen Bestman Instrument Co. Ltd.
- Shenzhen Mindray BioMedical Electronics Co. Ltd
- Siemens Healthineers AG
- SonoScape Medical Corp.
- Sonostar
- Telemed Ultrasound
Qualitative and quantitative analysis of companies has been conducted to help clients understand the wider business environment as well as the strengths and weaknesses of key industry players. Data is qualitatively analyzed to categorize companies as pure play, category-focused, industry-focused, and diversified; it is quantitatively analyzed to categorize companies as dominant, leading, strong, tentative, and weak.
Recent Development and News in Ultrasound Equipment Market
- In March 2024, GE Healthcare launched its new Voluson E10 ultrasound system, featuring advanced imaging capabilities and AI-driven technologies to enhance diagnostic accuracy and efficiency (GE Healthcare Press Release).
- In June 2024, Philips and Microsoft announced a strategic partnership to develop and integrate AI solutions into Philips' ultrasound systems, aiming to improve diagnostic precision and patient care (Microsoft News Center).
- In November 2024, Siemens Healthineers completed the acquisition of Varian Medical Systems, expanding its portfolio to include radiation therapy systems and strengthening its position in the healthcare technology market (Siemens Healthineers Press Release).
- In February 2025, the US Food and Drug Administration (FDA) cleared Fujifilm's new portable ultrasound system, the Sonosite Edge II, enabling point-of-care ultrasound examinations in various clinical settings (Fujifilm Sonosite Press Release).
Research Analyst Overview
- The market encompasses various applications, including ophthalmology, dermatology, orthopedics, neurology, rehabilitation, oncology, pediatrics, urology, rheumatology, cardiology, gynecology, education, dentistry, and more. Handheld and portable ultrasound devices have gained popularity in point-of-care settings, enabling real-time diagnosis and treatment decisions. In ophthalmology, ultrasound plays a crucial role in diagnosing retinal detachments and other eye conditions. Dermatologists use ultrasound for diagnosing and monitoring skin lesions, while orthopedic specialists rely on it for imaging bones and soft tissues. Neurologists employ ultrasound in neurology for assessing brain structures and diagnosing conditions like multiple sclerosis. Ultrasound in oncology aids in tumor characterization and monitoring treatment response.
- Pediatricians utilize ultrasound in pediatrics for diagnosing congenital anomalies and monitoring growth. In research, ultrasound is a valuable tool for studying biological processes and developing new technologies. Wireless and point-of-care ultrasound systems are transforming healthcare by enabling quick and convenient diagnosis, especially in remote locations. Ultrasound in urology is essential for diagnosing and monitoring kidney and urinary tract diseases. In rheumatology, ultrasound helps in diagnosing inflammatory conditions and assessing treatment response. Ultrasound in cardiology plays a pivotal role in diagnosing and managing heart diseases. In gynecology, ultrasound is used for diagnosing and monitoring various gynecological conditions. In education, ultrasound is an essential tool for training medical students and professionals.
- In dentistry, ultrasound is used for various diagnostic and therapeutic applications, including root canal therapy and periodontal treatments. The versatility and accessibility of ultrasound equipment continue to drive its adoption across various medical specialties and settings.
Dive into Technavio's robust research methodology, blending expert interviews, extensive data synthesis, and validated models for unparalleled Ultrasound Equipment Market insights. See full methodology.
|
Market Scope |
|
|
Report Coverage |
Details |
|
Page number |
203 |
|
Base year |
2024 |
|
Historic period |
2019-2023 |
|
Forecast period |
2025-2029 |
|
Growth momentum & CAGR |
Accelerate at a CAGR of 6.5% |
|
Market growth 2025-2029 |
USD 3269.6 million |
|
Market structure |
Fragmented |
|
YoY growth 2024-2025(%) |
6.0 |
|
Key countries |
US, Canada, Germany, China, UK, Japan, India, France, South Korea, Italy, Brazil, and UAE |
|
Competitive landscape |
Leading Companies, Market Positioning of Companies, Competitive Strategies, and Industry Risks |
What are the Key Data Covered in this Ultrasound Equipment Market Research and Growth Report?
- CAGR of the Ultrasound Equipment industry during the forecast period
- Detailed information on factors that will drive the growth and forecasting between 2025 and 2029
- Precise estimation of the size of the market and its contribution of the industry in focus to the parent market
- Accurate predictions about upcoming growth and trends and changes in consumer behaviour
- Growth of the market across North America, Europe, Asia, and Rest of World (ROW)
- Thorough analysis of the market's competitive landscape and detailed information about companies
- Comprehensive analysis of factors that will challenge the ultrasound equipment market growth of industry companies
We can help! Our analysts can customize this ultrasound equipment market research report to meet your requirements.