
US Biomedical Materials Market Size 2025-2029
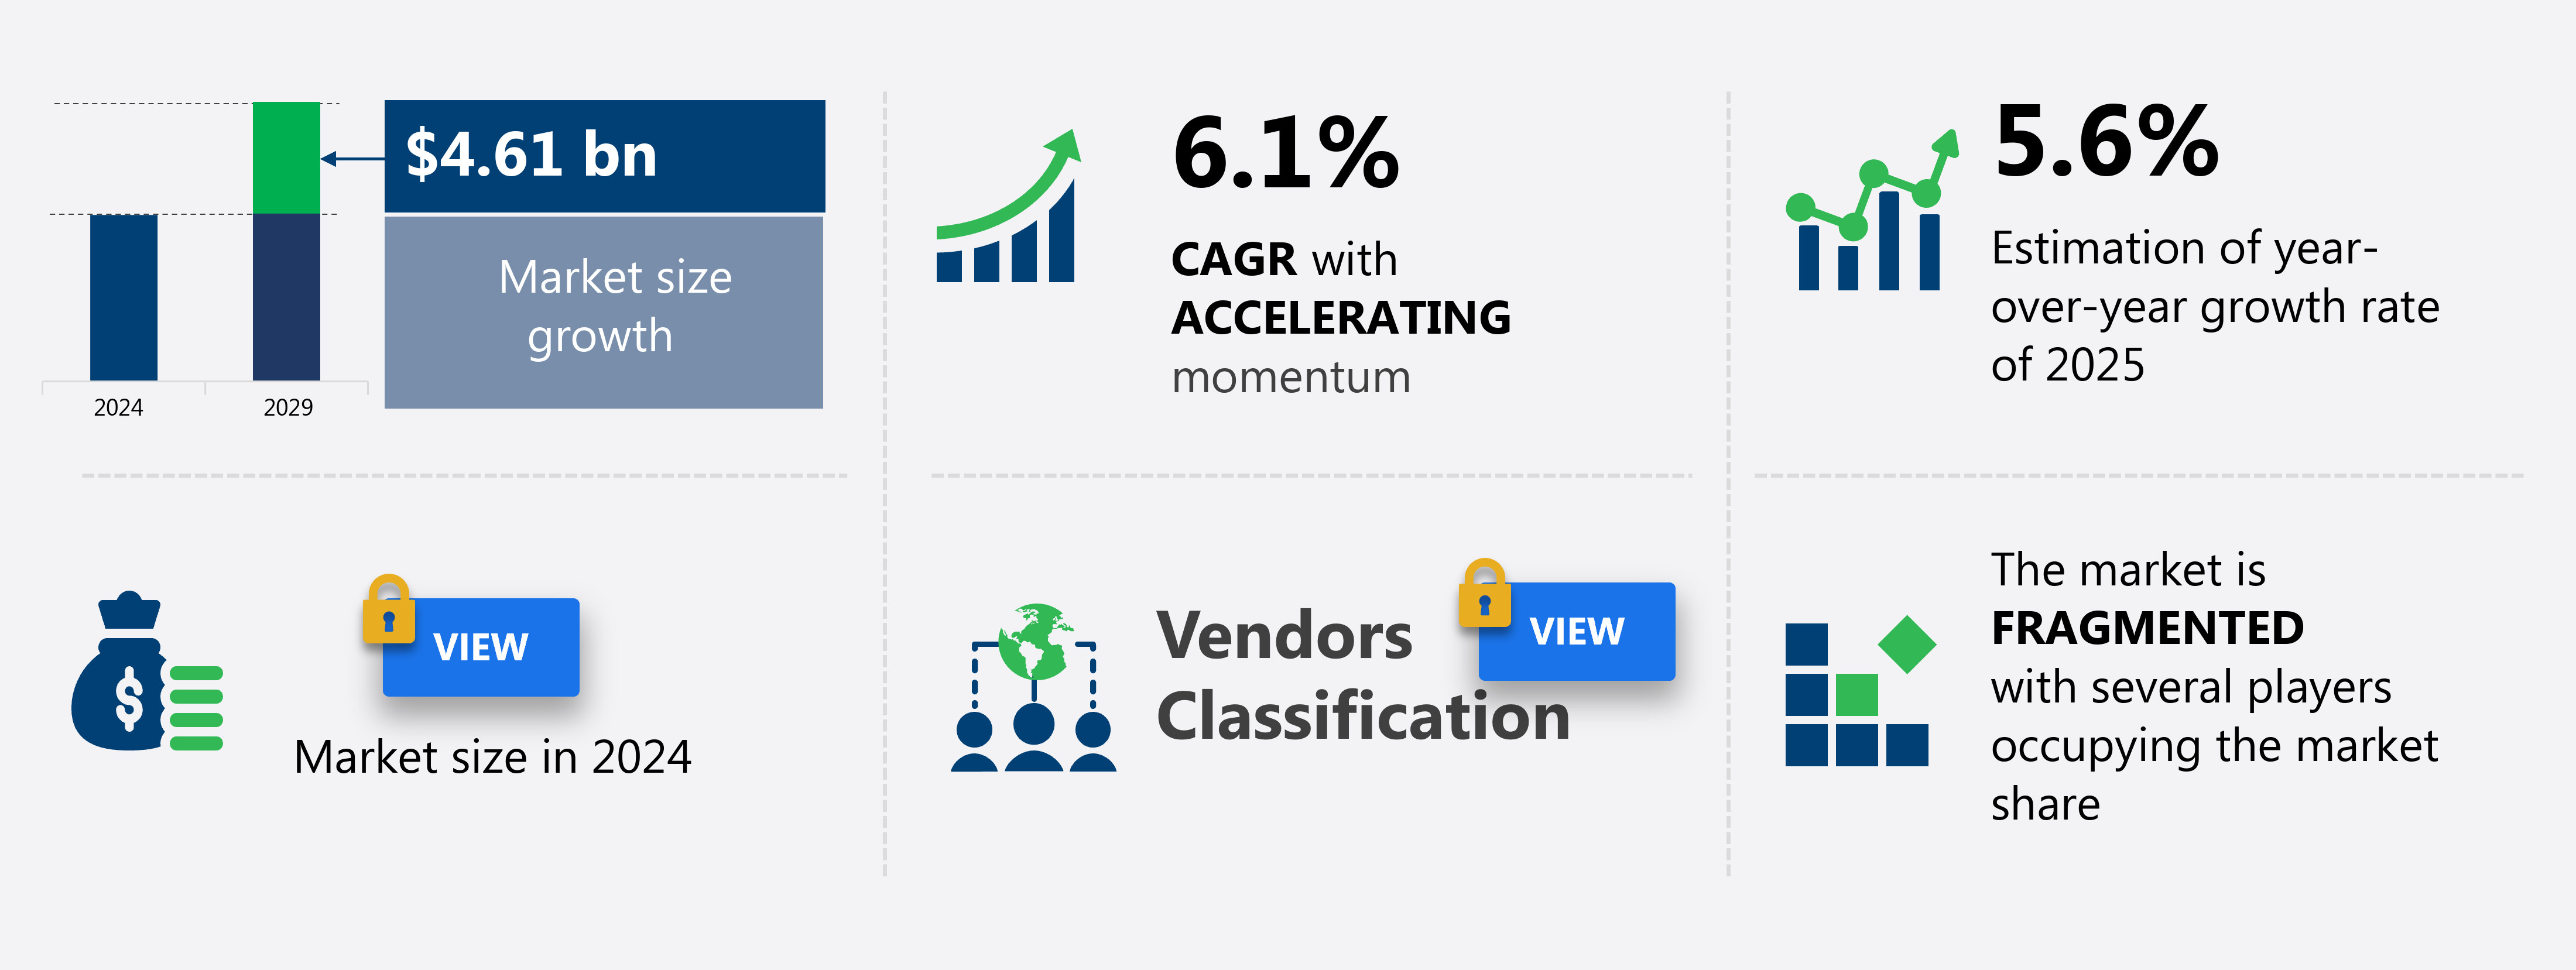
The US biomedical materials market size is forecast to increase by USD 4.61 billion at a CAGR of 6.1% between 2024 and 2029.
- The Biomedical Materials Market in the US is driven by the aging population and the adoption of 3D-printable biomaterials. The aging population is a significant growth factor, as the increasing prevalence of chronic diseases and the need for medical devices and implants to support an aging population fuel market expansion. Furthermore, the adoption of 3D-printable biomaterials is transforming the industry, enabling customized, cost-effective, and efficient production of medical devices and implants. However, the market also faces challenges, including regulatory and compliance hurdles. The stringent regulatory environment and complex compliance requirements pose significant challenges for market participants.
- Ensuring the safety and efficacy of biomedical materials while navigating the complex regulatory landscape is a critical challenge for companies seeking to capitalize on market opportunities. Effective strategies for addressing these challenges, such as investing in research and development to meet regulatory requirements and collaborating with regulatory agencies, are essential for success in the Biomedical Materials Market in the US.
What will be the size of the US Biomedical Materials Market during the forecast period?
Explore in-depth regional segment analysis with market size data - historical 2019-2023 and forecasts 2025-2029 - in the full report.
Request Free Sample
- The biomedical materials market in the US is characterized by continuous advancements in biomaterial selection, leading to the development of innovative composites that enhance material biocompatibility and durability. Inflammatory response and immune response biomaterials are gaining significance due to their potential to minimize tissue damage and improve tissue regeneration. Cost-effectiveness is a critical factor influencing market dynamics, driving research and development efforts towards biomaterials with optimal mechanical strength and stability. Biomaterial synthesis and surface functionalization techniques enable the creation of scaffolds with intricate architectures, enhancing cellular response and drug release kinetics. Mechanical testing, including fatigue testing and tensile strength analysis, is essential for ensuring biomaterial durability and regulatory compliance.
- Preclinical and clinical trials are crucial for assessing biomaterial safety and efficacy, while microstructure analysis and degradation rate studies provide valuable insights into biomaterial interactions. In-vivo studies and in-vitro testing are integral to understanding biomaterial behavior under real-life conditions, enabling the optimization of biomaterial properties for various applications. Biomaterial interactions with the immune system and tissue environment are essential considerations for ensuring optimal tissue regeneration and minimizing adverse reactions. The focus on biomaterial sustainability and biocompatibility is driving research towards eco-friendly synthesis methods and biodegradable materials. Overall, the US biomedical materials market is a dynamic and innovative space, driven by a relentless pursuit of advanced materials that address the complex needs of tissue engineering and regenerative medicine applications.
How is this market segmented?
The market research report provides comprehensive data (region-wise segment analysis), with forecasts and estimates in "USD billion" for the period 2025-2029, as well as historical data from 2019-2023 for the following segments.
- Type
- Metallic
- Polymers
- Ceramic
- Natural
- Application
- Orthopedic
- Cardiovascular
- Dental
- Neurology
- Others
- Geography
- North America
- US
- North America
By Type Insights
The metallic segment is estimated to witness significant growth during the forecast period.
The biomedical materials market in the US is characterized by the utilization of various materials to create implants, scaffolds, and other medical devices with superior mechanical properties for enhanced patient outcomes. Biomaterial design incorporates natural and synthetic materials, such as collagen scaffolds, polyglycolic acid (PGA), and polylactic acid (PLA), to facilitate cell-material interactions and tissue regeneration. Natural biomaterials, including collagen and bioactive glasses, are crucial for regenerative medicine applications, while synthetic biomaterials, such as PGA and PLAs, are employed in cardiovascular biomaterials, tissue engineering scaffolds, and drug delivery systems. Surface modification techniques, like hydroxyapatite coatings, are essential for improving biocompatibility and osseointegration in medical implants.
Biocompatible polymers and biomedical coatings play a significant role in ensuring the safety and efficacy of medical devices. Biomaterial characterization and processing techniques are continually evolving to optimize material properties and fabrication methods. In vitro cytotoxicity and in vivo biocompatibility testing are essential for evaluating the safety and suitability of biomaterials for medical applications. Biomaterials degradation and toxicity are critical concerns in the development of bioresorbable materials, such as PGA and PLAs, which are increasingly used in orthopedic biomaterials and dental biomaterials. Regulatory compliance and adherence to biomaterial regulations are essential for ensuring patient safety and market acceptance.
Drug eluting stents and bioprinting materials are emerging areas of interest in the biomedical materials market, offering potential for targeted drug delivery and personalized medicine. Biomaterial sterilization techniques ensure the sterility and safety of medical devices and implants, contributing to their overall success and patient satisfaction.
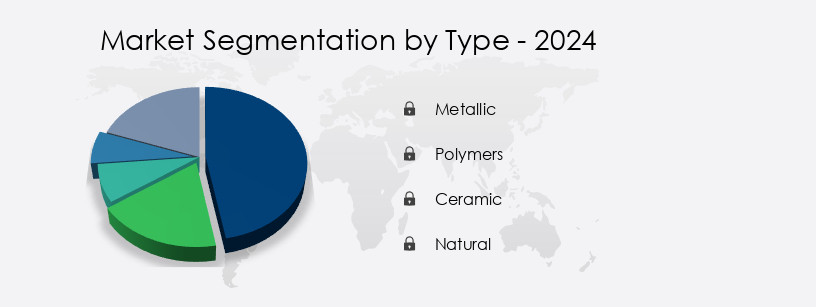
The Metallic segment was valued at USD 4.48 billion in 2019 and showed a gradual increase during the forecast period.
Market Dynamics
Our researchers analyzed the data with 2024 as the base year, along with the key drivers, trends, and challenges. A holistic analysis of drivers will help companies refine their marketing strategies to gain a competitive advantage.
What are the US Biomedical Materials Market drivers leading to the rise in adoption of the Industry?
- The aging population serves as the primary catalyst for market growth, as demographic shifts toward an older population structure significantly influence consumer behavior and demand for various goods and services.
- The US biomedical materials market experiences continuous growth due to the increasing population aging. According to the US Census Bureau, the elderly demographic, defined as individuals aged 65 years and above, has been expanding steadily. In 2023, this demographic numbered approximately 58 million, up from around 56 million in 2023. Projections suggest that by 2050, this population will reach nearly 90 million. This significant demographic shift is fueling the demand for medical devices and implants that incorporate advanced biomedical materials.
- As people age, they become more susceptible to various health issues, necessitating medical interventions involving these materials. This trend underpins the market's ongoing expansion.
What are the US Biomedical Materials Market trends shaping the Industry?
- The use of 3D-printable biomaterials is gaining significant traction in the market, representing an emerging trend. This innovative technology offers numerous advantages, particularly in the healthcare sector, where customized medical implants and scaffolds for tissue engineering can be produced with precision and efficiency.
- The biomedical materials market in the US is witnessing significant advancements, particularly in the area of 3D-printable biomaterials. Technologies like Fused Deposition Modeling (FDM) and Stereolithography (SLA) are revolutionizing the industry by enabling the creation of personalized and intricate medical devices, implants, and prosthetics. These innovations allow for the design and production of custom solutions tailored to individual patient requirements, which is essential for applications such as orthopedic implants, dental restorations, and hearing aids. Furthermore, 3D printing accelerates the prototyping process, leading to reduced lead times for medical device development and enhanced manufacturing efficiency. This trend extends to tissue engineering, where 3D-printed scaffolds facilitate tissue regeneration and cell growth.
- Biomaterial design plays a crucial role in this evolution, with a focus on optimizing mechanical properties, biocompatibility, and cell-material interactions. Polyglycolic acid (PGA) and collagen scaffolds are among the biomaterials being extensively researched for their potential in drug eluting stents and tissue engineering applications. Biomaterial characterization and processing techniques are also evolving to meet the demands of this dynamic market.
How does US Biomedical Materials Market face challenges during its growth?
- Compliance and regulatory hurdles pose significant challenges to the industry's growth trajectory, requiring continuous adaptation and adherence to evolving regulations.
- The biomedical materials market in the US is characterized by stringent regulatory requirements, which pose significant challenges for market entrants. The US Food and Drug Administration (FDA) plays a crucial role in approving biomedical materials for medical applications, requiring extensive testing to ensure safety, effectiveness, and biocompatibility. One major regulatory hurdle is the Pre-Market Approval (PMA) process for medical devices. New materials used in medical devices undergo rigorous testing, including biocompatibility assessments, toxicology studies, and clinical trials. For instance, a bioresorbable stent that dissolves over time within the body requires thorough evaluation to prevent adverse reactions such as inflammation, thrombosis, or improper degradation.
- Natural biomaterials, such as collagen and chitosan, and synthetic biomaterials, including polylactic acid (PLA), are widely used in cardiovascular biomaterials. Surface modification techniques, such as plasma treatment and hydroxyapatite coating, are employed to enhance implant osseointegration. However, biomaterial toxicity testing and degradation are critical concerns, as these factors can impact the long-term safety and efficacy of medical devices. In conclusion, the biomedical materials market in the US is subject to rigorous regulatory oversight, ensuring the safety and efficacy of medical devices. The approval process involves extensive testing, including biocompatibility assessments, toxicology studies, and clinical trials. Natural and synthetic biomaterials, such as collagen, chitosan, and polylactic acid, are used in various medical applications, while surface modification techniques are employed to enhance implant osseointegration.
- Biomaterial toxicity testing and degradation are crucial concerns, requiring ongoing research and development efforts.
Exclusive US Biomedical Materials Market Customer Landscape
The market forecasting report includes the adoption lifecycle of the market, covering from the innovator's stage to the laggard's stage. It focuses on adoption rates in different regions based on penetration. Furthermore, the report also includes key purchase criteria and drivers of price sensitivity to help companies evaluate and develop their market growth analysis strategies.

Customer Landscape
Key Companies & Market Insights
Companies are implementing various strategies, such as strategic alliances, market forecast partnerships, mergers and acquisitions, geographical expansion, and product/service launches, to enhance their presence in the market.
The market research and growth report includes detailed analyses of the competitive landscape of the market and information about key companies, including:
- 3D Systems Corp.
- Allegheny Technologies Inc.
- BASF SE
- Berkeley Advanced Biomaterials
- Biomaterial USA LLC
- Carpenter Technology Corp.
- Celanese Corp.
- ConvaTec Group Plc
- CoorsTek Inc.
- Corbion nv
- Covation Biomaterials LLC
- Covestro AG
- DSM-Firmenich AG
- Evonik Industries AG
- Hollister Inc.
- Integra LifeSciences Holdings Corp.
- KYOCERA Corp.
- Morgan Advanced Materials Plc
- Regenity
- Smith and Nephew plc
Qualitative and quantitative analysis of companies has been conducted to help clients understand the wider business environment as well as the strengths and weaknesses of key market players. Data is qualitatively analyzed to categorize companies as pure play, category-focused, industry-focused, and diversified; it is quantitatively analyzed to categorize companies as dominant, leading, strong, tentative, and weak.
Recent Development and News in Biomedical Materials Market In US
- In January 2024, in a significant strategic collaboration, Stryker Corporation and Carbon3D announced a partnership to develop and commercialize 3D-printed implants using Carbon3D's Digital Light Synthesis technology (Bloomberg). This collaboration aimed to revolutionize the production process of implants, offering customized solutions with improved properties and faster turnaround times.
- In March 2024, the US Food and Drug Administration (FDA) granted approval to Medtronic plc for its Infuse IQ Total Ankle System, a 3D-printed, porous titanium implant designed for total ankle replacement procedures (Medtronic Press Release). This approval marked a milestone in the adoption of 3D-printed implants in orthopedic surgeries.
- In May 2024, Tissue Regenix Group plc raised £ 35 million (USD 46 million) in a funding round, led by Woodford Investment Management, to support the commercialization of its Decel Gel and other regenerative medicine products in the US market (Tissue Regenix Press Release). This investment will accelerate the company's growth and expand its market presence.
- In April 2025, the US National Institutes of Health (NIH) announced a five-year, USD 125 million initiative to develop and commercialize advanced biomaterials for tissue engineering and regenerative medicine applications (NIH Press Release). This initiative will foster collaborations between academia, industry, and the FDA, aiming to bring innovative biomaterials to the market and advance the field of regenerative medicine.
Research Analyst Overview
The biomedical materials market in the US continues to evolve, driven by advancements in technology and research. Natural biomaterials, such as collagen and polysaccharides, are increasingly being used in tissue engineering scaffolds and regenerative medicine applications due to their ability to mimic the natural extracellular matrix. Cardiovascular biomaterials, including synthetic polymers like polyglycolic acid (PGA) and polylactic acid (PLA), are utilized in the development of drug eluting stents and vascular grafts. Surface modification techniques, such as hydroxyapatite coatings and bioactive glasses, enhance the biocompatibility and osseointegration of medical implants. Synthetic biomaterials, including biocompatible polymers and biomedical coatings, are also gaining popularity due to their tunable properties and versatility.
Biomaterial characterization and processing techniques play a crucial role in optimizing the mechanical properties and ensuring the safety and efficacy of these materials. Biomaterial toxicity testing and biomaterial degradation studies are essential components of the development process, ensuring the long-term safety and effectiveness of these materials. In vitro cytotoxicity and in vivo biocompatibility testing are critical steps in evaluating the safety of biomaterials for various applications. Regulations governing the use of biomaterials are continually evolving, with a focus on ensuring the safety and efficacy of these materials for clinical use. Biomaterials are also finding applications in wound healing materials, dental biomaterials, and bioresorbable materials for orthopedic applications.
The ongoing research and development in this field are expected to drive the growth of the biomedical materials market in the US, with new applications and innovations continually emerging.
Dive into Technavio's robust research methodology, blending expert interviews, extensive data synthesis, and validated models for unparalleled Biomedical Materials Market in US insights. See full methodology.
|
Market Scope |
|
|
Report Coverage |
Details |
|
Page number |
170 |
|
Base year |
2024 |
|
Historic period |
2019-2023 |
|
Forecast period |
2025-2029 |
|
Growth momentum & CAGR |
Accelerate at a CAGR of 6.1% |
|
Market growth 2025-2029 |
USD 4.61 billion |
|
Market structure |
Fragmented |
|
YoY growth 2024-2025(%) |
5.6 |
|
Competitive landscape |
Leading Companies, Market Positioning of Companies, Competitive Strategies, and Industry Risks |
What are the Key Data Covered in this Market Research Report?
- CAGR of the market during the forecast period
- Detailed information on factors that will drive the market growth and forecasting between 2025 and 2029
- Precise estimation of the size of the market and its contribution of the market in focus to the parent market
- Accurate predictions about upcoming market growth and trends and changes in consumer behaviour
- Growth of the market across US
- Thorough analysis of the market's competitive landscape and detailed information about companies
- Comprehensive analysis of factors that will challenge the growth of market companies
We can help! Our analysts can customize this market research report to meet your requirements Get in touch