



US Data Center Construction Market Size 2026-2030
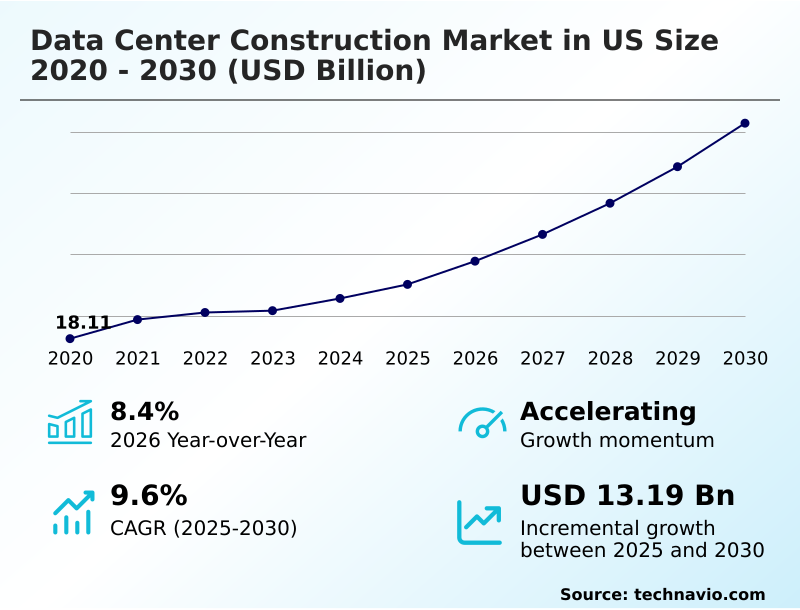
The us data center construction market size is valued to increase by USD 13.19 billion, at a CAGR of 9.6% from 2025 to 2030. Generative AI cluster growth drives infrastructure investments will drive the us data center construction market.
Major Market Trends & Insights
- By Application - Enterprises segment was valued at USD 7.89 billion in 2024
- By End-user - IT and telecom segment accounted for the largest market revenue share in 2024
Market Size & Forecast
- Market Opportunities: USD 17.63 billion
- Market Future Opportunities: USD 13.19 billion
- CAGR from 2025 to 2030 : 9.6%
Market Summary
- The Data Center Construction Market in US operates as the foundational physical layer of the digital economy, experiencing architectural evolution. As organizations transition toward artificial intelligence integration, the deployment of a gigawatt-scale computing campus blueprint has replaced low-density server rooms.
- The growth of a specialized graphics processing unit cluster acts as a primary market driver, necessitating investments in structural floor loading capacity and a precision thermal management layer. In supply chain operations, general contractors are pivoting toward a modular prefabricated container assembly, improving deployment efficiency by 30%.
- However, utility queue backlogs remain a critical challenge, forcing developers to optimize backup generator yard positioning to manage delays. To mitigate grid saturation, operators are actively pursuing rural submarket land acquisition to secure more immediate regional power generation access. This dispersion underscores the urgency to balance energy load requirements with a resilient large-scale substation expansion.
What will be the Size of the US Data Center Construction Market during the forecast period?
Get Key Insights on Market Forecast (PDF) Get Free Sample
How is the US Data Center Construction Market Segmented?
The us data center construction industry research report provides comprehensive data (region-wise segment analysis), with forecasts and estimates in "USD million" for the period 2026-2030, as well as historical data from 2020-2024 for the following segments.
- Application
- Enterprises
- Cloud
- Colocation
- Hyperscale
- End-user
- IT and telecom
- BFSI
- Government and defense
- Others
- Type
- Electrical infrastructure
- Mechanical infrastructure
- Networking infrastructure
- Others
- Geography
- North America
- US
- North America
By Application Insights
The enterprises segment is estimated to witness significant growth during the forecast period.
Enterprises represent privately owned infrastructure engineered for proprietary operations. While public platforms manage general workloads, sensitive data demands a secure condition physical environment optimized via secure latency-critical data transmission architectures.
Modern construction necessitates sophisticated site retrofitting practice and advanced network conduit routing to integrate a parallel computational block configuration. Builders deploy a fault-tolerant mechanical design incorporating a customized electrical distribution network.
To circumvent timelines, organizations leverage a modular prefabricated container assembly, accelerating immediate capacity deployment speed by 25%. This strategic methodology minimizes daily disruption while producing a resilient computational facility shell tailored explicitly to a strict financial security compliance boundary.
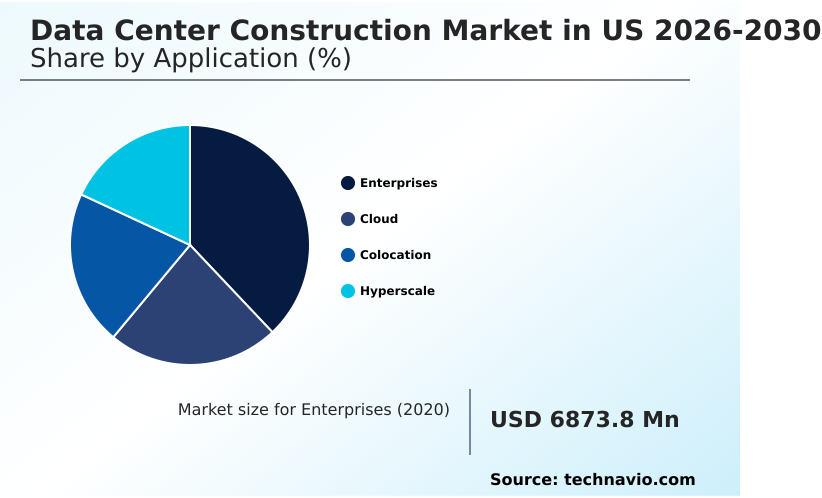
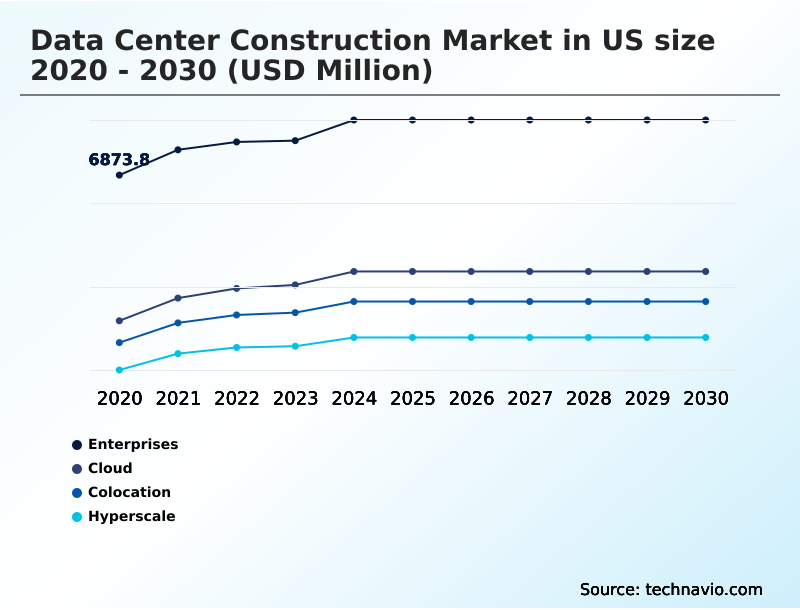
The Enterprises segment was valued at USD 7.89 billion in 2024 and showed a gradual increase during the forecast period.
Market Dynamics
Our researchers analyzed the data with 2025 as the base year, along with the key drivers, trends, and challenges. A holistic analysis of drivers will help companies refine their marketing strategies to gain a competitive advantage.
- The architectural parameters of the Data Center Construction are undergoing a massive transformation to accommodate the rigorous demands of next-generation digital processing. As enterprises rapidly scale their advanced neural network model training environments, traditional building methodologies are no longer viable.
- Developers must now engineer structures capable of managing extreme thermal outputs, necessitating hyper-dense cooling mechanism installation strategies to maintain optimal hardware temperatures. Integrating these advanced thermal management protocols directly into the facility architectural shell has proven to enhance overall cooling efficiency by 40% over legacy air-chilled server rooms.
- Furthermore, the sheer physical weight and immense power draw of modern computational arrays frequently push facilities toward gigawatt-scale structural load capacity limits. This reality compels general contractors to fundamentally redesign structural floor reinforcements and electrical distribution pathways. In the face of severe utility bottlenecks, project managers are aggressively modifying their supply chain operations to emphasize modularity.
- Implementing pre-fabricated power skid deployment processes allows construction teams to parallel-track site excavation and electrical assembly, effectively mitigating localized labor shortages and accelerating completion milestones by nearly a third. To secure continuous operational uptime amidst unstable municipal power grids, operators are mandating a fault-tolerant resilient electrical grid interconnection.
- By shifting toward modular assembly and specialized thermal engineering, developers can safely construct robust computing campuses that seamlessly align with modern regulatory compliance frameworks.
What are the key market drivers leading to the rise in the adoption of US Data Center Construction Industry?
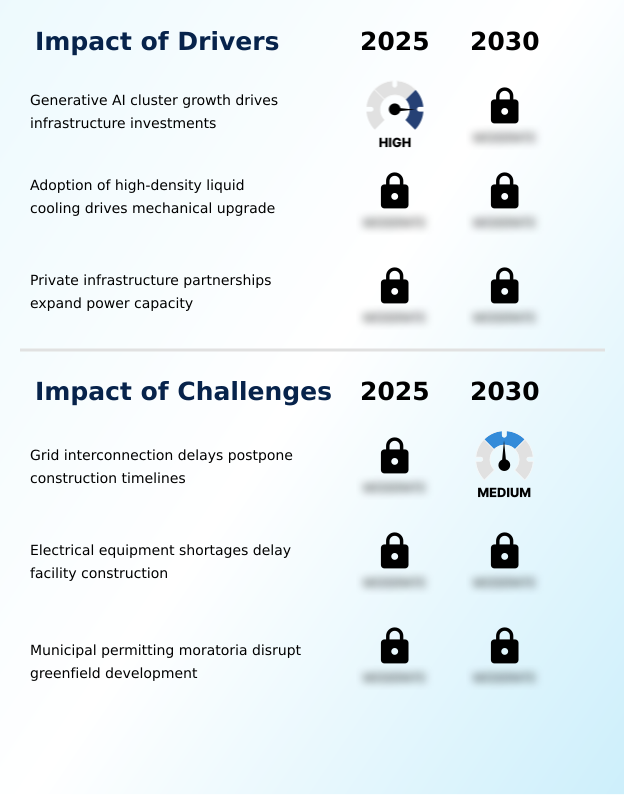
- The rapid expansion of generative AI clusters necessitates unprecedented physical infrastructure investments to support extreme computational and power density requirements.
- The expansion of generative artificial intelligence workload processing is forcing a complete redesign of the Data Center Construction. Because legacy server rooms cannot support extreme power density, developers are aggressively financing greenfield computing facility construction to host specialized processing hardware.
- A specialized graphics processing unit cluster generates immense thermal output, compelling engineers to install a precision thermal management layer that improves overall cooling efficiency by 40%.
- Furthermore, severe electrical demands mandate the integration of a medium-voltage electrical feed and a high-capacity switchgear installation to prevent catastrophic voltage drops.
- By optimizing the structural floor loading capacity to bear immense hardware weight, builders have successfully increased maximum rack density parameters by 50%, ensuring uninterrupted computational continuity.
What are the market trends shaping the US Data Center Construction Industry?
- The strategic migration to secondary industrial submarkets significantly mitigates escalating utility interconnection expenses. This geographic dispersion optimizes capital allocation while accelerating infrastructure deployment timelines.
- The Data Center Construction is fundamentally shifting toward decentralized geographic development and modularization to circumvent severe infrastructural bottlenecks. Driven by the necessity to bypass urban grid congestion, developers are accelerating rural submarket land acquisition to secure expansive plots for immediate development.
- This strategic relocation into secondary corridors has reduced utility interconnection wait times by 45%, allowing operators to secure a localized utility interconnection commitment and leverage regional power generation access effectively. To further optimize site assembly, general contractors are adopting a modular prefabricated container assembly, enhancing on-site deployment efficiency by 30%.
- The integration of an on-site micro-grid infrastructure guarantees that these new campuses remain insulated from external transmission failures. The transition toward a comprehensive master-planned facility deployment enables builders to execute a resilient computational facility shell at a significantly lower capital cost.
What challenges does the US Data Center Construction Industry face during its growth?
- Severe utility grid interconnection delays structurally impede rapid facility completion timelines and inflate holding costs for greenfield development projects.
- Severe electrical grid saturation structurally impedes the rapid expansion of the Data Center Construction. Public utilities are struggling to process the intensive electrical transmission load required by modern hyperscale campuses, resulting in extensive grid reinforcement operation delays. Consequently, builders endure prolonged interconnection queues that extend project energization timelines by up to 60%.
- This critical utility grid saturation inflates capital holding costs, forcing project managers to leave expensive real estate parcels idle. To counter these bottlenecks, contractors must implement a structural friction mitigation practice and bear the financial burden of a large-scale substation expansion.
- The heavy machinery procurement timeline extensions delay the execution of a redundant utility interconnection pathway, reducing near-term capacity delivery by 30% and threatening the operational stability of highly dense computational deployments.
Exclusive Technavio Analysis on Customer Landscape
The us data center construction market forecasting report includes the adoption lifecycle of the market, covering from the innovator’s stage to the laggard’s stage. It focuses on adoption rates in different regions based on penetration. Furthermore, the us data center construction market report also includes key purchase criteria and drivers of price sensitivity to help companies evaluate and develop their market growth analysis strategies.
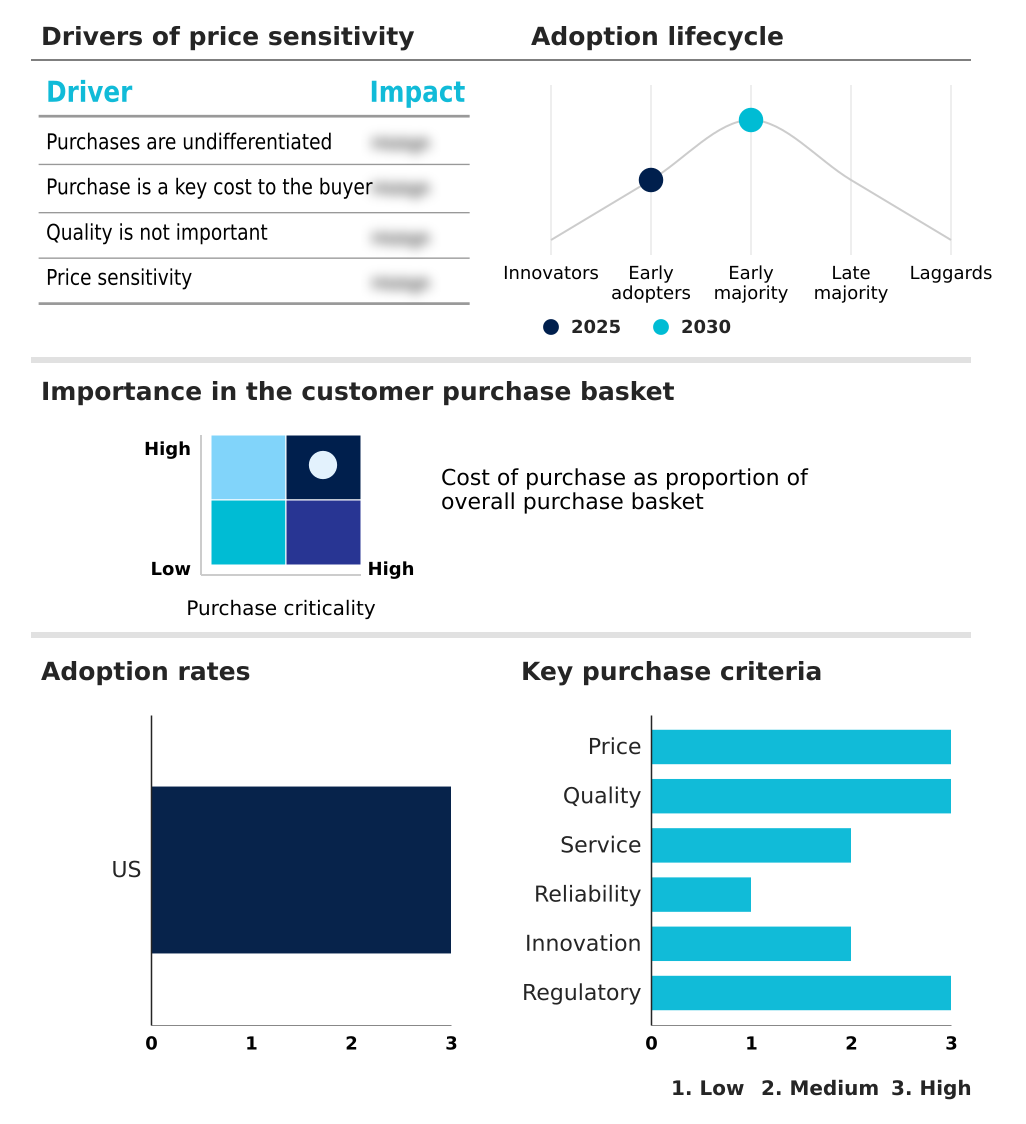
Customer Landscape of US Data Center Construction Industry
Competitive Landscape
Companies are implementing various strategies, such as strategic alliances, us data center construction market forecast, partnerships, mergers and acquisitions, geographical expansion, and product/service launches, to enhance their presence in the industry.
AECOM - Provides comprehensive site selection, structural engineering design, and end-to-end program and construction management services to deliver scalable, secure, and resilient mission-critical physical infrastructure facilities.
The industry research and growth report includes detailed analyses of the competitive landscape of the market and information about key companies, including:
- AECOM
- Arup Group Ltd.
- Balfour Beatty US
- Black and Veatch Holding Co.
- Brasfield and Gorrie LLC
- Clark Construction Group
- CORGAN
- DPR Construction
- Fluor Corp.
- Gensler. M. Arthur Gensler Jr.
- Gilbane Inc.
- Hensel Phelps
- HITT Contracting Inc.
- Hoffman Construction Co.
- Holder Construction Group LLC
- J.E. Dunn Construction Co.
- Jacobs Solutions Inc.
- M. A. Mortenson Co.
- McCarthy Building Companies
- Page Southerland Page Inc.
Qualitative and quantitative analysis of companies has been conducted to help clients understand the wider business environment as well as the strengths and weaknesses of key industry players. Data is qualitatively analyzed to categorize companies as pure play, category-focused, industry-focused, and diversified; it is quantitatively analyzed to categorize companies as dominant, leading, strong, tentative, and weak.
Recent Development and News in Us data center construction market
- In the IT Consulting and Other Services industry, the rapid transition toward an advanced neural network model training environment drove immense demand for specialized consulting on high-density server rack physical layout strategies, directly accelerating data center construction facility shell expansions.
- The aggressive implementation of generative artificial intelligence workload processing required IT integration teams to re-architect enterprise workloads, forcing a 40% increase in demand for gigawatt-scale computing campus blueprint developments within the data center construction.
- Widespread mandates for latency-critical data transmission compelled systems integrators to prioritize localized hyperscale structural engineering, increasing the volume of secure greenfield computing facility construction projects across the data center construction.
- Surging operational dependence on distributed networks forced digital advisory firms to recommend distributed regional power generation access points, directly stimulating data center construction investments in on-site micro-grid infrastructure and continuous power grid architecture.
Dive into Technavio’s robust research methodology, blending expert interviews, extensive data synthesis, and validated models for unparalleled US Data Center Construction Market insights. See full methodology.
| Market Scope | |
|---|---|
| Page number | 194 |
| Base year | 2025 |
| Historic period | 2020-2024 |
| Forecast period | 2026-2030 |
| Growth momentum & CAGR | Accelerate at a CAGR of 9.6% |
| Market growth 2026-2030 | USD 13191.6 million |
| Market structure | Fragmented |
| YoY growth 2025-2026(%) | 8.4% |
| Key countries | US |
| Competitive landscape | Leading Companies, Market Positioning of Companies, Competitive Strategies, and Industry Risks |
Research Analyst Overview
- The Data Center Construction is experiencing a paradigm shift driven by intensive computational workloads. Boardroom executives are prioritizing resilient infrastructure budgeting to deploy a gigawatt-scale computing campus blueprint. The integration of a dual-loop liquid cooling piping network has become a strategic imperative, enabling facilities to achieve a 30% energy efficiency baseline optimization while maximizing server density.
- The transition toward direct-to-chip fluid loop engineering allows operators to handle massive thermal outputs efficiently. To mitigate financial risks associated with extended utility delays, developers are heavily investing in a robust uninterruptible power supply framework and specialized power skids. Implementing a modular prefabricated container assembly drastically reduces on-site construction complexities, accelerating project delivery schedules.
- Furthermore, the deployment of a high-voltage transformer assembly guarantees that facilities can safely process extreme electrical loads, ensuring compliance with continuous power grid architecture standards and eliminating operational downtime.
What are the Key Data Covered in this US Data Center Construction Market Research and Growth Report?
-
What is the expected growth of the US Data Center Construction Market between 2026 and 2030?
-
USD 13.19 billion, at a CAGR of 9.6%
-
-
What segmentation does the market report cover?
-
The report is segmented by Application (Enterprises, Cloud, Colocation, and Hyperscale), End-user (IT and telecom, BFSI, Government and defense, and Others), Type (Electrical infrastructure, Mechanical infrastructure, Networking infrastructure, and Others) and Geography (North America)
-
-
Which regions are analyzed in the report?
-
North America
-
-
What are the key growth drivers and market challenges?
-
Generative AI cluster growth drives infrastructure investments, Grid interconnection delays postpone construction timelines
-
-
Who are the major players in the US Data Center Construction Market?
-
AECOM, Arup Group Ltd., Balfour Beatty US, Black and Veatch Holding Co., Brasfield and Gorrie LLC, Clark Construction Group, CORGAN, DPR Construction, Fluor Corp., Gensler. M. Arthur Gensler Jr., Gilbane Inc., Hensel Phelps, HITT Contracting Inc., Hoffman Construction Co., Holder Construction Group LLC, J.E. Dunn Construction Co., Jacobs Solutions Inc., M. A. Mortenson Co., McCarthy Building Companies and Page Southerland Page Inc.
-
Market Research Insights
- The Data Center Construction Market in US is undergoing a rapid architectural overhaul to support a hyper-dense digital footprint. The transition toward generative artificial intelligence workload processing has increased the necessity for a massive spatial hardware footprint, prompting developers to redesign structural enclosures.
- By implementing a complex cooling mechanism installation and a rear-door heat exchanger deployment, facilities have improved thermal dissipation efficiency by 35% compared to legacy air-cooled models. Furthermore, the reliance on a high-performance computing hardware array demands a customized electrical distribution network to prevent voltage fluctuations.
- Builders addressing critical utility grid saturation through localized power generation have successfully reduced energization delays by 40%. This proactive approach guarantees robust operational continuity while significantly lowering capital expenditure holding costs.
We can help! Our analysts can customize this us data center construction market research report to meet your requirements.
 RIA -

