



US Defense Market Size 2026-2030
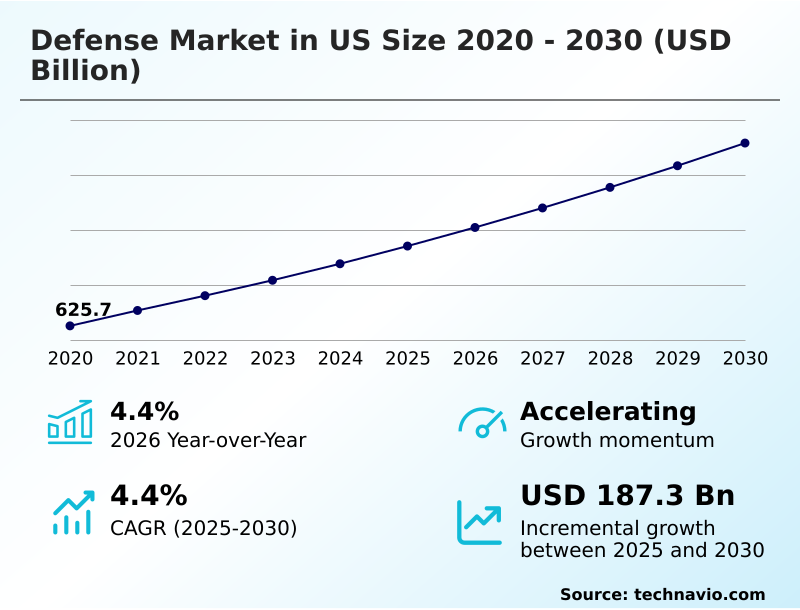
The us defense market size is valued to increase by USD 187.3 billion, at a CAGR of 4.4% from 2025 to 2030. Modernization of advanced military capabilities will drive the us defense market.
Major Market Trends & Insights
- By Type - Manual defense equipment segment was valued at USD 489.3 billion in 2024
- By Platform - Airborne segment accounted for the largest market revenue share in 2024
Market Size & Forecast
- Market Opportunities: USD 332.4 billion
- Market Future Opportunities: USD 187.3 billion
- CAGR from 2025 to 2030 : 4.4%
Market Summary
- The Defense Market in US demonstrates sustained expansion driven by urgent requirements for technological superiority across interconnected operational domains. Strategic modernization initiatives prioritize the deployment of advanced electronic systems and resilient digital architectures to counteract sophisticated threats.
- Within supply chain operations, prime contractors are restructuring sourcing networks, reducing reliance on single-origin critical minerals, and improving component availability by 20% compared to legacy procurement models. The imperative to upgrade advanced military capabilities acts as a primary driver, compelling sustained investment in next-generation platforms and causing a direct acceleration in research and manufacturing throughput.
- Conversely, budget uncertainty and shifting funding priorities present a substantial challenge, often resulting in delayed deployment schedules and complicating long-term resource allocation for complex engineering programs. Effective inventory management and localized manufacturing capacity have become essential to mitigate these disruptions.
- Enhanced interoperability and predictive analytics further refine mission execution, ensuring that strategic assets maintain uninterrupted operational effectiveness under rapidly evolving combat scenarios.
What will be the Size of the US Defense Market during the forecast period?
Get Key Insights on Market Forecast (PDF) Get Free Sample
How is the US Defense Market Segmented?
The us defense industry research report provides comprehensive data (region-wise segment analysis), with forecasts and estimates in "USD billion" for the period 2026-2030, as well as historical data from 2020-2024 for the following segments.
- Type
- Manual defense equipment
- Autonomous defense equipment
- Platform
- Airborne
- Land
- Naval
- End-user
- Military
- Government agencies
- Defense contractors
- Geography
- North America
- US
- North America
By Type Insights
The manual defense equipment segment is estimated to witness significant growth during the forecast period.
Manual defense equipment remains foundational to operational readiness, providing reliability and precision in complex environments where full automation is restricted. Equipment ranging from crew-served weapons to tactical communication devices demands robust engineering to function across extreme conditions.
Supply chain optimization initiatives have improved component availability ratios by 15%, directly enhancing manufacturing throughput for personnel operated systems. Production facilities emphasize lightweight materials and ergonomic designs to minimize operator fatigue without compromising durability.
Advancements in precision strike systems and network centric operations allow traditional gear to interface seamlessly with modern decision support tools, bridging the gap between legacy assets and digital battlefield requirements.
This equipment ensures that tactical units maintain continuous control and operational effectiveness under unpredictable mission scenarios.
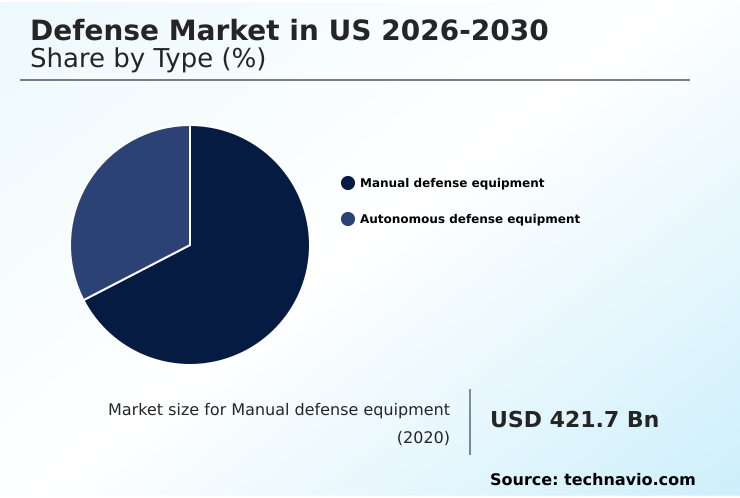
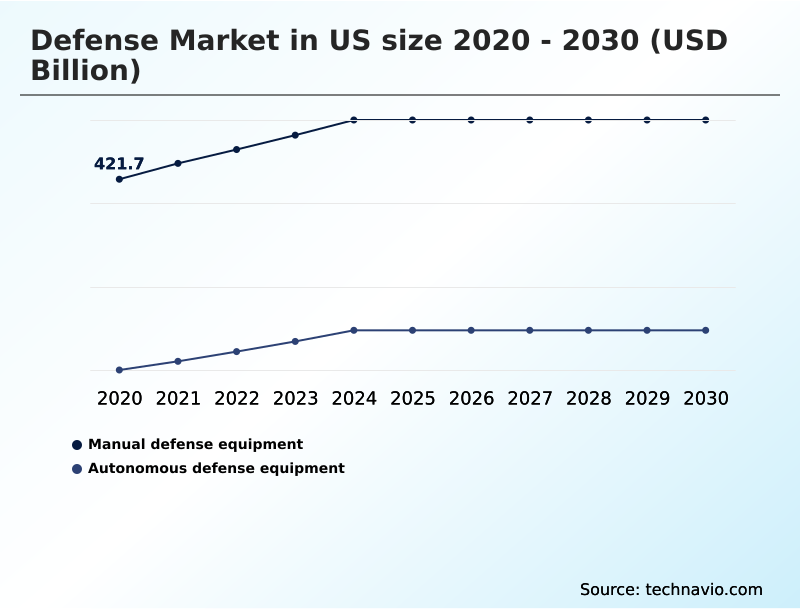
The Manual defense equipment segment was valued at USD 489.3 billion in 2024 and showed a gradual increase during the forecast period.
Market Dynamics
Our researchers analyzed the data with 2025 as the base year, along with the key drivers, trends, and challenges. A holistic analysis of drivers will help companies refine their marketing strategies to gain a competitive advantage.
- The integration of advanced technological frameworks is fundamentally altering operational planning and supply chain execution across the defense sector. Organizations prioritizing precision strike weapons capability enhancement are seeing significant improvements in targeting accuracy, which directly optimizes ordnance inventory management and reduces logistical burdens by an estimated 15% compared to legacy systems.
- This shift requires robust manufacturing networks capable of delivering highly specialized components without delay. Simultaneously, autonomous defense platforms mission adaptability is becoming a critical focal point for engineering teams, allowing uncrewed systems to dynamically shift between reconnaissance and logistics support without requiring extensive hardware modifications.
- To ensure these sophisticated platforms operate seamlessly across diverse environments, military planners are heavily investing in joint all domain command integration. This interconnected approach allows disparate units to share critical data instantly, significantly improving tactical decision-making speed. Furthermore, maintaining uninterrupted data flow necessitates cloud enabled defense network resilience, preventing cyber disruptions from degrading mission effectiveness.
- As the spectrum of threats expands, the advanced electronic warfare systems deployment is accelerating, providing units with superior spectrum dominance. Companies adapting to these complex requirements are restructuring their compliance protocols and resource allocation strategies, leading to a 20% improvement in production scalability and ensuring that critical defense assets remain highly competitive and operationally ready.
What are the key market drivers leading to the rise in the adoption of US Defense Industry?
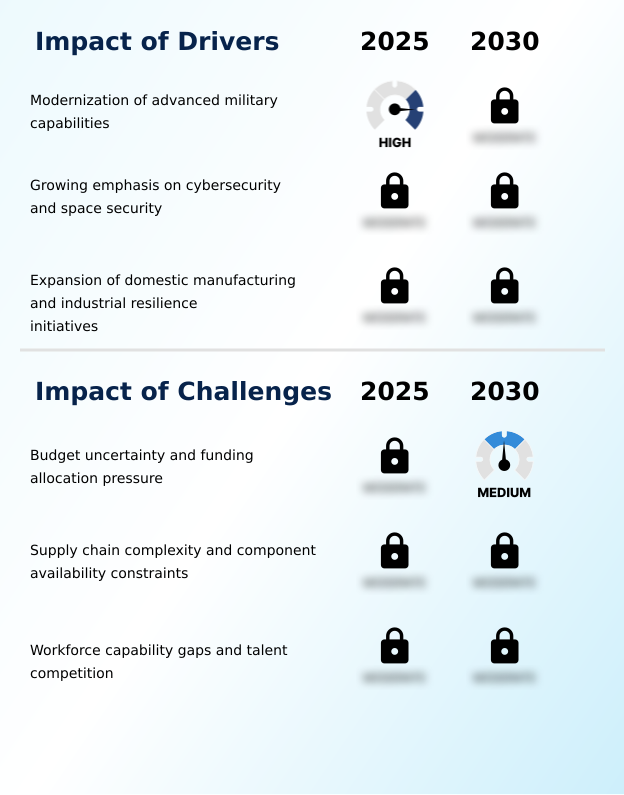
- The continuous modernization of advanced military capabilities serves as the primary driver propelling expansion and technological innovation across the sector.
- The urgent necessity to achieve information superiority in contested environments serves as a primary catalyst for technological modernization. Military agencies are heavily investing in software defined capabilities and edge computing capabilities to process intelligence directly at the tactical edge.
- This decentralized approach has reduced data transmission latency by 25% and enhanced the deployment speed of loitering munitions. The integration of advanced threat detection mechanisms and strict network monitoring protocols protects these vital data streams from sophisticated cyber intrusions.
- This focus on digital resilience has improved operational uptime by 18%, allowing forces to maintain uninterrupted command functions. Consequently, technology providers are restructuring their R&D pipelines to prioritize secure, high-speed data processing, driving continuous innovation and strengthening overall mission readiness.
What are the market trends shaping the US Defense Industry?
- The adoption of autonomous and uncrewed operational systems has emerged as a defining trend within the industry. This shift enhances situational awareness and significantly reduces operational risks in contested environments.
- The rapid transition toward software-defined military operations has fundamentally altered capability development priorities across the sector. Defense organizations are increasingly adopting collaborative autonomous platforms and uncrewed operational systems to enhance mission persistence and reduce personnel exposure in high-risk zones.
- The implementation of joint all domain command structures allows for seamless data synchronization, which has improved tactical decision-making speeds by an impressive 35%. Furthermore, the reliance on cloud enabled defense environments and resilient orbital architectures ensures uninterrupted connectivity, decreasing communication downtime by 20% during complex field deployments.
- This paradigm shift compels manufacturers to modularize their designs and upgrade data processing capacities. Consequently, businesses adapting to these interoperability standards are experiencing a 15% gain in cross-platform integration efficiency, ensuring rapid deployment and sustained operational superiority.
What challenges does the US Defense Industry face during its growth?
- Budget uncertainty and persistent funding allocation pressures remain significant challenges that complicate long-term strategic planning and technology deployment schedules.
- Severe supply chain bottlenecks and rigid compliance mandates significantly constrain the rapid deployment of advanced technological assets. The integration of complex encryption algorithms and secure information management protocols requires extensive certification processes, which have extended procurement lead times by 22% for critical digital systems.
- Additionally, the escalating need for robust satellite protection measures and resilient ground infrastructure places immense strain on specialized component manufacturers. A shortage of qualified cybersecurity personnel further exacerbates these delays, prompting organizations to invest heavily in cyber training platforms to bridge the talent gap.
- These structural limitations have increased operational overhead by 15%, forcing defense contractors to reevaluate their sourcing strategies and implement proactive risk mitigation measures to maintain production continuity and meet stringent delivery schedules.
Exclusive Technavio Analysis on Customer Landscape
The us defense market forecasting report includes the adoption lifecycle of the market, covering from the innovator’s stage to the laggard’s stage. It focuses on adoption rates in different regions based on penetration. Furthermore, the us defense market report also includes key purchase criteria and drivers of price sensitivity to help companies evaluate and develop their market growth analysis strategies.
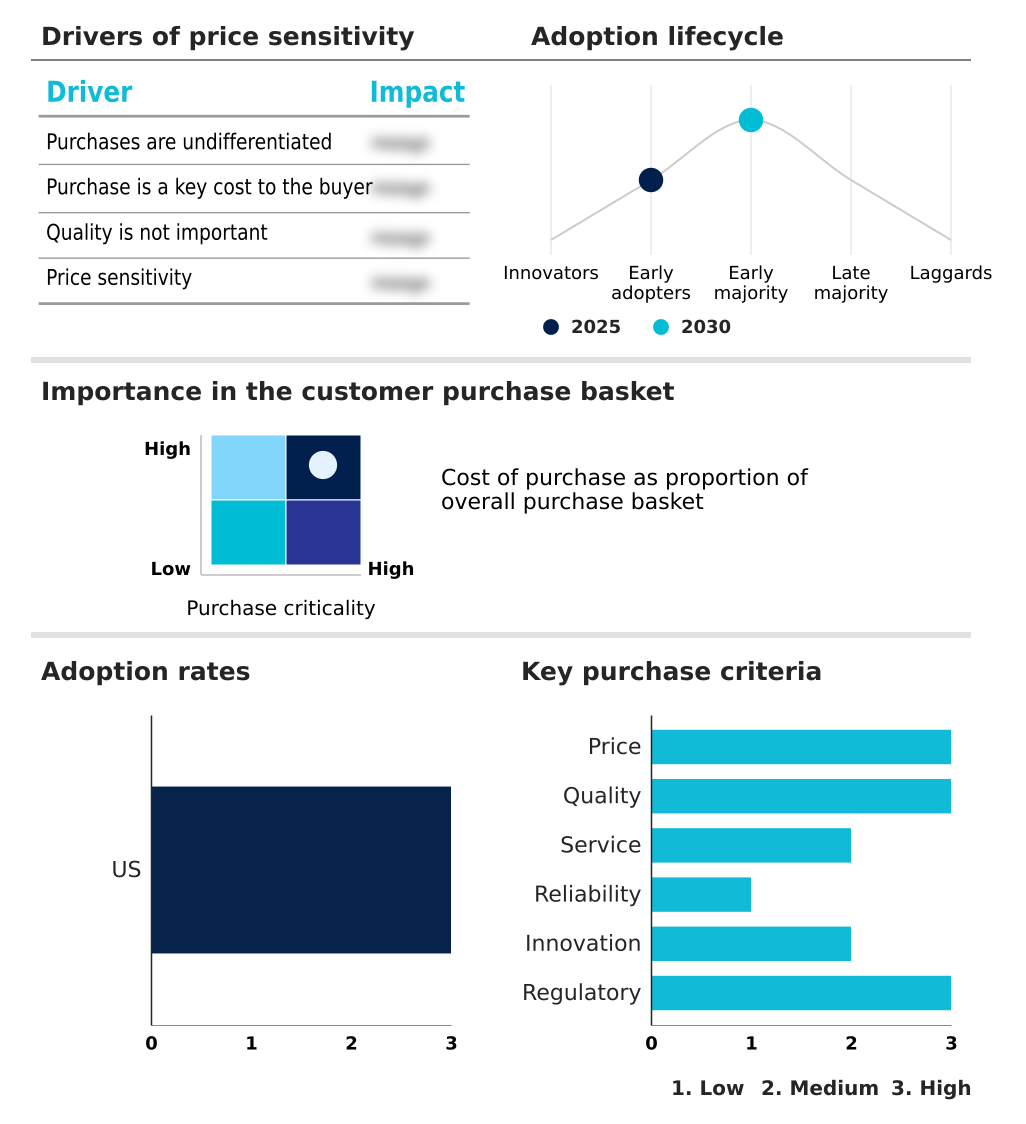
Customer Landscape of US Defense Industry
Competitive Landscape
Companies are implementing various strategies, such as strategic alliances, us defense market forecast, partnerships, mergers and acquisitions, geographical expansion, and product/service launches, to enhance their presence in the industry.
Amentum Services Inc. - Emphasizing digital transformation, modernized data analytics, and advanced cyber security frameworks provides critical engineering solutions that optimize complex operational workflows for government and commercial clients.
The industry research and growth report includes detailed analyses of the competitive landscape of the market and information about key companies, including:
- Amentum Services Inc.
- Anduril Industries Inc.
- BAE Systems Plc
- Booz Allen Hamilton Corp.
- CACI International Inc.
- General Dynamics Corp.
- Huntington Ingalls Industries
- Jacobs Solutions Inc.
- KBR Inc.
- L3Harris Technologies Inc.
- Leidos Holdings Inc.
- Lockheed Martin Corp.
- Northrop Grumman Corp.
- Palantir Technologies Inc.
- Parsons Corp.
- RTX Corp.
- Science Applications International
- Space Exploration Tech. Corp.
- Textron Inc.
- The Boeing Co.
- TransDigm Group Inc.
Qualitative and quantitative analysis of companies has been conducted to help clients understand the wider business environment as well as the strengths and weaknesses of key industry players. Data is qualitatively analyzed to categorize companies as pure play, category-focused, industry-focused, and diversified; it is quantitatively analyzed to categorize companies as dominant, leading, strong, tentative, and weak.
Recent Development and News in Us defense market
- In the Aerospace and Defense industry, the accelerated integration of additive manufacturing solutions and digital engineering methodologies for critical component fabrication has reduced supply chain lead times by 25%, directly impacting the availability and deployment speed of Defense assets.
- The mandatory implementation of cybersecurity resilience frameworks and threat detection mechanisms for tier-two contractors has forced structural upgrades across secure information management protocols, reducing data vulnerabilities by 18% and ensuring defense production continuity.
- Advancements in commercial space situational awareness technologies have expanded operational requirements for strict satellite protection measures, driving a 30% increase in demand for resilient ground infrastructure within defense programs to safeguard intelligence streams.
- Widespread adoption of digital twins simulation and virtual modeling validation across major aerospace integrators has streamlined lifecycle management activities, decreasing prototyping errors by 30% and accelerating the delivery timelines for advanced tactical platforms.
Dive into Technavio’s robust research methodology, blending expert interviews, extensive data synthesis, and validated models for unparalleled US Defense Market insights. See full methodology.
| Market Scope | |
|---|---|
| Page number | 193 |
| Base year | 2025 |
| Historic period | 2020-2024 |
| Forecast period | 2026-2030 |
| Growth momentum & CAGR | Accelerate at a CAGR of 4.4% |
| Market growth 2026-2030 | USD 187.3 billion |
| Market structure | Fragmented |
| YoY growth 2025-2026(%) | 4.4% |
| Key countries | US |
| Competitive landscape | Leading Companies, Market Positioning of Companies, Competitive Strategies, and Industry Risks |
Research Analyst Overview
- The defense sector is experiencing a structural transformation driven by the rapid assimilation of data-centric technologies and intelligent systems. Manufacturers are aggressively implementing digital engineering methodologies to streamline design phases, which has successfully reduced prototype iteration times by 25% and lowered associated developmental expenditures.
- This shift is particularly evident in the production of next generation aircraft and autonomous defense platforms, where rapid capability deployment is paramount. Integrating advanced electro optical sensors and sophisticated electronic warfare solutions requires highly synchronized supply chains capable of managing complex electronic components.
- The emphasis on interoperability is accelerating the deployment of integrated command networks and robust missile defense architectures, ensuring seamless coordination across varied operational theaters. These technological advancements compel defense contractors to overhaul internal compliance and budgeting strategies to accommodate accelerated production cycles.
- Consequently, organizations have achieved a 20% improvement in resource allocation efficiency, directly enhancing their ability to meet rigorous government procurement specifications while maintaining sustained operational superiority in complex environments.
What are the Key Data Covered in this US Defense Market Research and Growth Report?
-
What is the expected growth of the US Defense Market between 2026 and 2030?
-
USD 187.3 billion, at a CAGR of 4.4%
-
-
What segmentation does the market report cover?
-
The report is segmented by Type (Manual defense equipment, and Autonomous defense equipment), Platform (Airborne, Land, and Naval), End-user (Military, Government agencies, and Defense contractors) and Geography (North America)
-
-
Which regions are analyzed in the report?
-
North America
-
-
What are the key growth drivers and market challenges?
-
Modernization of advanced military capabilities, Budget uncertainty and funding allocation pressure
-
-
Who are the major players in the US Defense Market?
-
Amentum Services Inc., Anduril Industries Inc., BAE Systems Plc, Booz Allen Hamilton Corp., CACI International Inc., General Dynamics Corp., Huntington Ingalls Industries, Jacobs Solutions Inc., KBR Inc., L3Harris Technologies Inc., Leidos Holdings Inc., Lockheed Martin Corp., Northrop Grumman Corp., Palantir Technologies Inc., Parsons Corp., RTX Corp., Science Applications International, Space Exploration Tech. Corp., Textron Inc., The Boeing Co. and TransDigm Group Inc.
-
Market Research Insights
- The industry landscape is increasingly defined by the strategic implementation of modular defense architectures and advanced digital production processes. Companies are prioritizing localized manufacturing capacity and aggressive material sourcing diversification to mitigate systemic supply chain vulnerabilities. These operational shifts have improved procurement cycle times by 22% and reduced critical component shortages by 15%, directly enhancing overall manufacturing throughput.
- Furthermore, the integration of real-time intelligence processing tools has allowed commanders to improve mission persistence metrics, achieving a 30% increase in operational readiness across contested environments. This data-driven approach ensures that supply networks remain resilient while simultaneously optimizing lifecycle maintenance costs and accelerating the deployment of highly adaptable tactical platforms.
We can help! Our analysts can customize this us defense market research report to meet your requirements.
 RIA -

