US Home Decor Market Size 2025-2029
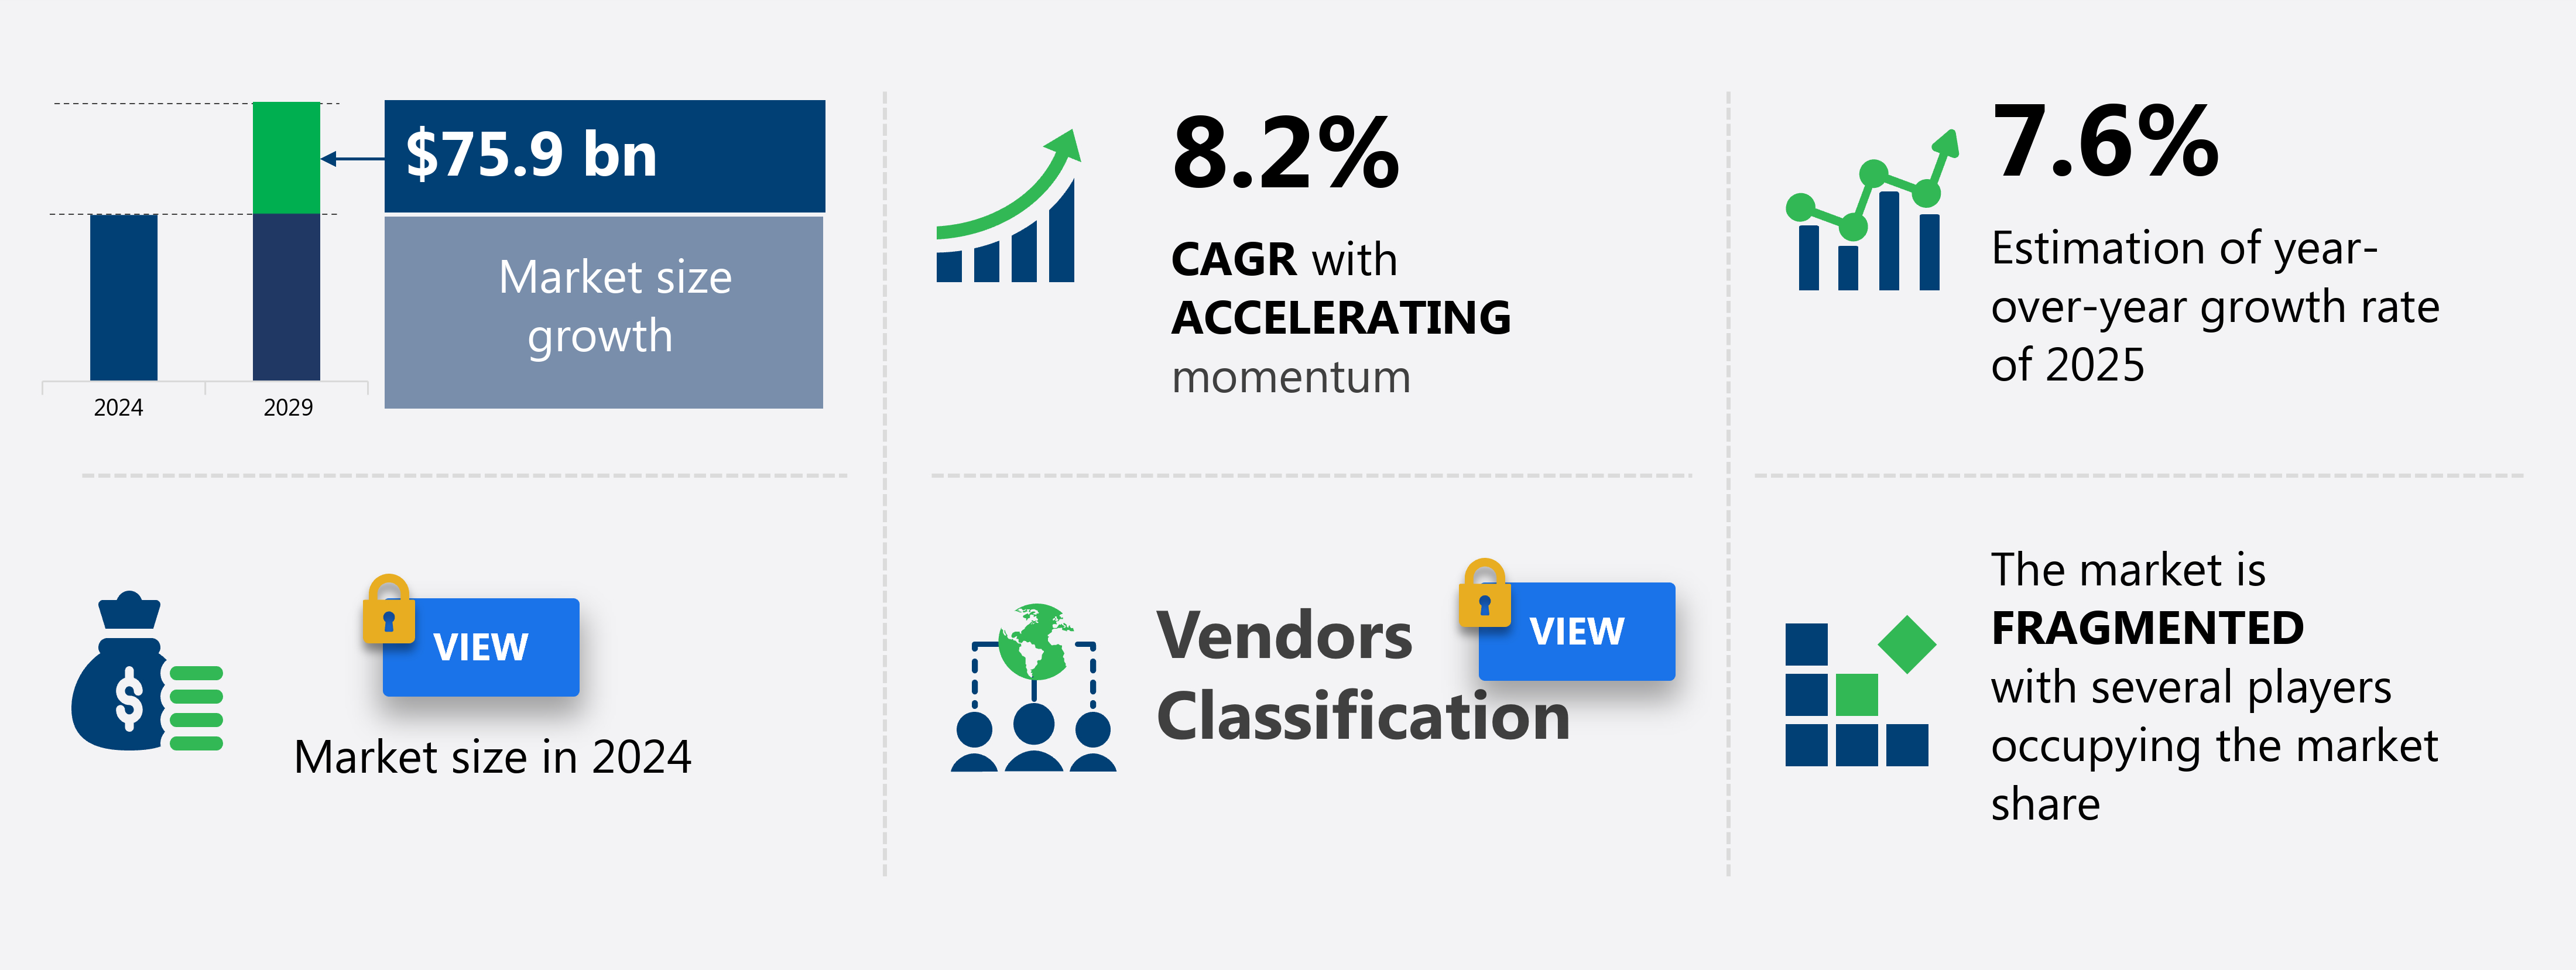
The home decor market size in US is forecast to increase by USD 75.9 billion at a CAGR of 8.2% between 2024 and 2029.
-
The home decor market is experiencing significant growth, driven by several key factors. One major trend is the rise in online spending and smartphone penetration, enabling consumers to shop for home decor items from anywhere at any time. Additionally, there is a growing demand for eco-friendly and sustainable home decor items, reflecting consumers' increasing awareness and concern for the environment. For instance, Threaded provides eco-friendly bedding and linens in fabric bags instead of plastic packaging.
-
These trends, among others, offer both opportunities and challenges for players in the home decor market. As consumers continue to prioritize personalized, sustainable, and convenient shopping experiences, companies must adapt to remain competitive. This market exhibits strong growth, driven by the increasing demand for personalized living spaces and the expanding real estate industry. Furthermore, long product replacement cycles result in infrequent purchases, making it essential for businesses to focus on customer retention and brand loyalty.
What will be the Size of the market During the Forecast Period?
-
The home decor market encompasses various sectors, including furniture, home textiles, floor coverings, and artisanal processes, among others. The interior design industry is witnessing a shift towards personalized living spaces, with consumers seeking unique and customized home decor products. This trend is particularly noticeable in apartment living, where space is at a premium. Home renovation projects continue to fuel demand for home decor products, with homeowners investing in upgrades to create clean, modern spaces. Omnichannel retail strategies are gaining traction, as consumers increasingly turn to digital platforms for research and purchase. Floor coverings, such as wood floors, remain popular choices for both residential and commercial applications, including offices, restaurants, and libraries.
-
Mechanical processes have streamlined production, making these products more accessible to consumers. Consumer trends towards outdoor living and camping have led to increased demand for home decor products tailored to these activities. The real estate industry is also influencing home decor trends, with developers focusing on creating visually appealing spaces to attract tenants or buyers. Furthermore, the transportation sector is impacting home decor, with innovations in shipping and logistics enabling faster delivery of home decor products. Home improvement stores are capitalizing on this trend, offering a wide range of home decor items for both indoor and outdoor use.
How is this market segmented and which is the largest segment?
The market research report provides comprehensive data (region-wise segment analysis), with forecasts and estimates in "USD billion" for the period 2025-2029, as well as historical data from 2019-2023 for the following segments.
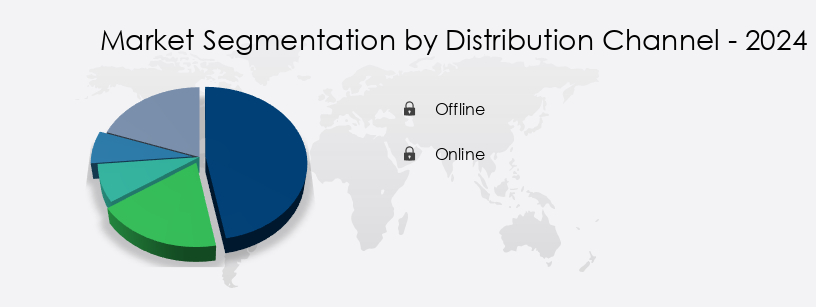
- Distribution Channel
- Offline
- Online
- Product
- Furniture
- Floor coverings
- Others
- Application
- Indoor
- Outdoor
- Geography
- North America
- US
- North America
By Distribution Channel Insights
The offline segment is estimated to witness significant growth during the forecast period. The US home decor market encompasses a range of entities, including the bedroom, upper middle income consumers, artisanal and mechanical processes, marble floors, the interior design industry, clean rooms, personalized living spaces, decorative lighting, restaurants and spas, home improvement, e-commerce, real estate industry, carpets and rugs, stores, libraries, customized online sales, environmentally friendly furniture, camping, omnichannel retail strategies, vinyl and rubber, textiles, office, outdoor, smart home technologies, home textiles, home decor products, infrastructure facilities, transportation, fashionable designs, home renovation, floor coverings, specialty stores, wood, tiles, smart devices, furniture, plastics, apartment living, digital marketing initiatives, raw materials, and metals.
Upper middle income consumers seek trendy and customized home decor, driving demand for a diverse range of products. Artisanal processes and mechanical processes coexist, with consumers appreciating both the unique and the mass-produced. Marble floors and clean rooms are popular choices for modern, minimalist interiors. The interior design industry caters to personalized living spaces, offering a wide array of decorative lighting, furniture, and textiles. Restaurants and spas create inviting atmospheres with decorative elements, while home improvement projects and real estate transactions fuel demand for home decor products. E-commerce and omnichannel retail strategies expand accessibility, with specialty stores, local boutiques, and craft stores offering unique, niche items.
Environmentally friendly furniture and home textiles are on the rise, appealing to consumers' increasing awareness of sustainability. Camping and outdoor living spaces inspire new decor trends, with smart home technologies and smart devices integrating into home decor products. Home renovation projects and floor coverings, including wood, tiles, and carpets and rugs, continue to be popular investments. Infrastructure facilities and transportation play a crucial role in the supply chain, ensuring the timely delivery of raw materials and finished products. The interior design market and wood and laminate flooring segments remain significant players, with consumer trends influencing demand for fashionable designs and innovative materials.
Wood, tiles, and smart devices are popular choices for home decor, reflecting the market's evolving patterns. CXOs and lower middle income consumers contribute to the market's growth, with digital marketing initiatives and raw materials essential for maintaining a competitive edge. Textiles, including bedding and spa products, are popular home decor categories, with consumers seeking high-quality, sustainable materials. Digital marketing initiatives are helping to drive sales, as retailers leverage social media and targeted advertising to reach consumers. Overall, the home decor market is dynamic and diverse, reflecting consumers' evolving needs and preferences. From artisanal processes to mechanical production, the industry is adapting to meet the demands of the modern consumer.
Get a glance at the market report of share of various segments Request Free Sample
Market Dynamics
Our US Home Decor Market researchers analyzed the data with 2024 as the base year, along with the key drivers, trends, and challenges. A holistic analysis of drivers will help companies refine their marketing strategies to gain a competitive advantage.
What are the key market drivers leading to the rise in adoption of US Home Decor Market?
-
Rise in online spending and smartphone penetration is the key driver of the market. The home decor market in the US has experienced significant growth due to the increase in Internet penetration and the popularity of online shopping. With improved economic conditions and the convenience of mobile commerce, consumers have been increasingly turning to e-retailers for their home decor needs. Tablets, in particular, have become popular for online purchases due to their larger, more tangible interfaces, which facilitate the decision-making process.
-
Omnichannel retail strategies, which integrate online and offline channels, have also become essential for retailers to meet the diverse needs and preferences of consumers. Overall, the home decor market is expected to continue growing as consumers seek out high-quality, customized, and sustainable decor solutions online. Websites provide comprehensive product information, including quality and safety measures, making e-retailing an attractive option for consumers. Additionally, the trend towards environmentally friendly furniture and textiles, such as carpets and rugs made of vinyl and rubber, has driven sales in the home decor market.
What are the market trends shaping the US Home Decor Market?
-
Growing demand for eco-friendly home decor items is the upcoming trend in the market. The home decor market is experiencing a shift towards eco-friendliness, driven by increasing environmental consciousness and regulatory requirements. This trend is particularly prominent in the furniture sector, where manufacturers are responding by producing sustainable products. For instance, some companies are utilizing raw materials like wood and metals, while others are focusing on recycled plastics. Apartment dwellers, in particular, are seeking out lower middle income options that prioritize sustainability. Consumer preferences for wood floors and wood and laminate furnishings are also on the rise.
-
Digital marketing initiatives are essential for reaching this growing market segment, as more consumers research and purchase home decor items online. Chairish Inc., an online resale platform, is an example of a business capitalizing on this trend by offering sustainably sourced, pre-owned furniture and home goods. Overall, the interior design market is evolving to prioritize eco-friendly solutions, presenting opportunities for businesses that can meet this demand. Chairish Inc., an online resale platform, promotes sustainability by selling pre-owned luxury furniture and vintage home goods.
What challenges does the US Home Decor Market face during the growth?
-
Long product replacement cycles resulting in infrequent purchases is a key challenge affecting the market growth. However, due to the durability and reliability of these items, consumers typically make infrequent purchases. Home decor includes various categories such as home textiles, floor coverings, wood, tiles, and smart home technologies. These investments are often considered one-time expenses, leading to a slower growth rate for the market. Consumers prioritize high-quality, branded items for their homes, which offer long-lasting value. While maintenance and cleaning costs are the primary ongoing expenses for these products, they contribute to their extended lifespan and continued usability.
-
Smart home technologies, such as smart devices, have gained popularity in recent years, adding functionality and convenience to home decor items. Despite the slower growth rate, the home decor market in the US remains a significant infrastructure facility for transportation and home renovation projects, offering a range of specialty stores catering to various customer preferences.
Exclusive Customer Landscape
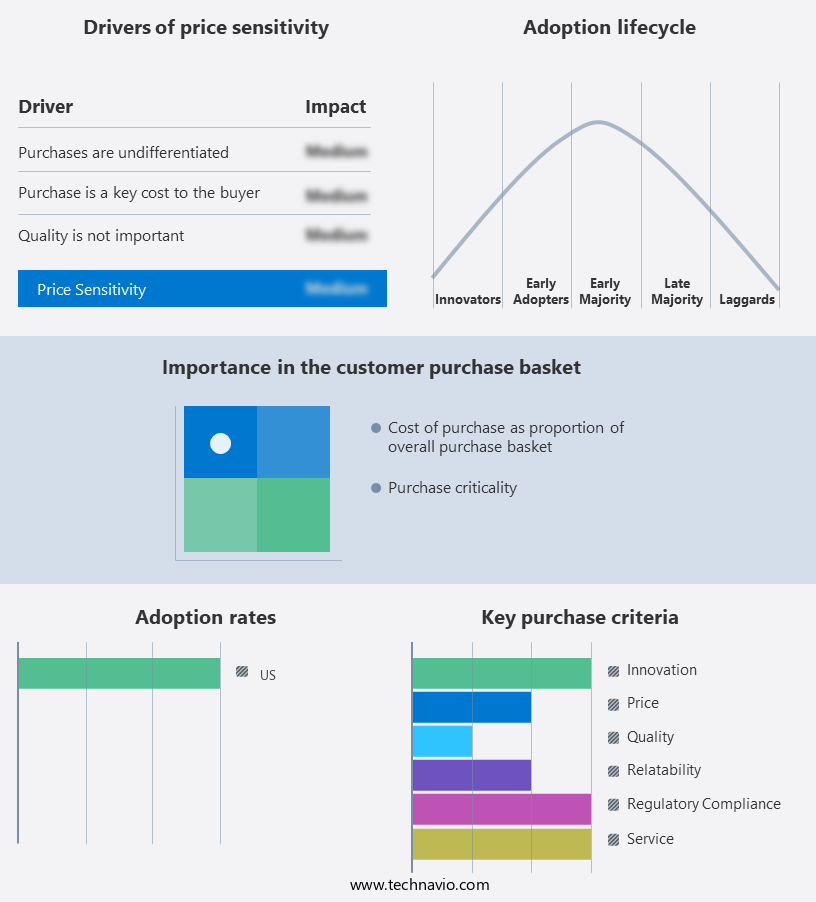
The market forecasting report includes the adoption lifecycle of the market, covering from the innovator's stage to the laggard's stage. It focuses on adoption rates in different regions based on penetration. Furthermore, the market report also includes key purchase criteria and drivers of price sensitivity to help companies evaluate and develop their market growth analysis strategies.
Customer Landscape
Key Companies & Market Insights
Companies are implementing various strategies, such as strategic alliances, market forecast, partnerships, mergers and acquisitions, geographical expansion, and product/service launches, to enhance their presence in the market.
Amazon.com Inc. - The company specializes in a range of home decor items, including portable window blackout curtain shades under the Amazon Basics brand, as well as carpets and accessories.
The market research and growth report includes detailed analyses of the competitive landscape of the market and information about key companies, including:
- Amazon.com Inc.
- Ashley Global Retail LLC
- Bed Bath and Beyond Inc.
- Berkshire Hathaway Inc.
- Brewster Home Fashions
- Costco Wholesale Corp.
- Crane and Canopy Inc.
- Crate and Barrel
- Ethan Allen Interiors Inc.
- F. Schumacher and Co.
- Haverty Furniture Companies Inc.
- Herman Miller Inc.
- Inter IKEA Holding BV
- Kimball International Inc.
- Mannington Mills Inc.
- Mohawk Industries Inc.
- Riverside Furniture Corp.
- Springs Window Fashions LLC
- The Home Depot Inc.
- Zepter International
Qualitative and quantitative analysis of companies has been conducted to help clients understand the wider business environment as well as the strengths and weaknesses of key market players. Data is qualitatively analyzed to categorize companies as pure play, category-focused, industry-focused, and diversified; it is quantitatively analyzed to categorize companies as dominant, leading, strong, tentative, and weak.
Recent Development and News in Home Decor Market In US
- In January 2024, IKEA, the global home furnishings retailer, announced the launch of its new product line, "Eco-Friendly Home Decor," made entirely from recycled materials. This initiative marked a significant shift towards sustainability in the home decor market (IKEA Press Release).
- In March 2024, Wayfair, the online home goods retailer, entered into a strategic partnership with Amazon, enabling Wayfair's products to be sold on Amazon Marketplace. This collaboration expanded Wayfair's reach and enhanced its omnichannel presence (Amazon Business Wire).
- In May 2024, Herman Miller, a leading designer and manufacturer of office furniture, acquired Design Within Reach (DWR), a premier modern design retailer. This acquisition expanded Herman Miller's product offerings and customer base in the home decor market (Herman Miller Press Release).
- In April 2025, the European Union passed the Circular Economy Act, mandating that manufacturers take back and recycle specific quantities of their products at the end of their life. This regulatory initiative is expected to significantly impact the home decor industry, driving innovation and investment in recycling technologies (EU Official Journal).
Research Analyst Overview
The home decor market continues to evolve, reflecting the dynamic interplay of various sectors and consumer preferences. E-commerce platforms are transforming the retail landscape, enabling consumers to access a wide range of decorative items from the comfort of their homes. The real estate industry, too, is embracing this shift, recognizing the potential of personalized living spaces to attract and retain tenants. Artisanal processes, such as hand-woven carpets and rugs, are gaining popularity among upper middle income consumers, adding a touch of uniqueness to their homes. Mechanical processes, on the other hand, are driving innovation in sectors like vinyl and rubber flooring, textiles, and furniture production.
Decorative lighting, once a niche market, is now a key player in the home decor industry, with applications ranging from interior design to restaurants and spas. The clean room trend is also gaining traction, with consumers seeking environmentally friendly furniture and home textiles. Camping and outdoor living have influenced the market, with consumers seeking durable, portable decor solutions. Omnichannel retail strategies are becoming essential for businesses, as they cater to consumers' evolving shopping habits. The infrastructure facilities sector is investing in smart home technologies, offering consumers the convenience of controlling their home decor with a tap or a voice command.
Home renovation projects are driving demand for floor coverings, wood, tiles, and smart devices. The furniture industry is adapting to consumer trends, with a focus on personalized living spaces, fashionable designs, and sustainable materials. CXOs are recognizing the importance of digital marketing initiatives to reach their target audience effectively. Raw materials, such as metals and plastics, are being used in innovative ways to create home decor products, while specialty stores are catering to the unique needs of lower middle income consumers. The interior design market is witnessing a shift towards wood and laminate flooring, wood floors, and home improvement projects.
Consumer trends are shaping the market, with a focus on sustainable, eco-friendly products and customized solutions. The market is expected to continue its dynamic evolution, with new players and innovations emerging constantly.
Dive into Technavio's strong research methodology, blending expert interviews, extensive data synthesis, and validated models for unparalleled Home Decor Market in US insights. See full methodology.
|
Market Scope |
|
|
Report Coverage |
Details |
|
Page number |
156 |
|
Base year |
2024 |
|
Historic period |
2019-2023 |
|
Forecast period |
2025-2029 |
|
Growth momentum & CAGR |
Accelerate at a CAGR of 8.2% |
|
Market growth 2025-2029 |
USD 75.9 billion |
|
Market structure |
Fragmented |
|
YoY growth 2024-2025(%) |
7.6 |
|
Key countries |
US |
|
Competitive landscape |
Leading Companies, Market Positioning of Companies, Competitive Strategies, and Industry Risks |
What are the Key Data Covered in this Market Research and Growth Report?
- CAGR of the market during the forecast period
- Detailed information on factors that will drive the market growth and forecasting between 2025 and 2029
- Precise estimation of the size of the market and its contribution of the market in focus to the parent market
- Accurate predictions about upcoming market growth and trends and changes in consumer behaviour
- Growth of the market across US
- Thorough analysis of the market's competitive landscape and detailed information about companies
- Comprehensive analysis of factors that will challenge the growth of market companies
We can help! Our analysts can customize this market research report to meet your requirements. Get in touch
 RIA -
RIA - 
