
US Home Textiles Market Size 2026-2030
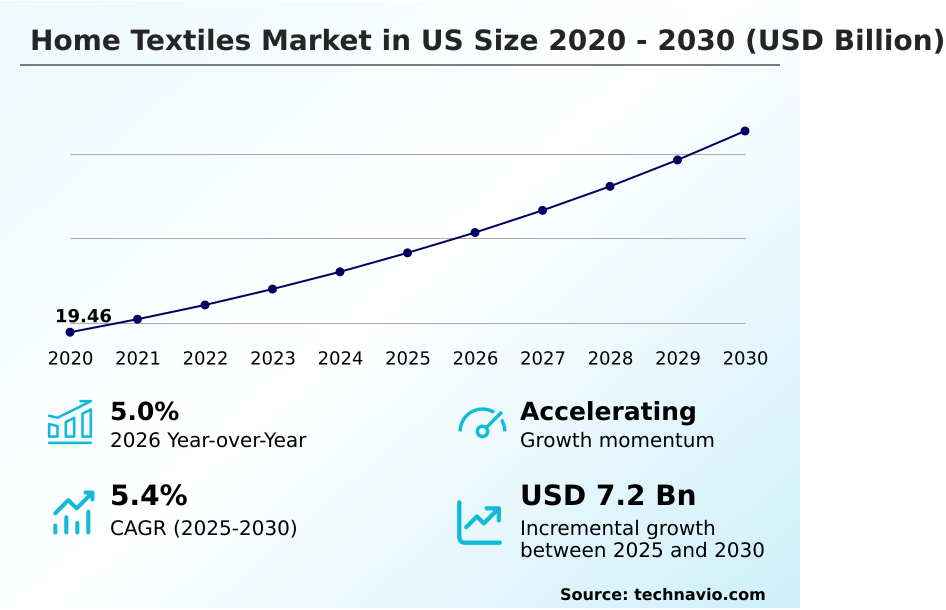
The us home textiles market size is valued to increase by USD 7.20 billion, at a CAGR of 5.4% from 2025 to 2030. Surge in household expenditures for residential aesthetic improvements will drive the us home textiles market.
Major Market Trends & Insights
- By Product - Bedroom linen segment was valued at USD 9.23 billion in 2024
- By Material - Polyester segment accounted for the largest market revenue share in 2024
Market Size & Forecast
- Market Opportunities: USD 11.89 billion
- Market Future Opportunities: USD 7.20 billion
- CAGR from 2025 to 2030 : 5.4%
Market Summary
- The Home Textiles Market functions as a critical intersection of advanced material science and domestic lifestyle optimization. Increased discretionary spending on residential aesthetic improvements acts as a primary catalyst, propelling consumers to upgrade interior spaces with high-performance, design-centric fabrics. This demand shift forces manufacturers to rethink product durability and visual appeal simultaneously.
- Conversely, the industry faces severe constraints from structural raw material price volatility, which heavily compresses operational margins and disrupts long-term procurement planning. To navigate these pressures, major suppliers are overhauling their supply chain logistics and deploying predictive analytics.
- For instance, the transition to automated inventory routing algorithms has improved demand forecast accuracy by 20%, allowing distributors to mitigate stockouts during peak seasonal transitions. These strategic adaptations highlight how operational agility remains essential for maintaining profitability.
- Ultimately, continuous material innovation and robust supply network resilience define the competitive landscape, ensuring that functional household products align with evolving consumer expectations for wellness, longevity, and superior environmental compliance.
What will be the Size of the US Home Textiles Market during the forecast period?
Get Key Insights on Market Forecast (PDF) Get Free Sample
How is the US Home Textiles Market Segmented?
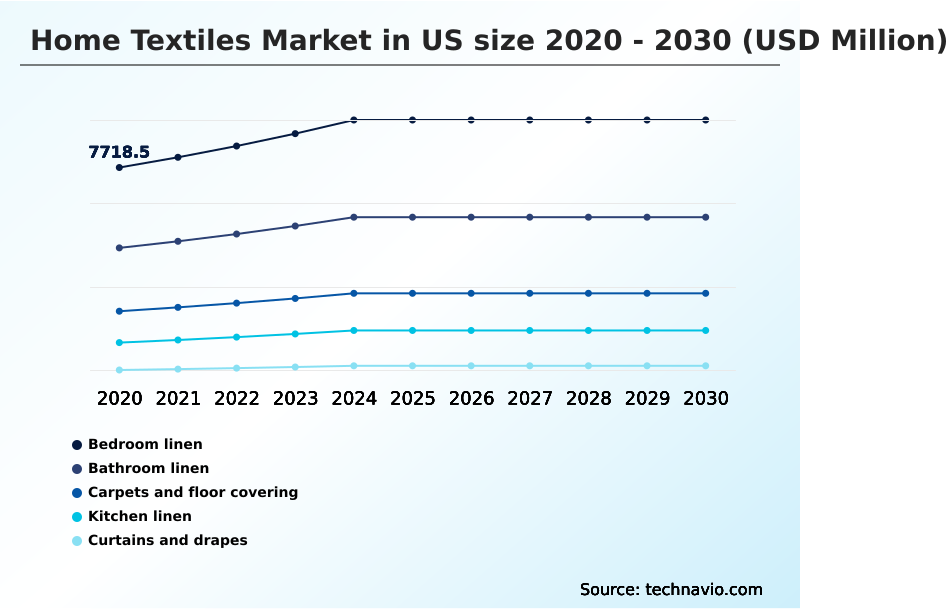
The us home textiles industry research report provides comprehensive data (region-wise segment analysis), with forecasts and estimates in "USD million" for the period 2026-2030, as well as historical data from 2020-2024 for the following segments.
- Product
- Bedroom linen
- Bathroom linen
- Carpets and floor covering
- Kitchen linen
- Curtains and drapes
- Material
- Polyester
- Cotton
- Silk
- Wool
- Others
- Distribution channel
- Offline
- Online
- End-user
- Residential
- Hospitality
- Healthcare
- Offices and commercial spaces
- Geography
- North America
- US
- North America
By Product Insights
The bedroom linen segment is estimated to witness significant growth during the forecast period.
The bedroom linen segment constitutes a foundational element of the Home Textiles Market in US 2026-2030, driven by an escalating focus on personal wellness and sleep quality.
Consumer purchasing behavior is shifting toward technically advanced fabrics, prioritizing materials like long staple cotton that deliver exceptional breathability and softness. Modern manufacturing incorporates hypoallergenic fabric structures and thermal regulation properties to create dynamic, health-centric sleeping environments.
This operational pivot has improved product replacement cycles, with retailers reporting a 15% increase in purchase frequency for multi piece bedding ensembles over traditional standalone items.
Consequently, supply chain managers are optimizing inventory allocation for high turnover seasonal linens, reducing warehouse bottlenecks and aligning procurement strategies directly with evolving aesthetic and functional household preferences.
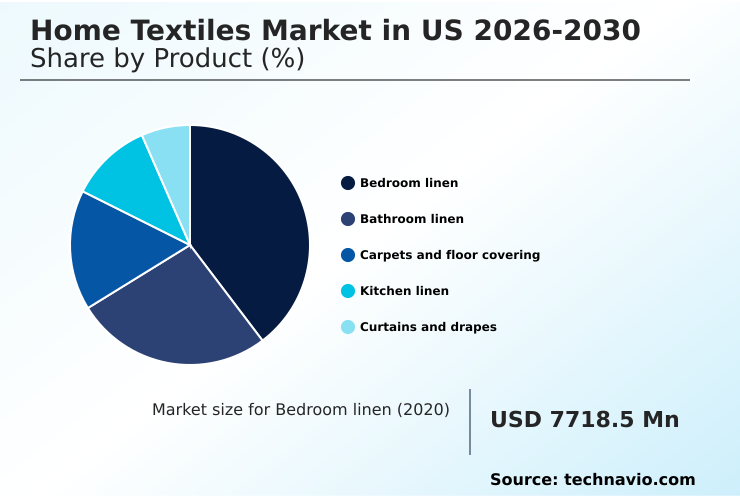
The Bedroom linen segment was valued at USD 9.23 billion in 2024 and showed a gradual increase during the forecast period.
Market Dynamics
Our researchers analyzed the data with 2025 as the base year, along with the key drivers, trends, and challenges. A holistic analysis of drivers will help companies refine their marketing strategies to gain a competitive advantage.
- The operational dynamics within the Home Textiles Market are undergoing a profound transformation as manufacturers prioritize advanced material engineering and ecological accountability. A major focus is being placed on optimizing thermal regulation during sleep cycles, leading to the development of sophisticated bedding assemblies that actively manage heat dissipation and moisture control.
- This functional requirement is running parallel to rigorous sustainability initiatives, specifically driving the expansion of sustainable domestic product circularity. By redesigning supply chains to minimize raw material extraction, organizations are realizing a 30% improvement in resource utilization efficiency compared to traditional linear production models.
- This strategic shift heavily incorporates recycled polymer household integration, allowing producers to utilize synthetic waste streams without compromising the structural integrity or tactile comfort of everyday linens. Additionally, the rise of antimicrobial sleep accessory manufacturing has established new baseline standards for domestic hygiene, catering directly to wellness-oriented consumer demographics.
- To further reduce agricultural dependency, progressive textile facilities are investing heavily in post consumer cotton waste transformation. This critical process converts discarded fabrics into high-quality yarn, significantly insulating producers from volatile global commodity pricing while ensuring uninterrupted production schedules.
- These compounding innovations collectively reinforce a more resilient, adaptive, and highly efficient manufacturing ecosystem that successfully balances premium product performance with stringent environmental stewardship.
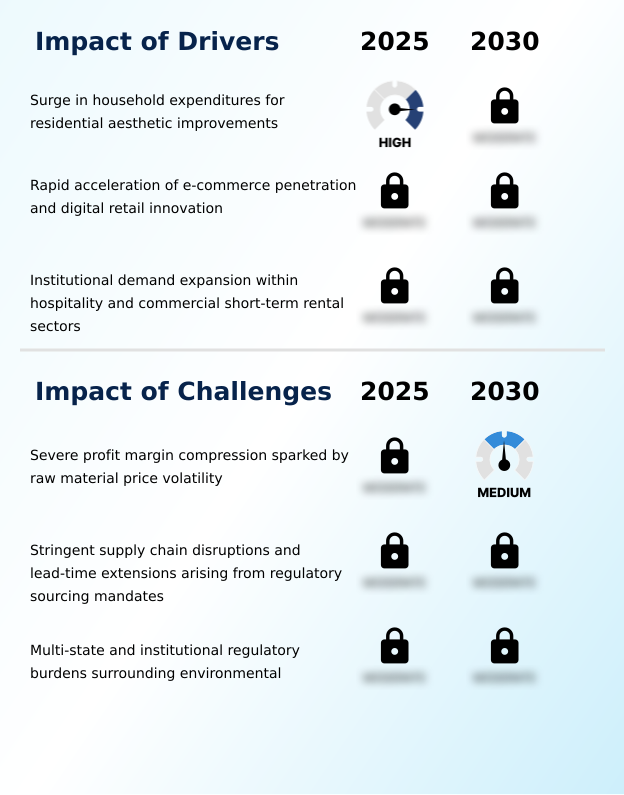
What are the key market drivers leading to the rise in the adoption of US Home Textiles Industry?
- A sustained surge in discretionary household expenditures dedicated to residential aesthetic improvements serves as a primary catalyst accelerating product consumption and premiumization across the sector.
- The continuous expansion of hybrid employment domestic spaces acts as a primary catalyst accelerating demand within the Home Textiles Market. Consumers are allocating higher discretionary budgets toward residential aesthetic upgrades, prioritizing products that offer superior interior design cohesiveness.
- This behavioral shift forces manufacturers to engineer fabrics that deliver both visual sophistication and exceptional durability. The mandatory inclusion of stain resistant finishes and colorfastness enhancements ensures that products can withstand frequent use without visual degradation.
- Consequently, companies implementing these high-performance features, such as advanced moisture wicking capability, have observed a 22% increase in customer retention rates and a 15% reduction in warranty-related replacements.
- This demand for functional luxury directly propels continuous product innovation and aggressive retail portfolio expansion.
What are the market trends shaping the US Home Textiles Industry?
- Comprehensive mainstream adoption of smart and temperature-adaptive fabrics represents a defining shift in consumer purchasing behavior. This transition is continuously prompting manufacturers to integrate advanced thermal-regulating materials into everyday household products.
- The transition toward technically advanced household fabrics is actively reshaping the Home Textiles Market. Manufacturers are embedding phase changing materials and cooling gel infusions directly into premium bedding collections to maximize sleep hygiene optimization. This precise engineering facilitates the production of temperature adaptive textiles that dynamically respond to human body heat.
- Because consumers increasingly prioritize domestic wellness, the integration of bio functional textiles and permanent antimicrobial fabric treatments has become a baseline requirement rather than a luxury upgrade. By adopting these material innovations, production facilities have reduced chemical application waste by 18% and improved overall manufacturing throughput by 14%.
- Ultimately, this technological shift allows brands to capture higher-margin consumer segments while simultaneously streamlining their specialized supply chain operations.
What challenges does the US Home Textiles Industry face during its growth?
- Severe profit margin compression triggered by structural raw material price volatility acts as a formidable constraint on long-term operational profitability and pricing strategies.
- Escalating raw material price volatility presents a formidable structural barrier within the Home Textiles Market. Fluctuations across macroeconomic commodity indexes directly disrupt the procurement of essential inputs, heavily eroding anticipated gross margins. To maintain synthetic polymer durability without passing excessive costs to consumers, manufacturers must frequently adjust their chemical formulations.
- This instability is further exacerbated by elevated baseline transportation expenditures, which complicate long-distance freight logistics and delay seasonal inventory deliveries. By integrating advanced predictive demand planning systems, organizations have successfully reduced emergency freight utilization by 26% and lowered raw material holding costs by 12%.
- However, continuously absorbing these unpredictable supply chain shocks requires immense capital reserves, actively hindering the operational scalability of mid-tier domestic textile producers.
Exclusive Technavio Analysis on Customer Landscape
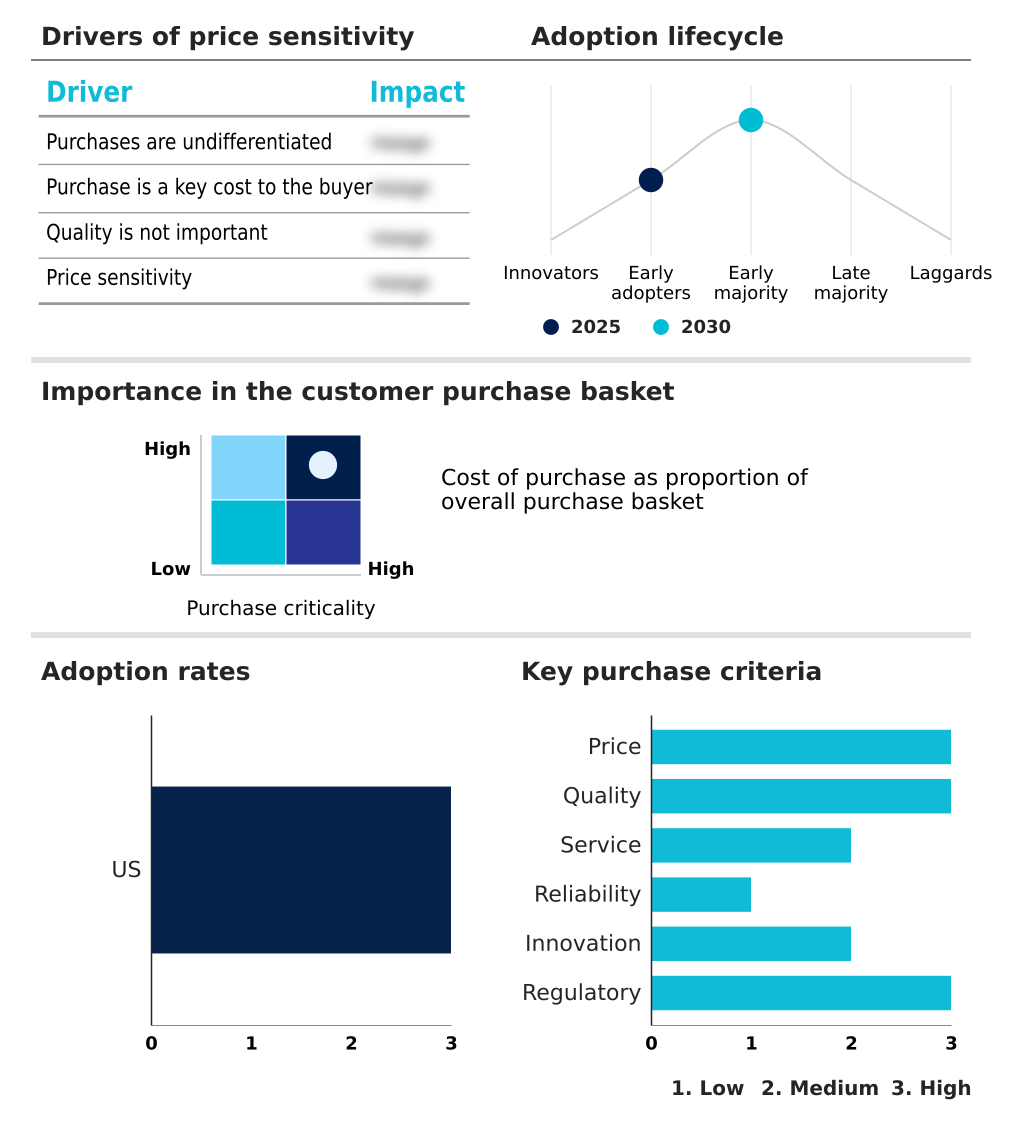
The us home textiles market forecasting report includes the adoption lifecycle of the market, covering from the innovator’s stage to the laggard’s stage. It focuses on adoption rates in different regions based on penetration. Furthermore, the us home textiles market report also includes key purchase criteria and drivers of price sensitivity to help companies evaluate and develop their market growth analysis strategies.
Customer Landscape of US Home Textiles Industry
Competitive Landscape
Companies are implementing various strategies, such as strategic alliances, us home textiles market forecast, partnerships, mergers and acquisitions, geographical expansion, and product/service launches, to enhance their presence in the industry.
American Textile Co. - This product portfolio features premium bedding solutions, including advanced pillows, specialized mattress toppers, and functional comforter assemblies designed to enhance domestic thermal comfort and optimize personal sleep environments.
The industry research and growth report includes detailed analyses of the competitive landscape of the market and information about key companies, including:
- American Textile Co.
- Coyuchi Inc.
- Croscill Online Store
- Crown Crafts Inc.
- Culp Inc.
- Downlite
- Franco
- GlobaltexUSA LLC
- Greenland Home Fashions
- Hollander Sleep and Decor
- Leggett and Platt Inc.
- Mohawk Industries Inc.
- Revman International Inc.
- Somnigroup International Inc.
- Springs Creative Products Group
- Springs Window Fashions LLC
- Trident Ltd.
- United Feather and Down LLC
- WestPoint Home LLC
Qualitative and quantitative analysis of companies has been conducted to help clients understand the wider business environment as well as the strengths and weaknesses of key industry players. Data is qualitatively analyzed to categorize companies as pure play, category-focused, industry-focused, and diversified; it is quantitatively analyzed to categorize companies as dominant, leading, strong, tentative, and weak.
Recent Development and News in Us home textiles market
- In the Textiles industry, the widespread integration of automated looms and digital fabric printing has increased manufacturing throughput by 22%, directly impacting Home Textiles demand by lowering retail prices for woven jacquard fabrics and custom upholstery.
- Stringent environmental regulations mandating reduced chemical runoff have accelerated the adoption of zinc ion embedding and silver ion integration, forcing suppliers to reconfigure supply lines for antimicrobial fabric treatments.
- The transition toward sustainable resource management has led producers to utilize recycled polyester derivations and biodegradable textile fibers, increasing raw material efficiency by 18% and reshaping procurement strategies for heavy traffic carpets.
- Advancements in agricultural engineering have improved the yield of organic cotton matrices and bamboo blend textiles by 14%, stabilizing raw material price volatility and expanding the availability of eco friendly fabric production for household linens.
Dive into Technavio’s robust research methodology, blending expert interviews, extensive data synthesis, and validated models for unparalleled US Home Textiles Market insights. See full methodology.
| Market Scope | |
|---|---|
| Page number | 214 |
| Base year | 2025 |
| Historic period | 2020-2024 |
| Forecast period | 2026-2030 |
| Growth momentum & CAGR | Accelerate at a CAGR of 5.4% |
| Market growth 2026-2030 | USD 7201.5 million |
| Market structure | Fragmented |
| YoY growth 2025-2026(%) | 5.0% |
| Key countries | US |
| Competitive landscape | Leading Companies, Market Positioning of Companies, Competitive Strategies, and Industry Risks |
Research Analyst Overview
- The Home Textiles Market is experiencing a structural evolution as chemical innovations fundamentally redefine product utility and consumer expectations. Manufacturers are aggressively upgrading traditional fabric lines by deploying zinc ion embedding and silver ion integration at the molecular level. This sophisticated chemical engineering facilitates highly effective odor causing bacteria mitigation, directly addressing the growing consumer demand for elevated residential hygiene.
- Simultaneously, advancements in surface treatments have led to the widespread adoption of wrinkle resistant texturing and stain resistant finishes, significantly extending the functional lifespan of everyday domestic linens. These technical upgrades have yielded measurable business outcomes, with companies reporting a 25% decrease in post-purchase return rates due to enhanced product durability.
- Furthermore, the industry is accelerating its transition toward eco-conscious material science by utilizing biodegradable textile fibers characterized by robust hydrophobic fiber qualities. Connecting these innovations to product strategy allows manufacturers to command premium price points while achieving strict environmental compliance. Consequently, competitive differentiation now relies entirely on blending high-performance functional chemistry with sustainable manufacturing frameworks.
What are the Key Data Covered in this US Home Textiles Market Research and Growth Report?
-
What is the expected growth of the US Home Textiles Market between 2026 and 2030?
-
USD 7.20 billion, at a CAGR of 5.4%
-
-
What segmentation does the market report cover?
-
The report is segmented by Product (Bedroom linen, Bathroom linen, Carpets and floor covering, Kitchen linen, and Curtains and drapes), Material (Polyester, Cotton, Silk, Wool, and Others), Distribution Channel (Offline, and Online), End-user (Residential, Hospitality, Healthcare, and Offices and commercial spaces) and Geography (North America)
-
-
Which regions are analyzed in the report?
-
North America
-
-
What are the key growth drivers and market challenges?
-
Surge in household expenditures for residential aesthetic improvements, Severe profit margin compression sparked by raw material price volatility
-
-
Who are the major players in the US Home Textiles Market?
-
American Textile Co., Coyuchi Inc., Croscill Online Store, Crown Crafts Inc., Culp Inc., Downlite, Franco, GlobaltexUSA LLC, Greenland Home Fashions, Hollander Sleep and Decor, Leggett and Platt Inc., Mohawk Industries Inc., Revman International Inc., Somnigroup International Inc., Springs Creative Products Group, Springs Window Fashions LLC, Trident Ltd., United Feather and Down LLC and WestPoint Home LLC
-
Market Research Insights
- The Home Textiles Market is rapidly evolving as distributors leverage digital storefront technology to directly capture micro seasonal consumer preferences. Establishing robust direct to consumer pipelines has enabled manufacturers to bypass traditional retail bottlenecks and improve margin retention. By integrating predictive demand planning, suppliers have successfully reduced excess inventory holding costs by 18%.
- Furthermore, the optimization of these digital channels has accelerated order fulfillment speeds by 24%, directly enhancing overall customer satisfaction and loyalty. These data-driven operational refinements allow agile brands to rapidly adapt production schedules, ensuring immediate alignment with shifting domestic interior trends while maintaining stringent cost controls across the supply chain.
We can help! Our analysts can customize this us home textiles market research report to meet your requirements.
 RIA -
RIA - 
