Photonics Market Analysis US - Size and Forecast 2024-2028

Photonics Market Analysis US - Size and Forecast 2024-2028

Published: Mar 2024 161 Pages SKU: IRTNTR77774

Market Overview at a Glance

$51.37 Mn
Market Opportunity
5.99%
CAGR
5.43
YoY growth 2023-2024(%)

US Photonics Market Size 2024-2028 

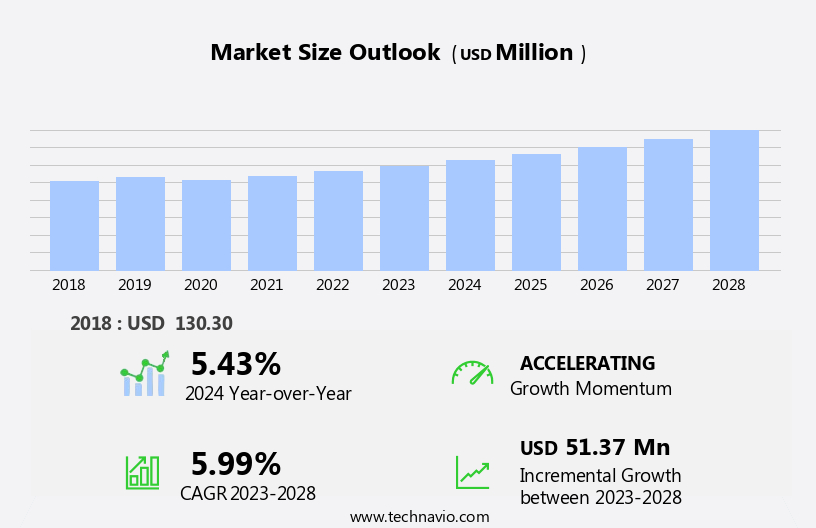
The us photonics market size is forecast to increase by USD 51.37 million, at a CAGR of 5.99% between 2023 and 2028.

  • The Photonics Market in the US is experiencing significant growth, driven by the emergence of new silicon-based applications. This technological advancement is fueling innovation and expanding the scope of photonics in various industries, including telecommunications, healthcare, and energy. The US, being a hub for technological innovation, is at the forefront of these developments. However, the market faces a notable challenge in the form of the high cost of photonics-enabled devices. This obstacle poses a significant barrier to widespread adoption, particularly in industries with tight budgets or price-sensitive consumers. To capitalize on the market opportunities and navigate these challenges effectively, companies must focus on cost reduction strategies, such as economies of scale, process optimization, and technology advancements.
  • Additionally, collaborations and partnerships with key industry players can help share the development costs and accelerate time-to-market. By addressing these challenges, companies can tap into the vast potential of the photonics market and establish a competitive edge.

What will be the size of the US Photonics Market during the forecast period?

Photonics Market in US Size

Explore in-depth regional segment analysis with market size data - historical 2018-2022 and forecasts 2024-2028 - in the full report.  
 Request Free Sample

  • The photonics market in the US is characterized by continuous innovation and advancements in various applications, including optical communications, bioimaging, and quantum information processing. Optical couplers play a crucial role in connecting different optical components, while photonic integrated circuits enable compact and efficient systems. Optical bioimaging techniques, such as confocal microscopy and super-resolution microscopy, revolutionize biomedical research. Optical manipulation methods, including optical trapping and optical tweezers, facilitate precise control of particles. Quantum information processing and satellite communications rely on advanced technologies like nonlinear optics and ultrafast optics. Data center optics and optical networking drive the demand for high-speed optical interconnects and wavelength division multiplexing.
  • Optical sensors and fiber optic sensors are integral to various industries, from environmental monitoring to industrial automation. Terahertz photonics and silicon photonics offer promising solutions for emerging applications, while laser scanning microscopy and optical filters enhance imaging capabilities. Optical switches and optical demodulators ensure efficient data transmission, and fiber Bragg gratings provide wavelength selectivity. Structured illumination microscopy and light field imaging expand the horizons of optical microscopy. Optical nanometrology and Raman amplifiers contribute to the development of advanced measurement and amplification technologies. Overall, the US photonics market is a dynamic and diverse landscape of technological innovation.

How is this market segmented?

The market research report provides comprehensive data (region-wise segment analysis), with forecasts and estimates in "USD million" for the period 2024-2028, as well as historical data from 2018-2022 for the following segments.

  • End-user
    • Consumer electronics
    • Building and construction
    • Safety and defense technology
    • Medical and healthcare
    • Others
  • Product
    • WDM filters
    • Optical modulators
    • Optical interconnects
    • Photo detectors
    • Others
  • Application
    • Information and communication technology
    • Displays
    • Photovoltaic
    • Biophotonics
    • Others
  • Geography
    • North America
      • US

By End-user Insights

The consumer electronics segment is estimated to witness significant growth during the forecast period.

In the dynamic US photonics market, consumer electronics hold a substantial segment with a broad user base reaping the benefits of photonics-driven devices. Photonics technology significantly enhances the capabilities, functionality, and user experience of various consumer electronics products. A prime application within this sector is displays, where photonics brings about a noticeable difference in smartphones, tablets, televisions, and augmented reality (AR) devices. Technologies such as organic light-emitting diodes (OLEDs), liquid crystal displays (LCDs), and micro LEDs, which are photonics-based, offer vibrant colors, high resolution, and energy efficiency. These advanced displays cater to the increasing demand for premium-quality visual output in consumer electronics, providing users with immersive viewing experiences.

Photonics also extends its reach to other consumer electronics segments like laser cutting, laser metrology, optical communication, laser marking, laser welding, and photonics research. Optical switching, optical networking, optical microresonators, raman spectroscopy, infrared spectroscopy, free-space optics, optical data storage, laser processing, fluorescence microscopy, optical simulation, silicon photonics, laser engraving, quantum photonics, atmospheric optics, optical tweezers, fiber optic sensors, optical sensing, medical photonics, photonic chips, imaging sensors, optical interconnects, fiber optics, laser displays, optical components, optical design, optical amplifiers, single-photon detection, optical displays, optical transceivers, light projection, optical fiber, ultraviolet spectroscopy, holographic data storage, and various other photonics applications continue to fuel market growth and innovation.

Photonics Market in US Size

Download Free Sample Report

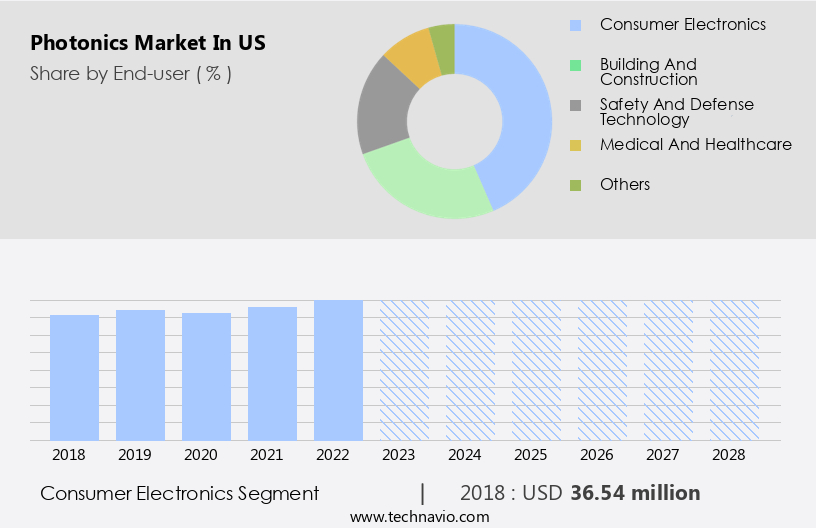
The Consumer electronics segment was valued at  USD 36.54 million in 2018 and showed a gradual increase during the forecast period.

Market Dynamics

Our researchers analyzed the data with 2023 as the base year, along with the key drivers, trends, and challenges. A holistic analysis of drivers will help companies refine their marketing strategies to gain a competitive advantage.

What are the US Photonics Market market drivers leading to the rise in adoption of the Industry?

  • The emergence of silicon-based photonics applications is the primary catalyst driving market growth in this sector. 

  • The photonics market in the US is experiencing significant growth due to the emergence of silicon-based photonics applications. Silicon photonics, which utilizes silicon's unique properties to manipulate light, offers numerous advantages such as high-speed data transmission, energy efficiency, and compatibility with existing semiconductor fabrication processes. In the data communication sector, silicon photonics is driving the development of high-speed, low-power optical interconnects for data centers and telecommunications networks. This integration of photonics with traditional semiconductor technologies is enabling the creation of compact, cost-effective solutions for managing the increasing volumes of data. Beyond data communication, silicon photonics is revolutionizing sensing technologies, particularly in healthcare and environmental monitoring.
  • Its ability to integrate multiple optical functions on a single chip enhances the sensitivity and performance of sensing devices while reducing their size and complexity. Technologies such as optical microscopy, laser welding, light emitting diodes (LED), photonics integration, optical trapping, optical coherence tomography, laser spectroscopy, and holographic data storage are all benefiting from the advancements in silicon photonics. Silicon photonics is poised to transform industries such as healthcare, telecommunications, and manufacturing by providing faster, more efficient, and cost-effective solutions. Its potential applications are vast, from high-speed data transmission and energy-efficient computing to advanced sensing and imaging technologies.
  • The future of photonics in the US market is bright, with continued innovation and investment in this promising field.

What are the US Photonics Market market trends shaping the Industry?

  • The rising trend in the United States pertains to advancements in the field of photonics, which is poised to shape the market in the coming periods. This development signifies a significant shift towards innovative technologies that leverage light to transmit information and energy.

  • The photonics market in the US is witnessing notable progress, fueled by technological advancements, increased investments, and expanding applications across industries. One of the recent breakthroughs is IPG Photonics' introduction of innovative fiber laser solutions. In June 2023, they showcased new technologies for e-mobility manufacturing, materials processing, and specialized applications. Among these, the Cold Oven laser diode heating technology stands out as a significant advancement in thermal processing. This technology replaces traditional infrared bulbs and convection drying furnaces, offering faster heating and drying processes, as well as increased energy efficiency. Moreover, the photonics industry is also experiencing growth in areas such as optical switching, optical networking, and laser processing.
  • Optical microresonators, for instance, are gaining popularity due to their potential in applications like optical data storage and telecommunications. Other techniques, like Raman spectroscopy and infrared spectroscopy, are essential in various industries, including pharmaceuticals, food processing, and environmental analysis. Furthermore, free-space optics and fluorescence microscopy are essential tools in research and development, enabling high-resolution imaging and precise measurements. Lastly, laser cutting and laser metrology are increasingly being adopted in manufacturing processes due to their accuracy, speed, and versatility. As the photonics market continues to evolve, we can expect further advancements and innovations in these areas.

How does US Photonics Market market faces challenges face during its growth?

  • The escalating costs of producing photonics-enabled devices pose a significant challenge to the industry's growth trajectory. 

  • The photonics market in the US is characterized by advanced technologies such as optical simulation, silicon photonics, laser engraving, quantum photonics, atmospheric optics, optical tweezers, laser systems, fiber optic sensors, optical sensing, medical photonics, photonic chips, imaging sensors, and optical interconnects. Despite their numerous applications in industries like telecommunications, healthcare, manufacturing, and defense, the high cost of photonics-enabled devices remains a significant challenge. The manufacturing process for these devices is intricate and requires precision, utilizing specialized materials and advanced fabrication techniques. Strict quality control measures are also essential to ensure reliability and performance, further increasing production expenses.
  • Key photonics technologies include lasers, optical fibers, detectors, and sensors, which find applications in various sectors. For instance, lasers are used in medical procedures, while fiber optic sensors are employed in industrial process control and environmental monitoring. In conclusion, the photonics market in the US continues to evolve, driven by technological advancements and the growing demand for efficient and reliable solutions. However, the high cost of photonics-enabled devices remains a significant barrier to wider adoption.

Exclusive US Photonics Market Customer Landscape

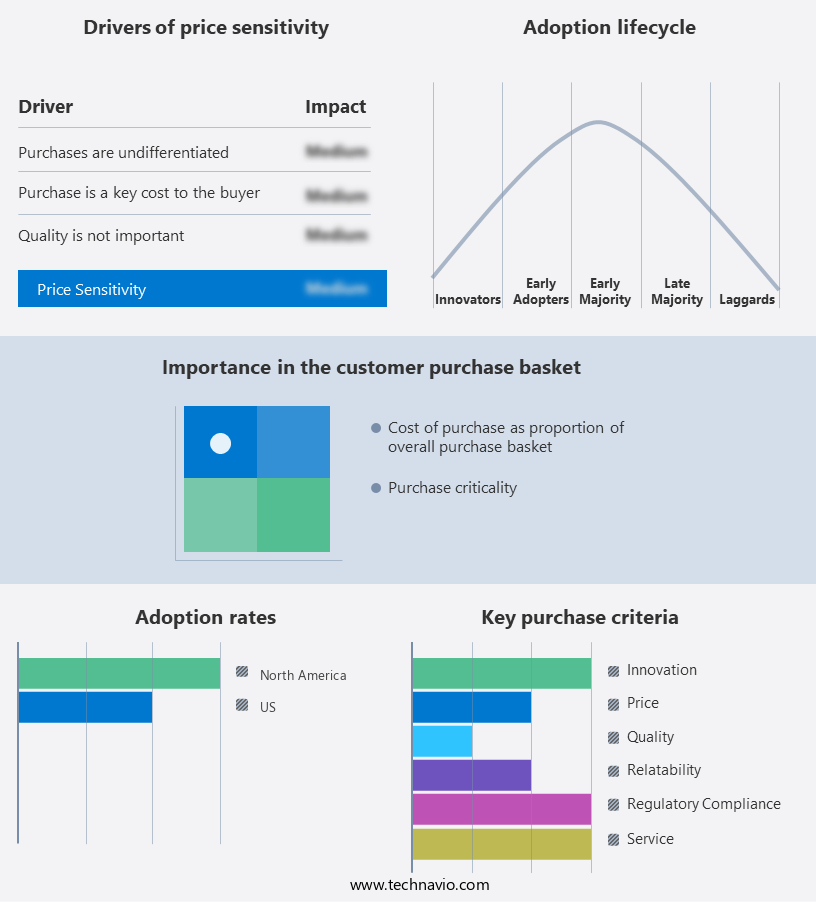
The market forecasting report includes the adoption lifecycle of the market, covering from the innovator’s stage to the laggard’s stage. It focuses on adoption rates in different regions based on penetration. Furthermore, the report also includes key purchase criteria and drivers of price sensitivity to help companies evaluate and develop their market growth analysis strategies.

Photonics Market in US Share by Geography

 Customer Landscape

Key Companies & Market Insights

Companies are implementing various strategies, such as strategic alliances, market forecast partnerships, mergers and acquisitions, geographical expansion, and product/service launches, to enhance their presence in the market.

The market research and growth report includes detailed analyses of the competitive landscape of the market and information about key companies, including:

  • American Elements
  • ams OSRAM AG
  • Hamamatsu Photonics KK
  • II VI Inc.
  • Infinera Corp.
  • Intel Corp.
  • IPG Photonics Corp.
  • Lumentum Holdings Inc.
  • Molex LLC
  • NEC Corp.
  • Photonic Systems Inc.
  • Polatis Inc.
  • Thorlabs Inc.
  • TRUMPF SE Co. KG
  • Vescent Photonics LLC

Qualitative and quantitative analysis of companies has been conducted to help clients understand the wider business environment as well as the strengths and weaknesses of key market players. Data is qualitatively analyzed to categorize companies as pure play, category-focused, industry-focused, and diversified; it is quantitatively analyzed to categorize companies as dominant, leading, strong, tentative, and weak.

Recent Development and News in Photonics Market In US

  • In January 2024, Intel Corporation, a leading technology company, announced the launch of its new photonics product line, "Silicon Photonics Modules," aimed at enhancing data center connectivity and increasing bandwidth efficiency (Intel Press Release, 2024). This development marks a significant stride in the photonics market, as Intel joins the competition to provide advanced solutions for the rapidly growing data center sector.
  • In March 2025, Cisco Systems and Lumentum Holdings Inc. Entered into a strategic partnership to co-develop and manufacture optical transceivers, integrating Lumentum's photonics expertise with Cisco's networking technology (Cisco Press Release, 2025). This collaboration is expected to strengthen Cisco's product offerings and position them competitively in the market.
  • In May 2024, II-VI Inc., a leading provider of opto-electronic components, announced the acquisition of Finisar Corporation, a major supplier of optical communications components, for approximately USD3.2 billion (II-VI Press Release, 2024). This merger significantly expands II-VI's product portfolio and market presence, positioning them as a key player in the photonics industry.
  • In September 2025, the US Department of Energy (DOE) announced a USD150 million investment in the development of photovoltaic-photonic solar technology, a significant advancement in solar energy conversion (DOE Press Release, 2025). This initiative underscores the US government's commitment to supporting research and development in the photonics sector, potentially driving innovation and growth in the market.

Research Analyst Overview

The photonics market in the US continues to evolve, driven by advancements in various applications across multiple sectors. Optical switching and optical networking solutions are at the forefront of this evolution, enabling faster and more efficient data transmission. Optical microresonators, a crucial component in these applications, are experiencing significant growth due to their ability to manipulate light at the nanoscale. Laser cutting and laser metrology are also gaining traction, with laser processing becoming increasingly prevalent in industries such as manufacturing and healthcare. Optical metrology and Raman spectroscopy are essential tools in ensuring product quality and process control. Photonics education is playing a pivotal role in driving innovation, with researchers and students exploring new applications in fields such as infrared spectroscopy, free-space optics, and optical data storage.

Photonics research is also advancing in areas like silicon photonics, quantum photonics, and atmospheric optics, leading to the development of new technologies like optical tweezers, laser systems, fiber optic sensors, and optical interconnects. Medical photonics is another rapidly growing sector, with applications ranging from imaging sensors and photonic chips to optical communication and light projection. LED technology and photonics integration are key components in many of these applications, while optical design and optical amplifiers are essential in optimizing performance. Single-photon detection, optical displays, and optical transceivers are also experiencing significant growth, with applications in various industries such as telecommunications, defense, and consumer electronics.

Light projection and fiber optics are increasingly being used in advertising, entertainment, and industrial automation, respectively. The ongoing unfolding of market activities and evolving patterns in the photonics industry reflect the continuous dynamism of this field, with new applications and technologies emerging regularly.

Dive into Technavio’s robust research methodology, blending expert interviews, extensive data synthesis, and validated models for unparalleled Photonics Market in US insights. See full methodology.

Market Scope

Report Coverage

Details

Page number

161

Base year

2023

Historic period

2018-2022

Forecast period

2024-2028

Growth momentum & CAGR

Accelerate at a CAGR of 5.99%

Market growth 2024-2028

USD 51.37 million

Market structure

Fragmented

YoY growth 2023-2024(%)

5.43

Competitive landscape

Leading Companies, Market Positioning of Companies, Competitive Strategies, and Industry Risks

Request Free Sample

What are the Key Data Covered in this Market Research Report?

  • CAGR of the market during the forecast period
  • Detailed information on factors that will drive the market growth and forecasting between 2024 and 2028
  • Precise estimation of the size of the market  and its contribution of the market in focus to the parent market
  • Accurate predictions about upcoming market growth and trends and changes in consumer behaviour
  • Growth of the market across US
  • Thorough analysis of the market’s competitive landscape and detailed information about companies
  • Comprehensive analysis of factors that will challenge the growth of market companies

We can help! Our analysts can customize this market research report to meet your requirements Get in touch


1 Executive Summary

  • 1.1 Market overview
    • Exhibit 01: Executive Summary – Chart on Market Overview
    • Exhibit 02: Executive Summary – Data Table on Market Overview
    • Exhibit 03: Executive Summary – Chart on Country Market Characteristics
    • Exhibit 04: Executive Summary – Chart on Market Segmentation by End-user
    • Exhibit 05: Executive Summary – Chart on Market Segmentation by Product
    • Exhibit 06: Executive Summary – Chart on Market Segmentation by Application
    • Exhibit 07: Executive Summary – Chart on Vendor Market Positioning

2 Market Landscape

  • 2.1 Market ecosystem
    • Exhibit 08: Parent market
    • Exhibit 09: Market Characteristics

3 Market Sizing

  • 3.1 Market definition
    • Exhibit 10: Offerings of vendors included in the market definition
  • 3.2 Market segment analysis
    • Exhibit 11: Market segments
  • 3.3 Market size 2023
    • 3.4 Market outlook: Forecast for 2023-2028
      • Exhibit 12: Chart on US - Market size and forecast 2023-2028 ($ million)
      • Exhibit 13: Data Table on US - Market size and forecast 2023-2028 ($ million)
      • Exhibit 14: Chart on US: Year-over-year growth 2023-2028 (%)
      • Exhibit 15: Data Table on US: Year-over-year growth 2023-2028 (%)

    4 Historic Market Size

    • 4.1 Photonics market in US 2018 - 2022
      • Exhibit 16: Historic Market Size – Data Table on photonics market in US 2018 - 2022 ($ million)
    • 4.2 End-user Segment Analysis 2018 - 2022
      • Exhibit 17: Historic Market Size – End-user Segment 2018 - 2022 ($ million)
    • 4.3 Product Segment Analysis 2018 - 2022
      • Exhibit 18: Historic Market Size – Product Segment 2018 - 2022 ($ million)
    • 4.4 Application Segment Analysis 2018 - 2022
      • Exhibit 19: Historic Market Size – Application Segment 2018 - 2022 ($ million)

    5 Five Forces Analysis

    • 5.1 Five forces summary
      • Exhibit 20: Five forces analysis - Comparison between 2023 and 2028
    • 5.2 Bargaining power of buyers
      • Exhibit 21: Chart on Bargaining power of buyers – Impact of key factors 2023 and 2028
    • 5.3 Bargaining power of suppliers
      • Exhibit 22: Bargaining power of suppliers – Impact of key factors in 2023 and 2028
    • 5.4 Threat of new entrants
      • Exhibit 23: Threat of new entrants – Impact of key factors in 2023 and 2028
    • 5.5 Threat of substitutes
      • Exhibit 24: Threat of substitutes – Impact of key factors in 2023 and 2028
    • 5.6 Threat of rivalry
      • Exhibit 25: Threat of rivalry – Impact of key factors in 2023 and 2028
    • 5.7 Market condition
      • Exhibit 26: Chart on Market condition - Five forces 2023 and 2028

    6 Market Segmentation by End-user

    • 6.1 Market segments
      • Exhibit 27: Chart on End-user - Market share 2023-2028 (%)
      • Exhibit 28: Data Table on End-user - Market share 2023-2028 (%)
    • 6.2 Comparison by End-user
      • Exhibit 29: Chart on Comparison by End-user
      • Exhibit 30: Data Table on Comparison by End-user
    • 6.3 Consumer electronics - Market size and forecast 2023-2028
      • Exhibit 31: Chart on Consumer electronics - Market size and forecast 2023-2028 ($ million)
      • Exhibit 32: Data Table on Consumer electronics - Market size and forecast 2023-2028 ($ million)
      • Exhibit 33: Chart on Consumer electronics - Year-over-year growth 2023-2028 (%)
      • Exhibit 34: Data Table on Consumer electronics - Year-over-year growth 2023-2028 (%)
    • 6.4 Building and construction - Market size and forecast 2023-2028
      • Exhibit 35: Chart on Building and construction - Market size and forecast 2023-2028 ($ million)
      • Exhibit 36: Data Table on Building and construction - Market size and forecast 2023-2028 ($ million)
      • Exhibit 37: Chart on Building and construction - Year-over-year growth 2023-2028 (%)
      • Exhibit 38: Data Table on Building and construction - Year-over-year growth 2023-2028 (%)
    • 6.5 Safety and defense technology - Market size and forecast 2023-2028
      • Exhibit 39: Chart on Safety and defense technology - Market size and forecast 2023-2028 ($ million)
      • Exhibit 40: Data Table on Safety and defense technology - Market size and forecast 2023-2028 ($ million)
      • Exhibit 41: Chart on Safety and defense technology - Year-over-year growth 2023-2028 (%)
      • Exhibit 42: Data Table on Safety and defense technology - Year-over-year growth 2023-2028 (%)
    • 6.6 Medical and healthcare - Market size and forecast 2023-2028
      • Exhibit 43: Chart on Medical and healthcare - Market size and forecast 2023-2028 ($ million)
      • Exhibit 44: Data Table on Medical and healthcare - Market size and forecast 2023-2028 ($ million)
      • Exhibit 45: Chart on Medical and healthcare - Year-over-year growth 2023-2028 (%)
      • Exhibit 46: Data Table on Medical and healthcare - Year-over-year growth 2023-2028 (%)
    • 6.7 Others - Market size and forecast 2023-2028
      • Exhibit 47: Chart on Others - Market size and forecast 2023-2028 ($ million)
      • Exhibit 48: Data Table on Others - Market size and forecast 2023-2028 ($ million)
      • Exhibit 49: Chart on Others - Year-over-year growth 2023-2028 (%)
      • Exhibit 50: Data Table on Others - Year-over-year growth 2023-2028 (%)
    • 6.8 Market opportunity by End-user
      • Exhibit 51: Market opportunity by End-user ($ million)
      • Exhibit 52: Data Table on Market opportunity by End-user ($ million)

    7 Market Segmentation by Product

    • 7.1 Market segments
      • Exhibit 53: Chart on Product - Market share 2023-2028 (%)
      • Exhibit 54: Data Table on Product - Market share 2023-2028 (%)
    • 7.2 Comparison by Product
      • Exhibit 55: Chart on Comparison by Product
      • Exhibit 56: Data Table on Comparison by Product
    • 7.3 WDM filters - Market size and forecast 2023-2028
      • Exhibit 57: Chart on WDM filters - Market size and forecast 2023-2028 ($ million)
      • Exhibit 58: Data Table on WDM filters - Market size and forecast 2023-2028 ($ million)
      • Exhibit 59: Chart on WDM filters - Year-over-year growth 2023-2028 (%)
      • Exhibit 60: Data Table on WDM filters - Year-over-year growth 2023-2028 (%)
    • 7.4 Optical modulators - Market size and forecast 2023-2028
      • Exhibit 61: Chart on Optical modulators - Market size and forecast 2023-2028 ($ million)
      • Exhibit 62: Data Table on Optical modulators - Market size and forecast 2023-2028 ($ million)
      • Exhibit 63: Chart on Optical modulators - Year-over-year growth 2023-2028 (%)
      • Exhibit 64: Data Table on Optical modulators - Year-over-year growth 2023-2028 (%)
    • 7.5 Optical interconnects - Market size and forecast 2023-2028
      • Exhibit 65: Chart on Optical interconnects - Market size and forecast 2023-2028 ($ million)
      • Exhibit 66: Data Table on Optical interconnects - Market size and forecast 2023-2028 ($ million)
      • Exhibit 67: Chart on Optical interconnects - Year-over-year growth 2023-2028 (%)
      • Exhibit 68: Data Table on Optical interconnects - Year-over-year growth 2023-2028 (%)
    • 7.6 Photo detectors - Market size and forecast 2023-2028
      • Exhibit 69: Chart on Photo detectors - Market size and forecast 2023-2028 ($ million)
      • Exhibit 70: Data Table on Photo detectors - Market size and forecast 2023-2028 ($ million)
      • Exhibit 71: Chart on Photo detectors - Year-over-year growth 2023-2028 (%)
      • Exhibit 72: Data Table on Photo detectors - Year-over-year growth 2023-2028 (%)
    • 7.7 Others - Market size and forecast 2023-2028
      • Exhibit 73: Chart on Others - Market size and forecast 2023-2028 ($ million)
      • Exhibit 74: Data Table on Others - Market size and forecast 2023-2028 ($ million)
      • Exhibit 75: Chart on Others - Year-over-year growth 2023-2028 (%)
      • Exhibit 76: Data Table on Others - Year-over-year growth 2023-2028 (%)
    • 7.8 Market opportunity by Product
      • Exhibit 77: Market opportunity by Product ($ million)
      • Exhibit 78: Data Table on Market opportunity by Product ($ million)

    8 Market Segmentation by Application

    • 8.1 Market segments
      • Exhibit 79: Chart on Application - Market share 2023-2028 (%)
      • Exhibit 80: Data Table on Application - Market share 2023-2028 (%)
    • 8.2 Comparison by Application
      • Exhibit 81: Chart on Comparison by Application
      • Exhibit 82: Data Table on Comparison by Application
    • 8.3 Information and communication technology - Market size and forecast 2023-2028
      • Exhibit 83: Chart on Information and communication technology - Market size and forecast 2023-2028 ($ million)
      • Exhibit 84: Data Table on Information and communication technology - Market size and forecast 2023-2028 ($ million)
      • Exhibit 85: Chart on Information and communication technology - Year-over-year growth 2023-2028 (%)
      • Exhibit 86: Data Table on Information and communication technology - Year-over-year growth 2023-2028 (%)
    • 8.4 Displays - Market size and forecast 2023-2028
      • Exhibit 87: Chart on Displays - Market size and forecast 2023-2028 ($ million)
      • Exhibit 88: Data Table on Displays - Market size and forecast 2023-2028 ($ million)
      • Exhibit 89: Chart on Displays - Year-over-year growth 2023-2028 (%)
      • Exhibit 90: Data Table on Displays - Year-over-year growth 2023-2028 (%)
    • 8.5 Photovoltaic - Market size and forecast 2023-2028
      • Exhibit 91: Chart on Photovoltaic - Market size and forecast 2023-2028 ($ million)
      • Exhibit 92: Data Table on Photovoltaic - Market size and forecast 2023-2028 ($ million)
      • Exhibit 93: Chart on Photovoltaic - Year-over-year growth 2023-2028 (%)
      • Exhibit 94: Data Table on Photovoltaic - Year-over-year growth 2023-2028 (%)
    • 8.6 Biophotonics - Market size and forecast 2023-2028
      • Exhibit 95: Chart on Biophotonics - Market size and forecast 2023-2028 ($ million)
      • Exhibit 96: Data Table on Biophotonics - Market size and forecast 2023-2028 ($ million)
      • Exhibit 97: Chart on Biophotonics - Year-over-year growth 2023-2028 (%)
      • Exhibit 98: Data Table on Biophotonics - Year-over-year growth 2023-2028 (%)
    • 8.7 Others - Market size and forecast 2023-2028
      • Exhibit 99: Chart on Others - Market size and forecast 2023-2028 ($ million)
      • Exhibit 100: Data Table on Others - Market size and forecast 2023-2028 ($ million)
      • Exhibit 101: Chart on Others - Year-over-year growth 2023-2028 (%)
      • Exhibit 102: Data Table on Others - Year-over-year growth 2023-2028 (%)
    • 8.8 Market opportunity by Application
      • Exhibit 103: Market opportunity by Application ($ million)
      • Exhibit 104: Data Table on Market opportunity by Application ($ million)

    9 Customer Landscape

    • 9.1 Customer landscape overview
      • Exhibit 105: Analysis of price sensitivity, lifecycle, customer purchase basket, adoption rates, and purchase criteria

    10 Drivers, Challenges, and Trends

    • 10.1 Market drivers
      • 10.2 Market challenges
        • 10.3 Impact of drivers and challenges
          • Exhibit 106: Impact of drivers and challenges in 2023 and 2028
        • 10.4 Market trends

          11 Vendor Landscape

          • 11.1 Overview
            • 11.2 Vendor landscape
              • Exhibit 107: Overview on Criticality of inputs and Factors of differentiation
            • 11.3 Landscape disruption
              • Exhibit 108: Overview on factors of disruption
            • 11.4 Industry risks
              • Exhibit 109: Impact of key risks on business

            12 Vendor Analysis

            • 12.1 Vendors covered
              • Exhibit 110: Vendors covered
            • 12.2 Market positioning of vendors
              • Exhibit 111: Matrix on vendor position and classification
            • 12.3 American Elements
              • Exhibit 112: American Elements - Overview
              • Exhibit 113: American Elements - Product / Service
              • Exhibit 114: American Elements - Key offerings
            • 12.4 ams OSRAM AG
              • Exhibit 115: ams OSRAM AG - Overview
              • Exhibit 116: ams OSRAM AG - Business segments
              • Exhibit 117: ams OSRAM AG - Key offerings
              • Exhibit 118: ams OSRAM AG - Segment focus
            • 12.5 Hamamatsu Photonics KK
              • Exhibit 119: Hamamatsu Photonics KK - Overview
              • Exhibit 120: Hamamatsu Photonics KK - Business segments
              • Exhibit 121: Hamamatsu Photonics KK - Key news
              • Exhibit 122: Hamamatsu Photonics KK - Key offerings
              • Exhibit 123: Hamamatsu Photonics KK - Segment focus
            • 12.6 II VI Inc.
              • Exhibit 124: II VI Inc. - Overview
              • Exhibit 125: II VI Inc. - Business segments
              • Exhibit 126: II VI Inc. - Key news
              • Exhibit 127: II VI Inc. - Key offerings
              • Exhibit 128: II VI Inc. - Segment focus
            • 12.7 Infinera Corp.
              • Exhibit 129: Infinera Corp. - Overview
              • Exhibit 130: Infinera Corp. - Product / Service
              • Exhibit 131: Infinera Corp. - Key offerings
            • 12.8 Intel Corp.
              • Exhibit 132: Intel Corp. - Overview
              • Exhibit 133: Intel Corp. - Business segments
              • Exhibit 134: Intel Corp. - Key news
              • Exhibit 135: Intel Corp. - Key offerings
              • Exhibit 136: Intel Corp. - Segment focus
            • 12.9 IPG Photonics Corp.
              • Exhibit 137: IPG Photonics Corp. - Overview
              • Exhibit 138: IPG Photonics Corp. - Product / Service
              • Exhibit 139: IPG Photonics Corp. - Key offerings
            • 12.10 Lumentum Holdings Inc.
              • Exhibit 140: Lumentum Holdings Inc. - Overview
              • Exhibit 141: Lumentum Holdings Inc. - Business segments
              • Exhibit 142: Lumentum Holdings Inc. - Key offerings
              • Exhibit 143: Lumentum Holdings Inc. - Segment focus
            • 12.11 Molex LLC
              • Exhibit 144: Molex LLC - Overview
              • Exhibit 145: Molex LLC - Product / Service
              • Exhibit 146: Molex LLC - Key offerings
            • 12.12 NEC Corp.
              • Exhibit 147: NEC Corp. - Overview
              • Exhibit 148: NEC Corp. - Business segments
              • Exhibit 149: NEC Corp. - Key news
              • Exhibit 150: NEC Corp. - Key offerings
              • Exhibit 151: NEC Corp. - Segment focus
            • 12.13 Photonic Systems Inc.
              • Exhibit 152: Photonic Systems Inc. - Overview
              • Exhibit 153: Photonic Systems Inc. - Product / Service
              • Exhibit 154: Photonic Systems Inc. - Key offerings
            • 12.14 Polatis Inc.
              • Exhibit 155: Polatis Inc. - Overview
              • Exhibit 156: Polatis Inc. - Product / Service
              • Exhibit 157: Polatis Inc. - Key offerings
            • 12.15 Thorlabs Inc.
              • Exhibit 158: Thorlabs Inc. - Overview
              • Exhibit 159: Thorlabs Inc. - Product / Service
              • Exhibit 160: Thorlabs Inc. - Key offerings
            • 12.16 TRUMPF SE Co. KG
              • Exhibit 161: TRUMPF SE Co. KG - Overview
              • Exhibit 162: TRUMPF SE Co. KG - Product / Service
              • Exhibit 163: TRUMPF SE Co. KG - Key offerings
            • 12.17 Vescent Photonics LLC
              • Exhibit 164: Vescent Photonics LLC - Overview
              • Exhibit 165: Vescent Photonics LLC - Product / Service
              • Exhibit 166: Vescent Photonics LLC - Key offerings

            13 Appendix

            • 13.1 Scope of the report
              • 13.2 Inclusions and exclusions checklist
                • Exhibit 167: Inclusions checklist
                • Exhibit 168: Exclusions checklist
              • 13.3 Currency conversion rates for US$
                • Exhibit 169: Currency conversion rates for US$
              • 13.4 Research methodology
                • Exhibit 170: Research methodology
                • Exhibit 171: Validation techniques employed for market sizing
                • Exhibit 172: Information sources
              • 13.5 List of abbreviations
                • Exhibit 173: List of abbreviations

              Research Methodology

              Technavio presents a detailed picture of the market by way of study, synthesis, and summation of data from multiple sources. The analysts have presented the various facets of the market with a particular focus on identifying the key industry influencers. The data thus presented is comprehensive, reliable, and the result of extensive research, both primary and secondary.

              INFORMATION SOURCES

              Primary sources

              • Manufacturers and suppliers
              • Channel partners
              • Industry experts
              • Strategic decision makers

              Secondary sources

              • Industry journals and periodicals
              • Government data
              • Financial reports of key industry players
              • Historical data
              • Press releases

              DATA ANALYSIS

              Data Synthesis

              • Collation of data
              • Estimation of key figures
              • Analysis of derived insights

              Data Validation

              • Triangulation with data models
              • Reference against proprietary databases
              • Corroboration with industry experts

              REPORT WRITING

              Qualitative

              • Market drivers
              • Market challenges
              • Market trends
              • Five forces analysis

              Quantitative

              • Market size and forecast
              • Market segmentation
              • Geographical insights
              • Competitive landscape

              Interested in this report?

              Get your sample now to see our research methodology and insights!

              Download Now

              Frequently Asked Questions

              Photonicsin US market growth will increase by $ 51.37 mn during 2024-2028.

              The Photonicsin US market is expected to grow at a CAGR of 5.99% during 2024-2028.

              Photonicsin US market is segmented by End-user( Consumer electronics, Building and construction, Safety and defense technology, Medical and healthcare, Others) Product( WDM filters, Optical modulators, Optical interconnects, Photo detectors, Others) Application( Information and communication technology, Displays, Photovoltaic, Biophotonics, Others)

              American Elements, ams OSRAM AG, Hamamatsu Photonics KK, II VI Inc., Infinera Corp., Intel Corp., IPG Photonics Corp., Lumentum Holdings Inc., Molex LLC, NEC Corp., Photonic Systems Inc., Polatis Inc., Thorlabs Inc., TRUMPF SE Co. KG, Vescent Photonics LLC are a few of the key vendors in the Photonicsin US market.

              North America will register the highest growth rate of 100% among the other regions. Therefore, the Photonicsin US market in North America is expected to garner significant business opportunities for the vendors during the forecast period.

              US, North America

              • Emerging silicon-based photonics applicationsEmerging silicon-based photonics applications are driving innovation and shaping the photonics market in US. Silicon photonics is the driving factor this market.
              • leveraging silicons properties to manipulate light is the driving factor this market.
              • offers numerous advantages such as high-speed data transmission is the driving factor this market.
              • energy efficiency is the driving factor this market.
              • and compatibility with existing semiconductor fabrication processes. In the data communication sector is the driving factor this market.
              • silicon photonics enables the development of high-speed is the driving factor this market.
              • low-power optical interconnects for data centers and telecommunications networks. Its integrate with traditional semiconductor technologies facilitates the creation of compact is the driving factor this market.
              • cost-effective solutions for handling the ever-increasing volumes of data. Silicon photonics is revolutionizing sensing technologies is the driving factor this market.
              • particularly in healthcare and environmental monitoring. Its ability to integrate multiple optical functions on a single chip enhances the sensitivity and performance of sensing devices while reducing their size and complexity. Additionally is the driving factor this market.
              • silicon photonics finds applications in emerging fields such as quantum computing is the driving factor this market.
              • where it promises to enable scalable and efficient quantum communication and information processing systems. Thus is the driving factor this market.
              • the emerging silicon-based photonics applications further boost the growth of the photonics market in US during the forecast period. is the driving factor this market.

              The Photonicsin US market vendors should focus on grabbing business opportunities from the Consumer electronics segment as it accounted for the largest market share in the base year.