US Sports Nutrition Market Size 2025-2029
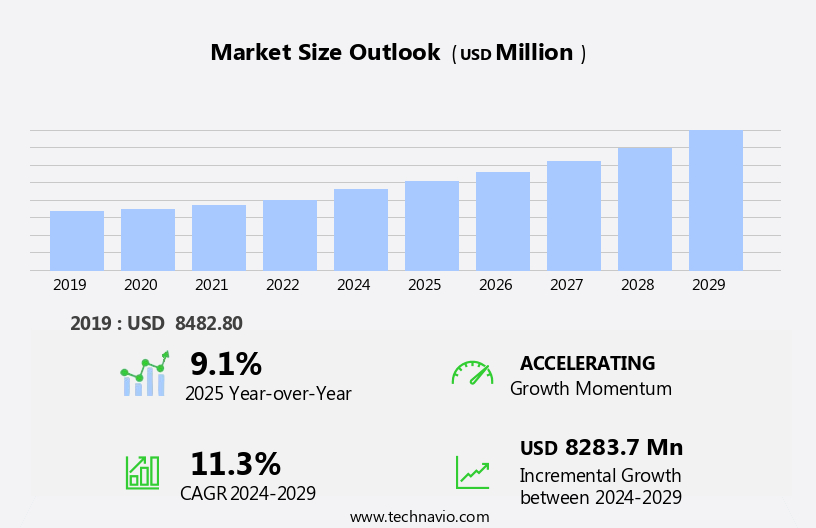
The us sports nutrition market size is forecast to increase by USD 8.28 billion, at a CAGR of 11.3% between 2024 and 2029.
- The Sports Nutrition Market in the US is driven by the growing health and fitness consciousness among consumers, leading to a significant increase in demand for sports nutrition products. This trend is further fueled by the emphasis on functional and performance-enhancing ingredients that cater to the specific nutritional needs of athletes and fitness enthusiasts. However, the market faces challenges related to quality and safety concerns. With the rising demand for sports nutrition products, ensuring their safety and maintaining high-quality standards becomes crucial for market players.
- Addressing these challenges through robust quality control measures, transparency in labeling, and adherence to regulatory guidelines will be essential for companies seeking to capitalize on the market's growth potential. By focusing on innovation, sustainability, and consumer trust, businesses can effectively navigate these challenges and meet the evolving demands of the health-conscious consumer base.
What will be the size of the US Sports Nutrition Market during the forecast period?
Explore in-depth regional segment analysis with market size data - historical 2019-2023 and forecasts 2025-2029 - in the full report.
Request Free Sample
- The sports nutrition market in the US is characterized by a focus on innovation and differentiation. Flavor profiles are increasingly important, with supplement companies striving to create palatable options for consumers. Supplement stacking and ingredient synergy are trends driving product development, as consumers seek to optimize their nutritional intake. Clinical trials and bioavailability studies are crucial for establishing the efficacy and absorption rates of ergogenic aids. Brand differentiation is key, with companies leveraging product packaging and social media marketing to reach consumers. Consumer reviews play a significant role in purchasing decisions, highlighting the importance of transparency and trust.
- Sports psychology and doping control are also significant factors, with companies addressing the mental and physical aspects of athletic performance. Influencer marketing and nutritional timing are emerging trends, with athletes and fitness influencers promoting supplements and emphasizing the importance of proper nutrient intake before, during, and after workouts. Dietary guidelines, muscle protein breakdown, muscle recovery, hormonal regulation, and supplement interactions are all critical areas of focus for performance optimization. Hydration strategies and weight management are also key concerns for athletes, with companies offering a range of supplements and nutritional counseling services to help individuals achieve their goals.
- Injury prevention and glycogen depletion are areas of ongoing research, with companies developing new formulations to address these challenges. Amino acid profiles and personalized nutrition are also gaining traction, as consumers seek to tailor their supplement regimens to their unique needs.
How is this market segmented?
The market research report provides comprehensive data (region-wise segment analysis), with forecasts and estimates in "USD million" for the period 2025-2029, as well as historical data from 2019-2023 for the following segments.
- Distribution Channel
- Offline
- Online
- Product
- Non-protein sports nutrition
- Protein powder
- Protein RTD
- Protein bar
- End-user
- Fitness enthusiasts
- Athletes
- Body builders
- Lifestyle users
- Raw Material
- Animal derived
- Plant-based
- Mixed
- Geography
- North America
- US
- North America
By Distribution Channel Insights
The offline segment is estimated to witness significant growth during the forecast period.
The sports nutrition market in the US is witnessing significant growth due to the increasing number of fitness enthusiasts prioritizing health and wellness. Hydrolyzed protein and post-workout recovery supplements are popular choices for those seeking to enhance their performance and support muscle growth. Food safety standards are of utmost importance to consumers, leading to a demand for vegan options, gluten-free products, and organic ingredients. Vitamins and minerals, fitness trackers, and gym memberships are also integral components of a comprehensive fitness routine. Manufacturers prioritize quality control, supplement safety, and GMP certification to meet consumer preferences. Sustainability initiatives and e-commerce sales are gaining traction, with meal replacement shakes, protein powders, and energy bars among the top-selling products.
Consumers are increasingly interested in amino acid profiling, rice protein, and pea protein, while creatine monohydrate and citrulline malate continue to be popular for strength training. Labeling regulations ensure transparency, and consumers are encouraged to read nutritional information carefully for dosage recommendations. Third-party testing and ingredient sourcing are essential for maintaining trust and brand loyalty. Sports drinks, electrolyte supplements, and soy protein cater to various dietary restrictions and preferences. Marathon runners and competitive sports participants rely on these products for optimal performance and recovery time. Marketing strategies focus on performance enhancement and energy boosting, with protein bars and isolate protein gaining popularity.
Consumers prioritize brands that prioritize their health and offer high-quality, effective products. Sustainability and ethical manufacturing processes are also essential considerations. Overall, the sports nutrition market in the US is a dynamic and evolving landscape that caters to the diverse needs and preferences of fitness enthusiasts.
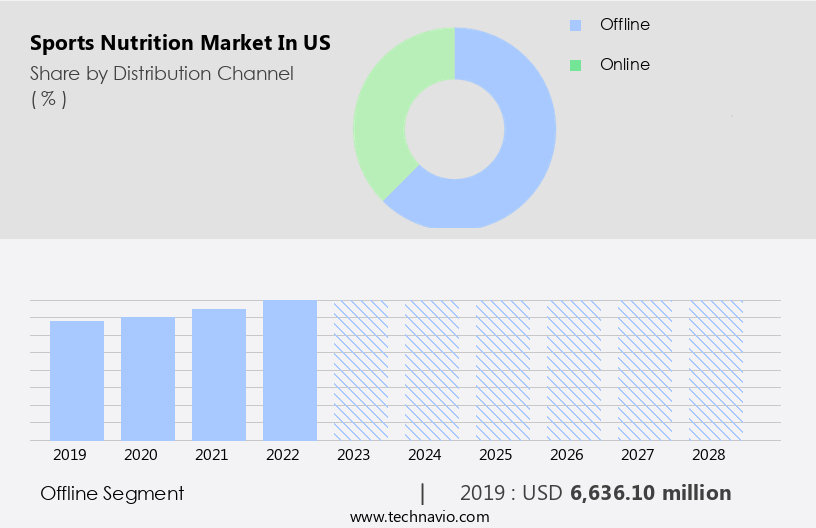
The Offline segment was valued at USD 6636.10 million in 2019 and showed a gradual increase during the forecast period.
Market Dynamics
Our researchers analyzed the data with 2024 as the base year, along with the key drivers, trends, and challenges. A holistic analysis of drivers will help companies refine their marketing strategies to gain a competitive advantage.
What are the US Sports Nutrition Market drivers leading to the rise in adoption of the Industry?
- The increasing emphasis on health and fitness is the primary catalyst fueling market growth.
- In today's health-conscious society, the demand for sports nutrition products continues to grow. Consumers prioritize supplement safety and quality control when selecting these items, leading to a focus on gluten-free and sugar-free options. Manufacturing processes are under scrutiny, with transparency and adherence to regulatory standards being crucial. Performance enhancement is a significant driver of the sports nutrition market. Protein supplements, such as concentrate protein and rice protein, remain popular choices for athletes and fitness enthusiasts seeking to build muscle and aid in recovery. Amino acid profiling is also gaining attention for its role in muscle growth and repair.
- Consumer preferences are shifting towards brands that prioritize nutritional labeling and clear ingredient lists. Energy bars and other convenient, on-the-go options cater to busy lifestyles while maintaining a balance between taste and nutrition. Brand loyalty is essential, with consumers relying on trusted brands to deliver consistent, high-quality products. In conclusion, the sports nutrition market is fueled by the desire for optimal fitness results and overall health. Ensuring product safety, maintaining quality control, and catering to evolving consumer preferences will continue to drive market growth.
What are the US Sports Nutrition Market trends shaping the Industry?
- The focus on functional and performance-enhancing ingredients in sports nutrition is a prevailing market trend. In the realm of professional nutrition, an increasing emphasis is placed on ingredients that enhance athletic performance and contribute to overall wellbeing.
- The sports nutrition market in the US is experiencing significant growth due to the increasing awareness and prioritization of health and fitness. Protein supplements, a key component of sports nutrition, are popular among athletes and fitness enthusiasts for their role in muscle growth, repair, and recovery. Protein powders, shakes, and bars are in high demand to meet this need. Labeling regulations ensure transparency and quality in these products, with certifications such as GMP (Good Manufacturing Practices) adding an extra layer of trust. Pea protein and whey protein are popular choices for their protein digestibility and effectiveness. Marketing strategies often emphasize the importance of post-workout recovery, leading to the popularity of creatine monohydrate and other recovery supplements, such as amino acids and branched-chain amino acids (BCAAs).
- Sustainability initiatives and distribution channels are also crucial factors in the market, with meal replacement shakes and protein bars offering convenient and portable options. Overall, the sports nutrition market continues to evolve, catering to the diverse needs of consumers seeking optimal performance and recovery.
How does US Sports Nutrition Market faces challenges face during its growth?
- The growth of the sports nutrition industry is significantly impacted by the challenges posed by ensuring the quality and safety of these products.
- In the dynamic world of sports nutrition, ensuring the quality and safety of ingredients is paramount. Protein sources, such as soy or electrolyte supplements, must be sourced responsibly and meet purity standards to prevent health risks. Brands face stringent regulations, including those from the Food and Drug Administration (FDA) and the Dietary Supplement Health and Education Act (DSHEA), to maintain transparency and accuracy in labeling. Consumers and athletes demand clear and consistent product information, especially when dealing with pre-workout supplements or recovery time aids. Third-party testing and certification can help build trust and credibility. In the evolving landscape of sports nutrition, brands must prioritize safety, transparency, and consistency to meet the demands of consumers and regulatory bodies alike.
- E-commerce sales continue to surge, making it essential for brands to maintain a strong online presence and adhere to advertising regulations. Micellar casein and other dietary supplements are popular choices for those with dietary restrictions, further expanding the market's reach. Adhering to these standards and maintaining product quality is not only a best practice but a necessity in this competitive industry.
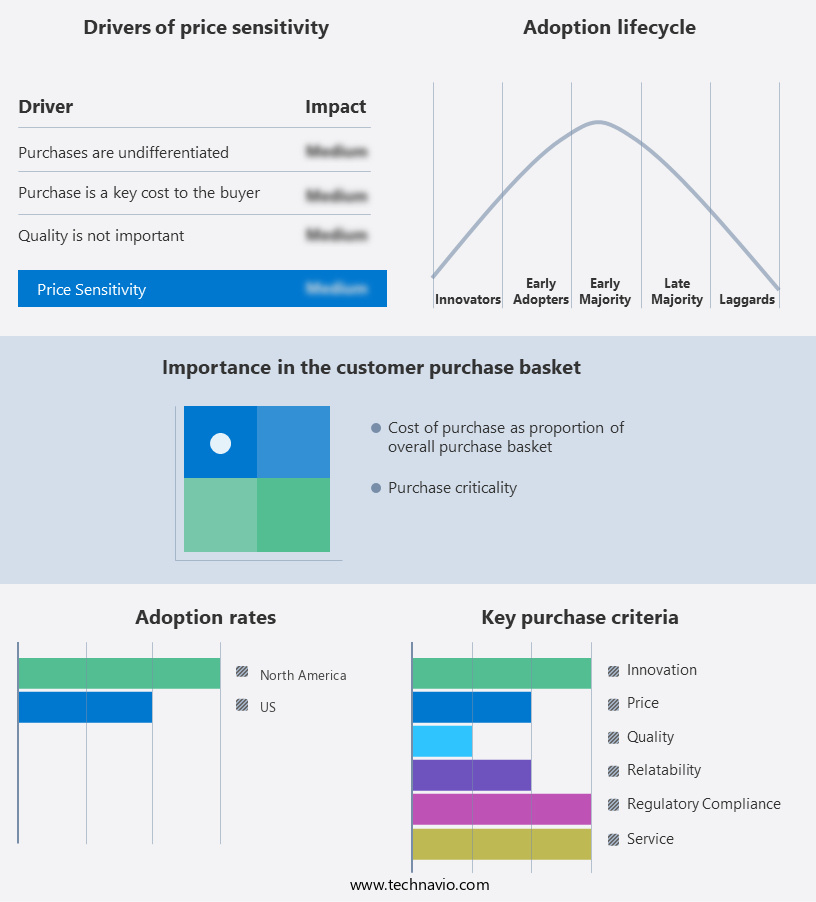
Exclusive US Sports Nutrition Market Customer Landscape
The market forecasting report includes the adoption lifecycle of the market, covering from the innovator’s stage to the laggard’s stage. It focuses on adoption rates in different regions based on penetration. Furthermore, the report also includes key purchase criteria and drivers of price sensitivity to help companies evaluate and develop their market growth analysis strategies.
Customer Landscape
Key Companies & Market Insights
Companies are implementing various strategies, such as strategic alliances, market forecast partnerships, mergers and acquisitions, geographical expansion, and product/service launches, to enhance their presence in the market.
The market research and growth report includes detailed analyses of the competitive landscape of the market and information about key companies, including:
- Abbott Laboratories
- Clif Bar and Co.
- Glanbia plc
- GNC Holdings LLC
- GoodSport Nutrition
- Hormel Foods Corp.
- Ingredion Inc.
- Iovate Health Sciences International Inc.
- Mondelez International Inc.
- Nestle SA
- NOW Foods
- Nutra Solutions USA
- Nutrisport Pharmacal Inc.
- PepsiCo Inc.
- Post Holdings Inc.
- Quest Nutrition and Athletics
- SDC Nutrition Inc.
- The Coca Cola Co.
- Twinlab Consolidated Holdings Inc.
- Woodbolt Distribution LLC
Qualitative and quantitative analysis of companies has been conducted to help clients understand the wider business environment as well as the strengths and weaknesses of key market players. Data is qualitatively analyzed to categorize companies as pure play, category-focused, industry-focused, and diversified; it is quantitatively analyzed to categorize companies as dominant, leading, strong, tentative, and weak.
Recent Development and News in Sports Nutrition Market In US
- In March 2023, Nestle's subsidiary, Gerber Scientific, launched a new line of sports nutrition products under the brand name "G-Squared" (Nestle.Com). This expansion aims to cater to the growing demand for high-protein, conveniently packaged sports nutrition solutions.
- In June 2024, PepsiCo's Quaker Oats division announced a strategic partnership with the National Football League (NFL) to create NFL-branded protein bars and shakes (QuakerOats.Com). This collaboration capitalizes on the NFL's massive fan base and the increasing popularity of sports nutrition products.
- In October 2024, Hormel Foods Corporation acquired the Muscle Milk brand from PepsiCo for approximately USD1.2 billion (BusinessWire.Com). This acquisition strengthens Hormel's position in the sports nutrition market and provides the company with a well-established brand in the space.
- In February 2025, the U.S. Food and Drug Administration (FDA) approved the use of certain plant-based proteins, such as pea protein, as primary ingredients in sports nutrition products (FDA.Gov). This approval opens up new opportunities for plant-based sports nutrition brands and may lead to increased competition in the market.
Research Analyst Overview
The sports nutrition market in the US continues to evolve, driven by the dynamic needs of fitness enthusiasts seeking optimal performance and recovery. This sector encompasses a wide range of products, from post-workout recovery supplements and weight gainers to protein powders, bars, and meal replacement shakes. Food safety standards and consumer preferences shape market activities. Regulations regarding labeling, vitamins and minerals, and ingredient sourcing are paramount. Hydrolyzed protein, pea protein, and soy protein are gaining popularity among vegan and gluten-free consumers. Manufacturers employ various marketing strategies, including sponsorships of competitive sports and fitness influencers, to build brand loyalty. GMP certification and third-party testing ensure product quality and safety.
Protein digestibility, whether in whey, casein, or rice protein, plays a significant role in muscle growth and recovery. Creatine monohydrate and amino acid profiling contribute to performance enhancement. Sustainability initiatives and e-commerce sales are reshaping distribution channels. Consumer preferences for sugar-free, organic, and energy-providing products influence product development. Sports nutrition products cater to various sectors, including gym memberships, strength training, and marathon running. Dosage recommendations and manufacturing processes are essential for effective performance enhancement. Regulations governing dietary supplements and advertising are crucial for ensuring consumer trust and safety. Pre-workout supplements, electrolyte supplements, and meal replacement shakes are essential components of a comprehensive sports nutrition regimen.
In this ever-changing landscape, innovation and adaptation are key to staying competitive. The sports nutrition market's continuous dynamism reflects the ongoing pursuit of peak physical performance and wellness.
Dive into Technavio’s robust research methodology, blending expert interviews, extensive data synthesis, and validated models for unparalleled Sports Nutrition Market in US insights. See full methodology.
|
Market Scope |
|
|
Report Coverage |
Details |
|
Page number |
187 |
|
Base year |
2024 |
|
Historic period |
2019-2023 |
|
Forecast period |
2025-2029 |
|
Growth momentum & CAGR |
Accelerate at a CAGR of 11.3% |
|
Market growth 2025-2029 |
USD 8283.7 million |
|
Market structure |
Fragmented |
|
YoY growth 2024-2025(%) |
9.1 |
|
Competitive landscape |
Leading Companies, Market Positioning of Companies, Competitive Strategies, and Industry Risks |
What are the Key Data Covered in this Market Research Report?
- CAGR of the market during the forecast period
- Detailed information on factors that will drive the market growth and forecasting between 2025 and 2029
- Precise estimation of the size of the market and its contribution of the market in focus to the parent market
- Accurate predictions about upcoming market growth and trends and changes in consumer behaviour
- Growth of the market across US
- Thorough analysis of the market’s competitive landscape and detailed information about companies
- Comprehensive analysis of factors that will challenge the growth of market companies
We can help! Our analysts can customize this market research report to meet your requirements Get in touch
 RIA -
RIA - 
