US Workforce Management Software Market by End-user, Deployment and Application - Forecast and Analysis 2024-2028

US Workforce Management Software Market by End-user, Deployment and Application - Forecast and Analysis 2024-2028

Published: May 2024 170 Pages SKU: IRTNTR77905

Market Overview at a Glance

$1.26 B
Market Opportunity
9.06%
CAGR
8.86
YoY growth 2023-2024(%)

US Workforce Management Software Market Size 2024-2028 

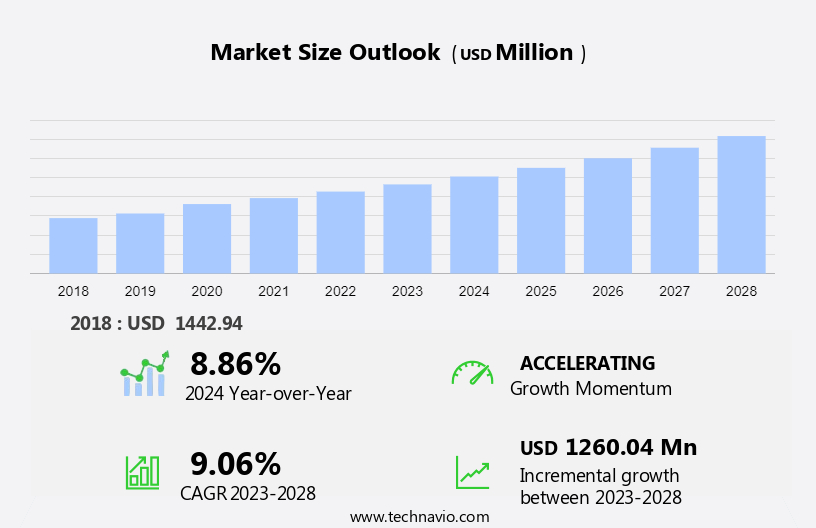
The US workforce management software market size is forecast to increase by USD 1.26 billion at a CAGR of 9.06% between 2023 and 2028. In the US market, the workforce management software sector experiences significant growth due to various drivers. Compliance with regulations, particularly in industries such as Consumer Goods & Retail, Energy & Utilities, and Healthcare, is a primary factor. Additionally, the adoption of advanced workforce analytics, particularly those leveraging Machine Learning, is increasing. However, challenges persist, including high implementation and maintenance costs and integration issues with existing systems. Software-as-a-Service (SaaS) solutions offer potential solutions to these challenges by reducing upfront costs and providing seamless integration. The report provides a comprehensive analysis of these trends and challenges, enabling businesses to make informed decisions in the ever-evolving workforce management landscape. Smartphone adoption is another trend driving the market growth.

What will the size of the market be during the forecast period?

Workforce Management Software Market in US Size

 Request Free Sample

The workforce management software market in the US is witnessing significant growth due to various factors. This market caters to industries such as healthcare, manufacturing, and construction, among others, to optimize their workforce operations. One of the primary drivers for the market is the increasing adoption of cloud-based solutions. Cloud technology offers flexibility, cost savings, and ease of access, making it a preferred choice for businesses. Moreover, the availability of advanced features like AI and machine learning in cloud-based workforce management software is further fueling its demand.

Another factor contributing to the market growth is the rise in remote workforce solutions. With the increasing trend of working from home and flexible work arrangements, businesses are looking for efficient ways to manage their dispersed workforce. Workforce management software with features like time & attendance management, performance & goal management, and absence & leave management help businesses manage their remote workforce effectively. With the widespread use of smartphones, employees can easily clock in and out, view their schedules, and request time off using mobile applications. This not only enhances employee engagement but also streamlines workforce management processes.

Moreover, human resource analytics is gaining popularity in the US market. Businesses are leveraging data analytics to gain insights into their workforce performance, identify trends, and make informed decisions. Workforce management software with advanced analytics capabilities helps businesses optimize their workforce and improve productivity. The US workforce management software market is also witnessing growth due to the increasing focus on compliance and regulatory requirements. Compliance with labor laws and regulations is crucial for businesses to avoid penalties and legal issues. Workforce management software with features like time & attendance tracking and leave management help businesses ensure compliance and reduce the risk of non-compliance.

In conclusion, the workforce management software market in the US is experiencing growth due to various factors such as cloud adoption, remote workforce solutions, smartphone adoption, human resource analytics, and compliance requirements. Businesses across industries are leveraging workforce management software to optimize their workforce operations, improve productivity, and ensure compliance.

Market Segmentation

The market research report provides comprehensive data (region-wise segment analysis), with forecasts and estimates in "USD billion" for the period 2024-2028, as well as historical data from 2018-2022 for the following segments.

  • End-user
    • IT and telecom
    • BFSI
    • Healthcare
    • Manufacturing
    • Others
  • Deployment
    • Cloud
    • On-premises
  • Application
    • Time and attendance
    • Workforce analytics
    • Task management
    • Workforce scheduling
  • Geography
    • US

By End-user Insights

The IT and telecom segment is estimated to witness significant growth during the forecast period. In the US market, the IT and telecommunications sector is witnessing a shift towards advanced workforce management solutions. These companies are prioritizing the acquisition, training, and retention of skilled personnel to align with their business objectives. The implementation of workforce management software is becoming increasingly commonplace in this industry, as it offers flexibility and mobility that cater to the unique demands of the telecom and IT sectors. Adhesive bonding and composite materials are integral to these industries, necessitating a workforce with specialized expertise. Cloud computing technology is enabling the deployment of workforce management software, allowing for real-time data access and streamlined processes.

Additionally, the trend towards hiring independent contractors and freelancers is on the rise, necessitating software solutions that can effectively manage this non-traditional workforce. Telecom and IT organizations are embracing workforce management software to optimize their human capital and improve operational efficiency. This technology enables companies to effectively schedule and manage employee hours, track attendance, and monitor performance, all while ensuring compliance with industry regulations. With the increasing complexity of business functions, the need for efficient workforce management practices is more important than ever.

Workforce Management Software Market in US Size

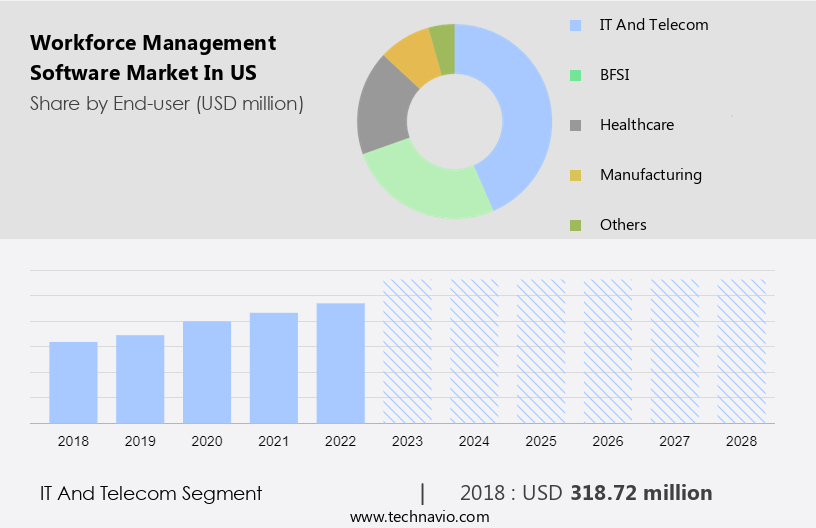
Get a glance at the market share of various segments Request Free Sample

The IT and telecom segment was valued at USD 318.72 million in 2018 and showed a gradual increase during the forecast period.

Our market researchers analyzed the data with 2023 as the base year, along with the key drivers, trends, and challenges. A holistic analysis of drivers will help companies refine their marketing strategies to gain a competitive advantage.

Market Driver

Regulatory compliance associated with workforce management is the key driver of the market. In the US business landscape, large organizations face the challenge of adhering to a multitude of regulations set forth by the US Department of Labor and international bodies. Compliance with these regulations is essential for the long-term success of US companies. Workforce management software has emerged as a solution to help organizations meet these requirements. companies of this software offer compliance management features that are seamlessly integrated, enabling companies to document and track employee activities in accordance with industry and corporate best practices and standards. With the increasing adoption of smartphones and the shift to cloud-based solutions, workforce management software has become more accessible and user-friendly.

Further, two key features of this software are Human Resource Analytics and Performance & Goal Management. Human Resource Analytics provides insights into workforce data, allowing companies to make data-driven decisions. Performance & Goal Management helps organizations set and track employee goals, improving productivity and accountability. Additionally, Absence & Leave Management features ensure accurate and efficient tracking of employee absences, reducing administrative burden and minimizing errors. By implementing workforce management software, US organizations can streamline their operations, improve compliance, and enhance overall performance.

Market Trends

The increasing popularity of advanced workforce analytics is the upcoming trend in the market. In today's business landscape, workforce analytics has emerged as a valuable tool for organizations seeking to optimize human resource management (HRM) and enhance overall performance. By harnessing the power of data derived from employee-related and applicant data, businesses can gain valuable insights into the conditions that foster superior customer service and innovation. Workforce analytics is a comprehensive solution that combines software and guiding metrics to generate statistical models based on workforce data and deliver comprehensive workforce performance measurement and improvement.

Also, this data-driven approach enables enterprises to optimize various aspects of HRM, including recruitment, training and development, compensation and benefits, turnover rates, and time to fill positions. Cloud-based workforce analytics solutions with predictive analytics capabilities offer added benefits such as real-time data access, enhanced accuracy, and improved forecasting abilities. Organizations can leverage these insights to make informed decisions, streamline processes, and ultimately, drive business success.

Market Challenge

High implementation and maintenance costs and integration issues is a key challenge affecting the market growth. Workforce management software is a crucial investment for various industries in the US, including Consumer Goods & Retail, Energy & Utilities, and Healthcare. However, the expense associated with procuring and implementing this Software-as-a-Service (SaaS) solution can pose a significant challenge for organizations. The cost structure encompasses licensing fees, system design and customization, implementation, training, and maintenance costs. Post-acquisition of workforce management software licenses, companies must engage IT personnel for effective implementation. Furthermore, employees require training to optimally utilize the application. Continuous upgrades are essential to remain competitive in the market. However, integration issues persist for numerous end-users during the implementation process.

Further, to address these challenges, it's essential to consider the long-term benefits of workforce management software. These benefits include increased productivity, improved employee engagement, enhanced compliance, and reduced labor costs. By carefully evaluating the total cost of ownership and the potential return on investment, organizations can make an informed decision about implementing a workforce management solution. Incorporating machine learning capabilities in workforce management software can further streamline operations and optimize workforce scheduling. This advanced technology can analyze historical data and predict future labor requirements, enabling organizations to effectively manage their workforce and minimize overstaffing or understaffing.

In conclusion, while the initial investment in workforce management software may seem substantial, the long-term benefits and potential for operational efficiency make it a worthwhile investment for businesses in the US. By considering the total cost of ownership, evaluating the potential return on investment, and implementing machine learning capabilities, organizations can maximize the value of their workforce management software investment.

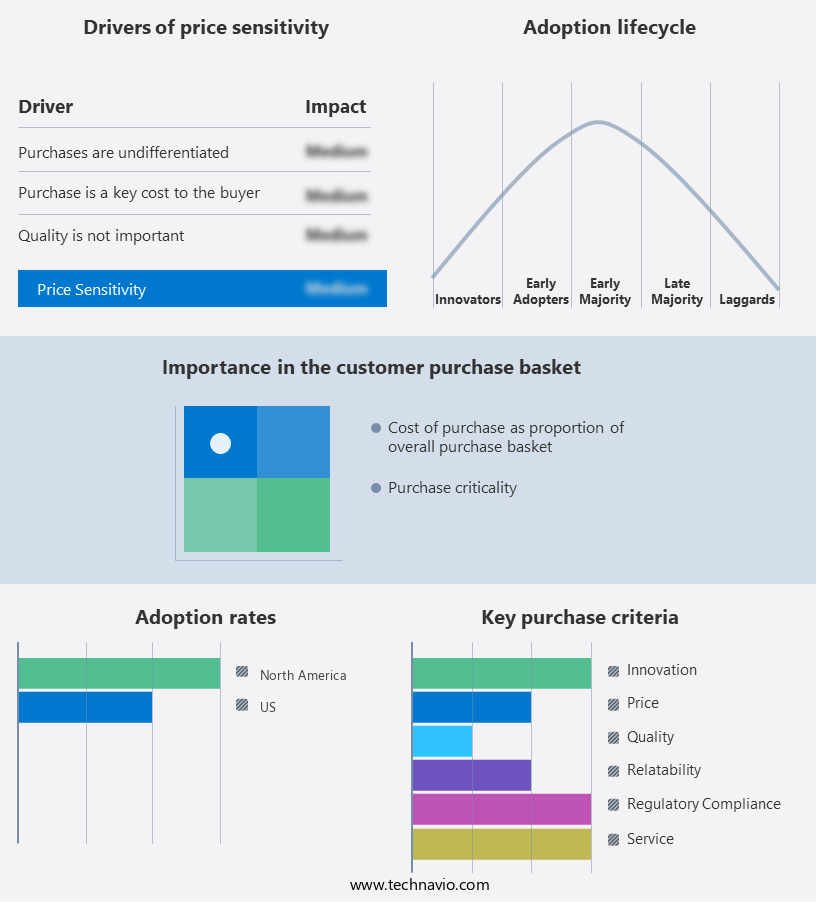
Exclusive Customer Landscape

The market forecasting report includes the adoption lifecycle of the market, covering from the innovator's stage to the laggard's stage. It focuses on adoption rates in different regions based on penetration. Furthermore, the report also includes key purchase criteria and drivers of price sensitivity to help companies evaluate and develop their market growth analysis strategies.

Workforce Management Software Market in US Share by Geography

 Customer Landscape

Key Companies & Market Insights

Companies are implementing various strategies, such as strategic alliances, partnerships, mergers and acquisitions, geographical expansion, and product/service launches, to enhance their presence in the market.

Deputechnologies Pty Ltd.: The company offers Workforce Management software namely Dayforce Workforce Management, which helps in flexible scheduling, prioritizes employee well-being, and helps organizations quickly adapt to change.

The market research and growth report includes detailed analyses of the competitive landscape of the market and information about key companies, including:

  • Blue Yonder Inc.
  • Dayforce Inc.
  • Deputechnologies Pty Ltd.
  • International Business Machines Corp.
  • Koch Industries Inc.
  • Microsoft Corp.
  • Oodles Technologies Pvt Ltd.
  • Oracle Corp.
  • Paycor HCM Inc.
  • PTC Inc.
  • Rippling People Center Inc.
  • SAP SE
  • Softworks Ltd.
  • UKG Inc.
  • Verint Systems Inc.
  • Workday Inc.
  • WorkForce Software LLC
  • Zebra Technologies Corp.
  • Automatic Data Processing Inc.
  • Paychex Inc.

Qualitative and quantitative analysis of companies has been conducted to help clients understand the wider business environment as well as the strengths and weaknesses of key market players. Data is qualitatively analyzed to categorize companies as pure play, category-focused, industry-focused, and diversified; it is quantitatively analyzed to categorize companies as dominant, leading, strong, tentative, and weak.

Research Analyst Overview

The market caters to various industries, including consumer goods and retail, energy and utilities, healthcare, and more. Key drivers for the market include the need for real-time adherence monitoring, flexibility, and mobility. Cloud computing plays a crucial role in enabling these features, with both private and public cloud solutions gaining popularity.  Environmental concerns are also influencing the market, with the adoption of bio-based adhesives and composite materials becoming more common in the production of workforce management software. The Workforce Management Software (WFM) market in the US is growing rapidly, driven by advancements in technologies like Artificial Intelligence (AI) and the Internet of Things (IoT). WFM solutions are crucial for improving employee performance management, time and attendance management, and resource planning. Companies, including service providers in the healthcare and adhesives sectors, are embracing bio-based adhesives to improve sustainability. Private cloud services are increasingly being adopted for better security and scalability, with service level agreements (SLAs) ensuring high standards. Fragmentation in the market encourages international organizations to leverage platforms like UJET WFM on Google Cloud for seamless integration. These innovations enhance supply chain networks, allowing for improved profitability and efficient healthcare infrastructure management.

Market Scope

Report Coverage

Details

Page number

170

Base year

2023

Historic period

2018-2022

Forecast period

2024-2028

Growth momentum & CAGR

Accelerate at a CAGR of 9.06%

Market growth 2024-2028

USD 1.26 billion

Market structure

Fragmented

YoY growth 2023-2024(%)

8.86

Key companies profiled

Blue Yonder Inc., Dayforce Inc., Deputechnologies Pty Ltd., International Business Machines Corp., Koch Industries Inc., Microsoft Corp., Oodles Technologies Pvt Ltd., Oracle Corp., Paycor HCM Inc., PTC Inc., Rippling People Center Inc., SAP SE, Softworks Ltd., UKG Inc., Verint Systems Inc., Workday Inc., WorkForce Software LLC, Zebra Technologies Corp., Automatic Data Processing Inc., and Paychex Inc.

Market dynamics

Parent market analysis, market growth inducers and obstacles, market forecast , fast-growing and slow-growing segment analysis, COVID-19 impact and recovery analysis and future consumer dynamics, market condition analysis for the forecast period

Customization purview

If our market report has not included the data that you are looking for, you can reach out to our analysts and get segments customized.

Competitive landscape

Leading Companies, Market Positioning of Companies, Competitive Strategies, and Industry Risks

Request Free Sample

What are the Key Data Covered in this Market Research Report?

  • CAGR of the market during the forecast period
  • Detailed information on factors that will drive the market growth and forecasting between 2024 and 2028
  • Precise estimation of the size of the market  and its contribution of the market in focus to the parent market
  • Accurate predictions about upcoming market growth and trends and changes in consumer behaviour
  • Growth of the market across US
  • Thorough analysis of the market's competitive landscape and detailed information about companies
  • Comprehensive analysis of factors that will challenge the growth of market companies

We can help! Our analysts can customize this market research report to meet your requirements Get in touch

1 Executive Summary

  • 1.1 Market overview
    • Exhibit 01: Executive Summary – Chart on Market Overview
    • Exhibit 02: Executive Summary – Data Table on Market Overview
    • Exhibit 03: Executive Summary – Chart on Country Market Characteristics
    • Exhibit 04: Executive Summary – Chart on Market Segmentation by End-user
    • Exhibit 05: Executive Summary – Chart on Market Segmentation by Deployment
    • Exhibit 06: Executive Summary – Chart on Market Segmentation by Application
    • Exhibit 07: Executive Summary – Chart on Vendor Market Positioning

2 Market Landscape

  • 2.1 Market ecosystem
    • Exhibit 08: Parent market
    • Exhibit 09: Market Characteristics

3 Market Sizing

  • 3.1 Market definition
    • Exhibit 10: Offerings of vendors included in the market definition
  • 3.2 Market segment analysis
    • Exhibit 11: Market segments
  • 3.3 Market size 2023
    • 3.4 Market outlook: Forecast for 2023-2028
      • Exhibit 12: Chart on US - Market size and forecast 2023-2028 ($ million)
      • Exhibit 13: Data Table on US - Market size and forecast 2023-2028 ($ million)
      • Exhibit 14: Chart on US: Year-over-year growth 2023-2028 (%)
      • Exhibit 15: Data Table on US: Year-over-year growth 2023-2028 (%)

    4 Historic Market Size

    • 4.1 Workforce management software market US 2018 - 2022
      • Exhibit 16: Historic Market Size – Data Table on workforce management software market US 2018 - 2022 ($ million)
    • 4.2 End-user Segment Analysis 2018 - 2022
      • Exhibit 17: Historic Market Size – End-user Segment 2018 - 2022 ($ million)
    • 4.3 Deployment Segment Analysis 2018 - 2022
      • Exhibit 18: Historic Market Size – Deployment Segment 2018 - 2022 ($ million)
    • 4.4 Application Segment Analysis 2018 - 2022
      • Exhibit 19: Historic Market Size – Application Segment 2018 - 2022 ($ million)
    • 4.5 Workforce management software market US by End-user Segment 2023 - 2028
      • Exhibit 20: Market Size (value) - Data Table on Workforce management software market US by End-user Segment 2023 - 2028 ($ million)

    5 Five Forces Analysis

    • 5.1 Five forces summary
      • Exhibit 21: Five forces analysis - Comparison between 2023 and 2028
    • 5.2 Bargaining power of buyers
      • Exhibit 22: Chart on Bargaining power of buyers – Impact of key factors 2023 and 2028
    • 5.3 Bargaining power of suppliers
      • Exhibit 23: Bargaining power of suppliers – Impact of key factors in 2023 and 2028
    • 5.4 Threat of new entrants
      • Exhibit 24: Threat of new entrants – Impact of key factors in 2023 and 2028
    • 5.5 Threat of substitutes
      • Exhibit 25: Threat of substitutes – Impact of key factors in 2023 and 2028
    • 5.6 Threat of rivalry
      • Exhibit 26: Threat of rivalry – Impact of key factors in 2023 and 2028
    • 5.7 Market condition
      • Exhibit 27: Chart on Market condition - Five forces 2023 and 2028

    6 Market Segmentation by End-user

    • 6.1 Market segments
      • Exhibit 28: Chart on End-user - Market share 2023-2028 (%)
      • Exhibit 29: Data Table on End-user - Market share 2023-2028 (%)
    • 6.2 Comparison by End-user
      • Exhibit 30: Chart on Comparison by End-user
      • Exhibit 31: Data Table on Comparison by End-user
    • 6.3 IT and telecom - Market size and forecast 2023-2028
      • Exhibit 32: Chart on IT and telecom - Market size and forecast 2023-2028 ($ million)
      • Exhibit 33: Data Table on IT and telecom - Market size and forecast 2023-2028 ($ million)
      • Exhibit 34: Chart on IT and telecom - Year-over-year growth 2023-2028 (%)
      • Exhibit 35: Data Table on IT and telecom - Year-over-year growth 2023-2028 (%)
    • 6.4 BFSI - Market size and forecast 2023-2028
      • Exhibit 36: Chart on BFSI - Market size and forecast 2023-2028 ($ million)
      • Exhibit 37: Data Table on BFSI - Market size and forecast 2023-2028 ($ million)
      • Exhibit 38: Chart on BFSI - Year-over-year growth 2023-2028 (%)
      • Exhibit 39: Data Table on BFSI - Year-over-year growth 2023-2028 (%)
    • 6.5 Healthcare - Market size and forecast 2023-2028
      • Exhibit 40: Chart on Healthcare - Market size and forecast 2023-2028 ($ million)
      • Exhibit 41: Data Table on Healthcare - Market size and forecast 2023-2028 ($ million)
      • Exhibit 42: Chart on Healthcare - Year-over-year growth 2023-2028 (%)
      • Exhibit 43: Data Table on Healthcare - Year-over-year growth 2023-2028 (%)
    • 6.6 Manufacturing - Market size and forecast 2023-2028
      • Exhibit 44: Chart on Manufacturing - Market size and forecast 2023-2028 ($ million)
      • Exhibit 45: Data Table on Manufacturing - Market size and forecast 2023-2028 ($ million)
      • Exhibit 46: Chart on Manufacturing - Year-over-year growth 2023-2028 (%)
      • Exhibit 47: Data Table on Manufacturing - Year-over-year growth 2023-2028 (%)
    • 6.7 Others - Market size and forecast 2023-2028
      • Exhibit 48: Chart on Others - Market size and forecast 2023-2028 ($ million)
      • Exhibit 49: Data Table on Others - Market size and forecast 2023-2028 ($ million)
      • Exhibit 50: Chart on Others - Year-over-year growth 2023-2028 (%)
      • Exhibit 51: Data Table on Others - Year-over-year growth 2023-2028 (%)
    • 6.8 Market opportunity by End-user
      • Exhibit 52: Market opportunity by End-user ($ million)
      • Exhibit 53: Data Table on Market opportunity by End-user ($ million)

    7 Market Segmentation by Deployment

    • 7.1 Market segments
      • Exhibit 54: Chart on Deployment - Market share 2023-2028 (%)
      • Exhibit 55: Data Table on Deployment - Market share 2023-2028 (%)
    • 7.2 Comparison by Deployment
      • Exhibit 56: Chart on Comparison by Deployment
      • Exhibit 57: Data Table on Comparison by Deployment
    • 7.3 Cloud - Market size and forecast 2023-2028
      • Exhibit 58: Chart on Cloud - Market size and forecast 2023-2028 ($ million)
      • Exhibit 59: Data Table on Cloud - Market size and forecast 2023-2028 ($ million)
      • Exhibit 60: Chart on Cloud - Year-over-year growth 2023-2028 (%)
      • Exhibit 61: Data Table on Cloud - Year-over-year growth 2023-2028 (%)
    • 7.4 On-premises - Market size and forecast 2023-2028
      • Exhibit 62: Chart on On-premises - Market size and forecast 2023-2028 ($ million)
      • Exhibit 63: Data Table on On-premises - Market size and forecast 2023-2028 ($ million)
      • Exhibit 64: Chart on On-premises - Year-over-year growth 2023-2028 (%)
      • Exhibit 65: Data Table on On-premises - Year-over-year growth 2023-2028 (%)
    • 7.5 Market opportunity by Deployment
      • Exhibit 66: Market opportunity by Deployment ($ million)
      • Exhibit 67: Data Table on Market opportunity by Deployment ($ million)

    8 Market Segmentation by Application

    • 8.1 Market segments
      • Exhibit 68: Chart on Application - Market share 2023-2028 (%)
      • Exhibit 69: Data Table on Application - Market share 2023-2028 (%)
    • 8.2 Comparison by Application
      • Exhibit 70: Chart on Comparison by Application
      • Exhibit 71: Data Table on Comparison by Application
    • 8.3 Time and attendance - Market size and forecast 2023-2028
      • Exhibit 72: Chart on Time and attendance - Market size and forecast 2023-2028 ($ million)
      • Exhibit 73: Data Table on Time and attendance - Market size and forecast 2023-2028 ($ million)
      • Exhibit 74: Chart on Time and attendance - Year-over-year growth 2023-2028 (%)
      • Exhibit 75: Data Table on Time and attendance - Year-over-year growth 2023-2028 (%)
    • 8.4 Workforce analytics - Market size and forecast 2023-2028
      • Exhibit 76: Chart on Workforce analytics - Market size and forecast 2023-2028 ($ million)
      • Exhibit 77: Data Table on Workforce analytics - Market size and forecast 2023-2028 ($ million)
      • Exhibit 78: Chart on Workforce analytics - Year-over-year growth 2023-2028 (%)
      • Exhibit 79: Data Table on Workforce analytics - Year-over-year growth 2023-2028 (%)
    • 8.5 Task management - Market size and forecast 2023-2028
      • Exhibit 80: Chart on Task management - Market size and forecast 2023-2028 ($ million)
      • Exhibit 81: Data Table on Task management - Market size and forecast 2023-2028 ($ million)
      • Exhibit 82: Chart on Task management - Year-over-year growth 2023-2028 (%)
      • Exhibit 83: Data Table on Task management - Year-over-year growth 2023-2028 (%)
    • 8.6 Workforce scheduling - Market size and forecast 2023-2028
      • Exhibit 84: Chart on Workforce scheduling - Market size and forecast 2023-2028 ($ million)
      • Exhibit 85: Data Table on Workforce scheduling - Market size and forecast 2023-2028 ($ million)
      • Exhibit 86: Chart on Workforce scheduling - Year-over-year growth 2023-2028 (%)
      • Exhibit 87: Data Table on Workforce scheduling - Year-over-year growth 2023-2028 (%)
    • 8.7 Market opportunity by Application
      • Exhibit 88: Market opportunity by Application ($ million)
      • Exhibit 89: Data Table on Market opportunity by Application ($ million)

    9 Customer Landscape

    • 9.1 Customer landscape overview
      • Exhibit 90: Analysis of price sensitivity, lifecycle, customer purchase basket, adoption rates, and purchase criteria

    10 Drivers, Challenges, and Trends

    • 10.1 Market drivers
      • 10.2 Market challenges
        • 10.3 Impact of drivers and challenges
          • Exhibit 91: Impact of drivers and challenges in 2023 and 2028
        • 10.4 Market trends

          11 Vendor Landscape

          • 11.1 Overview
            • 11.2 Vendor landscape
              • Exhibit 92: Overview on Criticality of inputs and Factors of differentiation
            • 11.3 Landscape disruption
              • Exhibit 93: Overview on factors of disruption
            • 11.4 Industry risks
              • Exhibit 94: Impact of key risks on business

            12 Vendor Analysis

            • 12.1 Vendors covered
              • Exhibit 95: Vendors covered
            • 12.2 Market positioning of vendors
              • Exhibit 96: Matrix on vendor position and classification
            • 12.3 Automatic Data Processing Inc.
              • Exhibit 97: Automatic Data Processing Inc. - Overview
              • Exhibit 98: Automatic Data Processing Inc. - Business segments
              • Exhibit 99: Automatic Data Processing Inc. - Key news
              • Exhibit 100: Automatic Data Processing Inc. - Key offerings
              • Exhibit 101: Automatic Data Processing Inc. - Segment focus
            • 12.4 Dayforce Inc.
              • Exhibit 102: Dayforce Inc. - Overview
              • Exhibit 103: Dayforce Inc. - Product / Service
              • Exhibit 104: Dayforce Inc. - Key news
              • Exhibit 105: Dayforce Inc. - Key offerings
            • 12.5 International Business Machines Corp.
              • Exhibit 106: International Business Machines Corp. - Overview
              • Exhibit 107: International Business Machines Corp. - Business segments
              • Exhibit 108: International Business Machines Corp. - Key news
              • Exhibit 109: International Business Machines Corp. - Key offerings
              • Exhibit 110: International Business Machines Corp. - Segment focus
            • 12.6 Koch Industries Inc.
              • Exhibit 111: Koch Industries Inc. - Overview
              • Exhibit 112: Koch Industries Inc. - Product / Service
              • Exhibit 113: Koch Industries Inc. - Key offerings
            • 12.7 Microsoft Corp.
              • Exhibit 114: Microsoft Corp. - Overview
              • Exhibit 115: Microsoft Corp. - Business segments
              • Exhibit 116: Microsoft Corp. - Key news
              • Exhibit 117: Microsoft Corp. - Key offerings
              • Exhibit 118: Microsoft Corp. - Segment focus
            • 12.8 Oracle Corp.
              • Exhibit 119: Oracle Corp. - Overview
              • Exhibit 120: Oracle Corp. - Business segments
              • Exhibit 121: Oracle Corp. - Key news
              • Exhibit 122: Oracle Corp. - Key offerings
              • Exhibit 123: Oracle Corp. - Segment focus
            • 12.9 Paycor HCM Inc.
              • Exhibit 124: Paycor HCM Inc. - Overview
              • Exhibit 125: Paycor HCM Inc. - Product / Service
              • Exhibit 126: Paycor HCM Inc. - Key news
              • Exhibit 127: Paycor HCM Inc. - Key offerings
            • 12.10 PTC Inc.
              • Exhibit 128: PTC Inc. - Overview
              • Exhibit 129: PTC Inc. - Product / Service
              • Exhibit 130: PTC Inc. - Key news
              • Exhibit 131: PTC Inc. - Key offerings
            • 12.11 Rippling People Center Inc.
              • Exhibit 132: Rippling People Center Inc. - Overview
              • Exhibit 133: Rippling People Center Inc. - Product / Service
              • Exhibit 134: Rippling People Center Inc. - Key offerings
            • 12.12 SAP SE
              • Exhibit 135: SAP SE - Overview
              • Exhibit 136: SAP SE - Business segments
              • Exhibit 137: SAP SE - Key news
              • Exhibit 138: SAP SE - Key offerings
              • Exhibit 139: SAP SE - Segment focus
            • 12.13 UKG Inc.
              • Exhibit 140: UKG Inc. - Overview
              • Exhibit 141: UKG Inc. - Product / Service
              • Exhibit 142: UKG Inc. - Key offerings
            • 12.14 Verint Systems Inc.
              • Exhibit 143: Verint Systems Inc. - Overview
              • Exhibit 144: Verint Systems Inc. - Product / Service
              • Exhibit 145: Verint Systems Inc. - Key offerings
            • 12.15 Workday Inc.
              • Exhibit 146: Workday Inc. - Overview
              • Exhibit 147: Workday Inc. - Product / Service
              • Exhibit 148: Workday Inc. - Key news
              • Exhibit 149: Workday Inc. - Key offerings
            • 12.16 WorkForce Software LLC
              • Exhibit 150: WorkForce Software LLC - Overview
              • Exhibit 151: WorkForce Software LLC - Product / Service
              • Exhibit 152: WorkForce Software LLC - Key offerings
            • 12.17 Zebra Technologies Corp.
              • Exhibit 153: Zebra Technologies Corp. - Overview
              • Exhibit 154: Zebra Technologies Corp. - Business segments
              • Exhibit 155: Zebra Technologies Corp. - Key news
              • Exhibit 156: Zebra Technologies Corp. - Key offerings
              • Exhibit 157: Zebra Technologies Corp. - Segment focus

            13 Appendix

            • 13.1 Scope of the report
              • 13.2 Inclusions and exclusions checklist
                • Exhibit 158: Inclusions checklist
                • Exhibit 159: Exclusions checklist
              • 13.3 Currency conversion rates for US$
                • Exhibit 160: Currency conversion rates for US$
              • 13.4 Research methodology
                • Exhibit 161: Research methodology
                • Exhibit 162: Validation techniques employed for market sizing
                • Exhibit 163: Information sources
              • 13.5 List of abbreviations
                • Exhibit 164: List of abbreviations

              Research Methodology

              Technavio presents a detailed picture of the market by way of study, synthesis, and summation of data from multiple sources. The analysts have presented the various facets of the market with a particular focus on identifying the key industry influencers. The data thus presented is comprehensive, reliable, and the result of extensive research, both primary and secondary.

              INFORMATION SOURCES

              Primary sources

              • Manufacturers and suppliers
              • Channel partners
              • Industry experts
              • Strategic decision makers

              Secondary sources

              • Industry journals and periodicals
              • Government data
              • Financial reports of key industry players
              • Historical data
              • Press releases

              DATA ANALYSIS

              Data Synthesis

              • Collation of data
              • Estimation of key figures
              • Analysis of derived insights

              Data Validation

              • Triangulation with data models
              • Reference against proprietary databases
              • Corroboration with industry experts

              REPORT WRITING

              Qualitative

              • Market drivers
              • Market challenges
              • Market trends
              • Five forces analysis

              Quantitative

              • Market size and forecast
              • Market segmentation
              • Geographical insights
              • Competitive landscape

              Interested in this report?

              Get your sample now to see our research methodology and insights!

              Download Now

              Frequently Asked Questions

              Workforce Management Softwarein US market growth will increase by $ 1260.04 mn during 2024-2028 .

              The Workforce Management Softwarein US market is expected to grow at a CAGR of 9.06% during 2024-2028 .

              Workforce Management Softwarein US market is segmented by End-user( IT and telecom, BFSI, Healthcare, Manufacturing, Others) Deployment( Cloud, On-premises) Application( Time and attendance, Workforce analytics, Task management, Workforce scheduling)

              Blue Yonder Inc., Dayforce Inc., Deputechnologies Pty Ltd., International Business Machines Corp., Koch Industries Inc., Microsoft Corp., Oodles Technologies Pvt Ltd., Oracle Corp., Paycor HCM Inc., PTC Inc., Rippling People Center Inc., SAP SE, Softworks Ltd., UKG Inc., Verint Systems Inc., Workday Inc., WorkForce Software LLC, Zebra Technologies Corp., Automatic Data Processing Inc., Paychex Inc. are a few of the key vendors in the Workforce Management Softwarein US market.

              North America will register the highest growth rate of 100% among the other regions. Therefore, the Workforce Management Softwarein US market in North America is expected to garner significant business opportunities for the vendors during the forecast period.

              US, North America

              • Regulatory compliance associated with workforce managementLarge organizations in the US need to comply with all the regulations related to workforce management enacted in the US in addition to international regulations. Regulatory compliance is vital for the long-term success of US companies that are regulated by the US Department of Labor. Therefore is the driving factor this market.
              • with the implementation of workforce management software is the driving factor this market.
              • end-users can comply with industry and corporate quality and regulatory standards. Most market vendors offer compliance management features that are integrated with workforce management software and are easy to use is the driving factor this market.
              • helping companies attain and sustain compliance every year. With regard to US Department of Labor compliance requirements is the driving factor this market.
              • companies need to implement and document employee activities to ensure that their performance is in accordance with industry and company best practices and standards. Some regulations that facilitate the adoption of workforce management software in the US are: Fair Labor Standards Act (FLSA) Family and Medical Leave Act (FMLA) Affordable Care Act Sarbanes-Oxley (SOX) California Labor Laws in California is the driving factor this market.
              • US In addition to national and state labor laws is the driving factor this market.
              • there are union rules is the driving factor this market.
              • employment contracts is the driving factor this market.
              • local ordinances is the driving factor this market.
              • and company policies that require tracking and compliance. Therefore is the driving factor this market.
              • compliance associated with workforce management regulations is expected to drive the growth of the workforce management software market in US during the forecast period. is the driving factor this market.

              The Workforce Management Softwarein US market vendors should focus on grabbing business opportunities from the IT and telecom segment as it accounted for the largest market share in the base year.