USB Type-C Market Size 2025-2029
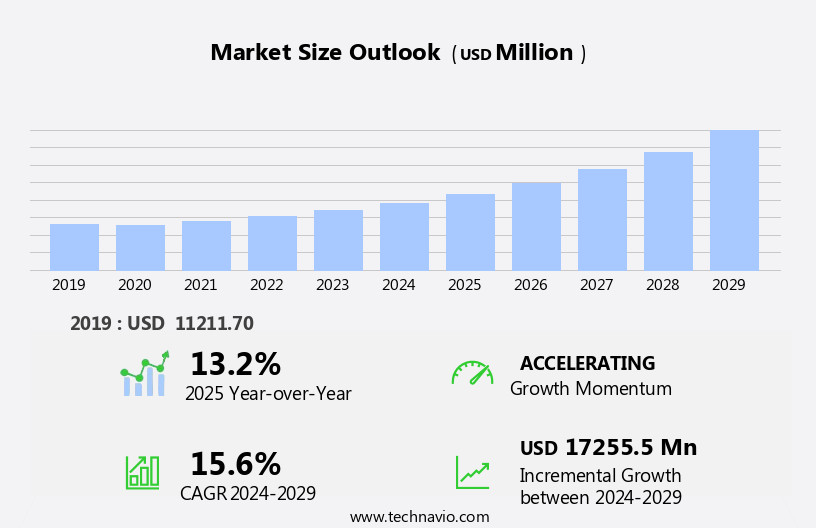
The USB Type-C market size is forecast to increase by USD 17.26 billion at a CAGR of 15.6% between 2024 and 2029.
- The market is experiencing significant growth, driven by the increasing adoption of premium smartphones in emerging markets and the expanding penetration of wireless charging outlets. These trends are fueled by the advantages offered by USB Type-C technology, including faster data transfer rates, improved power delivery capabilities, and reversible connectors. However, market expansion is not without challenges. Regulatory hurdles impact adoption, as various regulatory bodies continue to establish standards and guidelines for the implementation of USB Type-C technology. Furthermore, fluctuations in prices of raw materials and rising operational costs pose significant challenges to market growth. The market is experiencing significant growth due to the increasing demand for computer peripherals and the need for high-capacity solutions. The emergence of cloud storage services is also driving market expansion. In terms of connector types, USB Type-C is gaining popularity due to its fast data transfer rates and compatibility with various devices.
- To capitalize on market opportunities and navigate these challenges effectively, companies must stay informed of regulatory developments and invest in cost-effective manufacturing processes. By doing so, they can maintain a competitive edge and meet the growing demand for USB Type-C technology in the global market.
What will be the Size of the USB Type-C Market during the forecast period?
- The Universal Serial Bus (USB) Type-C market is experiencing significant growth due to its multi-device support and compact design. This interface standard offers a reversible connector, providing single-port convenience for both data transmission and power delivery. Peripheral devices, including portable gaming consoles, laptop computers, mobile devices, audio devices, digital cameras, and even medical devices, are increasingly adopting USB Type-C for enhanced user experience.
- The USB Implementers Forum (USB-IF) is driving the development of power delivery standards, enabling fast charging and high-speed data transfer. Additionally, USB Type-C supports video output and Ethernet connectivity, making it a versatile solution for consumer electronics. With its ability to power devices and deliver data at high speeds, USB Type-C is revolutionizing electronic device development.
How is this USB Type-C Industry segmented?
The USB Type-C industry research report provides comprehensive data (region-wise segment analysis), with forecasts and estimates in "USD million" for the period 2025-2029, as well as historical data from 2019-2023 for the following segments.
- Product Type
- Charger
- Cable
- Adaptor
- Others
- Application
- Consumer electronics
- Automotive
- Healthcare
- Industrial automation
- Others
- Speed
- 10 Gbps
- 20 Gbps
- 40 Gbps
- 80 Gbps
- Geography
- North America
- US
- Canada
- Europe
- France
- Germany
- Italy
- UK
- APAC
- China
- India
- Japan
- South Korea
- Rest of World (ROW)
- North America
By Product Type Insights
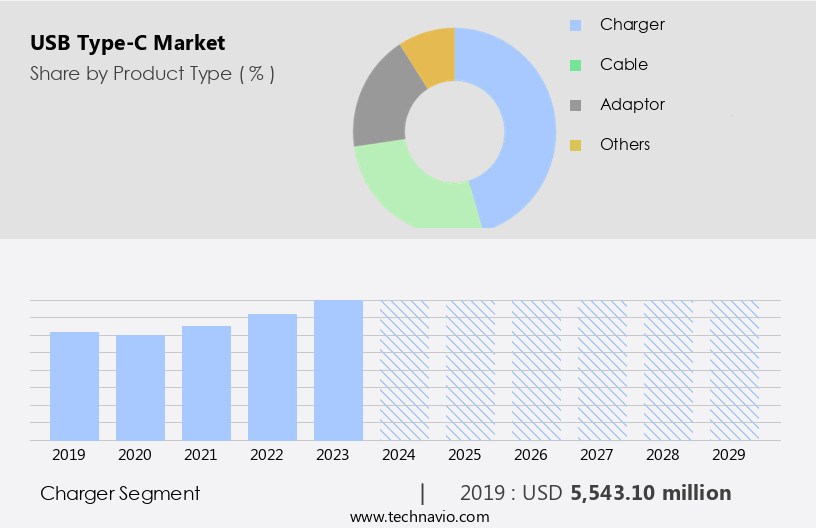
The charger segment is estimated to witness significant growth during the forecast period. The USB-C market is experiencing significant growth due to the increasing adoption of USB-C enabled devices such as laptops, monitors, gaming consoles, tablets, smartphones, and peripherals. One of the key drivers for this growth is the benefits of USB-C Power Delivery (PD), which enables fast charging and reverse charging capabilities. This technology is particularly appealing to consumers who use multiple devices throughout the day and require efficient charging solutions. The USB-C PD ecosystem includes a range of accessories such as wireless chargers, multi-port adapters, charging bricks, and power banks. The market for USB-C PD chargers is expected to grow as more consumers invest in these devices to keep their USB-C enabled devices charged. The market represents a significant segment of the consumer electronics industry, encompassing a range of peripheral devices that facilitate data transfer and connectivity between digital devices and computers
Additionally, USB-C is being used in docking stations, hubs, and dongles to provide users with more connectivity options. The USB-C market is expected to continue growing as more devices adopt the technology and new applications emerge. The future of USB-C PD includes advancements in charging technology, such as higher power delivery profiles and faster charging speeds. Overall, the USB-C market is an exciting and dynamic space, offering consumers and businesses a versatile and efficient solution for powering and connecting their devices.
The Charger segment was valued at USD 5.54 billion in 2019 and showed a gradual increase during the forecast period. The use of USB-C for data transfer is another factor contributing to the market's growth, with data transfer speeds up to 40 Gbps. USB-C's versatility is further enhanced by its support for alternate modes such as HDMI, DisplayPort, and Ethernet. This allows users to connect their devices to external displays, high-speed networks, and other peripherals with ease. The market for USB-C to HDMI, USB-C to DisplayPort, and USB-C to Ethernet adapters is expected to grow as more consumers seek to expand their device capabilities. The automotive industry is also embracing USB-C, with USB-C car chargers gaining popularity due to their fast charging capabilities. StartFragment The USB Type-C Market is evolving rapidly, driven by advancements in USB power delivery and universal USB-C connectors.
The demand for Type-C cables is rising with improved power charging capabilities for smartphone charging, laptop charging, and tablet charging. Enhanced charging current and voltage output optimize performance, supported by robust power delivery protocols. Expanding applications in computing devices, wearable devices, and automotive electronics highlight the need for efficient USB-C ports. Accessories like USB-C hubs, USB-C adapters, and USB-C docking stations ensure seamless multi-device charging. Superior connector design, signal integrity, and cable longevity bolster connector durability. Features like reverse connectivity, plug orientation, and device compatibility accelerate industry adoption. The growing use of USB PD, Qi standard, and USB Type-C to HDMI, DisplayPort, and Ethernet solutions further solidifies its market presence.
Regional Analysis
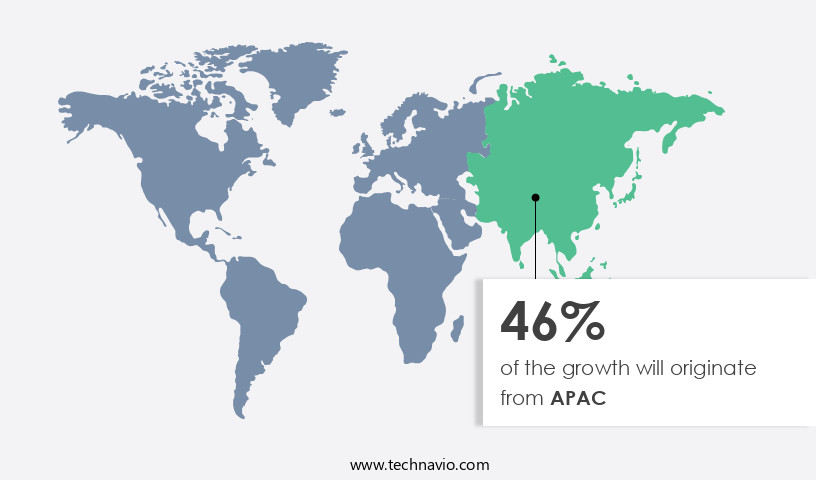
APAC is estimated to contribute 46% to the growth of the global market during the forecast period. Technavio's analysts have elaborately explained the regional trends and drivers that shape the market during the forecast period.
The USB-C market in the consumer electronics sector has experienced significant growth in recent years, particularly in the Asia Pacific (APAC) region. With countries like India and China driving demand for devices such as USB-C laptops, monitors, tablets, smartphones, and accessories, the market is expected to continue its expansion. USB-C technology offers numerous benefits, including fast data transfer speeds, power delivery capabilities, and alternate modes for video output. Companies in the region are innovating to meet consumer needs, introducing USB-C peripherals such as wireless chargers, multi-port adapters, and docking stations. Power delivery standards enable fast charging and reverse charging, making USB-C a versatile and convenient solution for consumers.
USB-C is also being adopted by gaming consoles and PD applications, further expanding its reach. Innovations like HDMI alternate mode, DisplayPort alternate mode, and the PD roadmap are pushing the boundaries of what USB-C can do. The market for USB-C accessories, such as cables, hubs, and charging bricks, is also growing rapidly to support the increasing number of USB-C devices. As the market evolves, USB-C is becoming the go-to standard for connectivity, offering a user experience.
Market Dynamics
Our researchers analyzed the data with 2024 as the base year, along with the key drivers, trends, and challenges. A holistic analysis of drivers will help companies refine their marketing strategies to gain a competitive advantage.
What are the USB Type-C market drivers leading to the rise in the adoption of Industry?
- In emerging markets, the rising preference for premium smartphones serves as the primary catalyst for market growth. The market is experiencing significant growth due to the increasing adoption of USB-C enabled devices, particularly USB-C laptops. This trend is driven by the benefits offered by USB-C Power Delivery (PD), which enables fast charging and power delivery. Additionally, the market is expanding with the introduction of USB-C Ethernet, USB-C monitors, USB-C wireless chargers, and USB-C car chargers. Multi-port adapters are also gaining popularity, allowing users to charge multiple devices and transfer data simultaneously. Furthermore, the market is witnessing an increase in demand for Type-C to Lightning, Type-C to Micro-USB, Type-C to DVI, and other converters, facilitating interoperability between different devices.
- Data transfer speeds of up to 40Gbps are possible with USB-C, making it an attractive option for gaming consoles and other data-intensive applications. Overall, the market is poised for continued growth as more devices adopt this versatile and high-performance standard.
What are the USB Type-C market trends shaping the Industry?
- The increasing prevalence of wireless charging outlets represents a significant market trend. This development signifies a shift towards more convenient and contactless charging solutions. The market is experiencing significant growth due to the increasing demand for USB-C PD applications, including USB-C to VGA and USB-C audio. Power Delivery standards enable fast charging and data transfer, making USB-C a preferred choice for various devices. The USB-C PD future holds promise with the increasing availability of USB-C peripherals, such as tablets and power banks, which offer compatibility with multiple devices. USB-C connectors are increasingly being adopted for Type-C to HDMI and other applications, expanding the market's reach.
- Power Delivery profiles enable flexible power delivery, ensuring compatibility with various devices and charging requirements. USB-C accessories, including wireless chargers, are gaining popularity due to their convenience and compatibility advantages. The global preference for wireless charging solutions is driving the market's growth, eliminating the need for dedicated power adaptors and offering a common charging platform for various devices.
How does USB Type-C market faces challenges face during its growth?
- The industry's growth is significantly impacted by the volatility in raw material prices and escalating operational costs, which pose a substantial challenge. The market dynamics revolve around various factors influencing the pricing of USB-C charging bricks, Type-C to DisplayPort adapters, and USB-C PD solutions. Production costs, primarily driven by labor, raw materials, and transportation expenses, significantly impact the market. Raw material prices, particularly for steel, plastic, and electronic components, are subject to volatility due to availability and currency exchange rate fluctuations. These fluctuations directly affect the cost of production and, subsequently, the profit margins of manufacturers. Fast charging and USB-C PD technology features are increasingly popular, driving demand for USB-C PD chargers and docking stations.
- Additionally, HDMI Alternate Mode and DisplayPort Alternate Mode are gaining traction, expanding the market's application scope. Reverse charging is another emerging trend, adding versatility to USB-C devices. Despite these advancements, the market remains competitive, with manufacturers striving to offer high-quality, cost-effective solutions.
Exclusive Customer Landscape
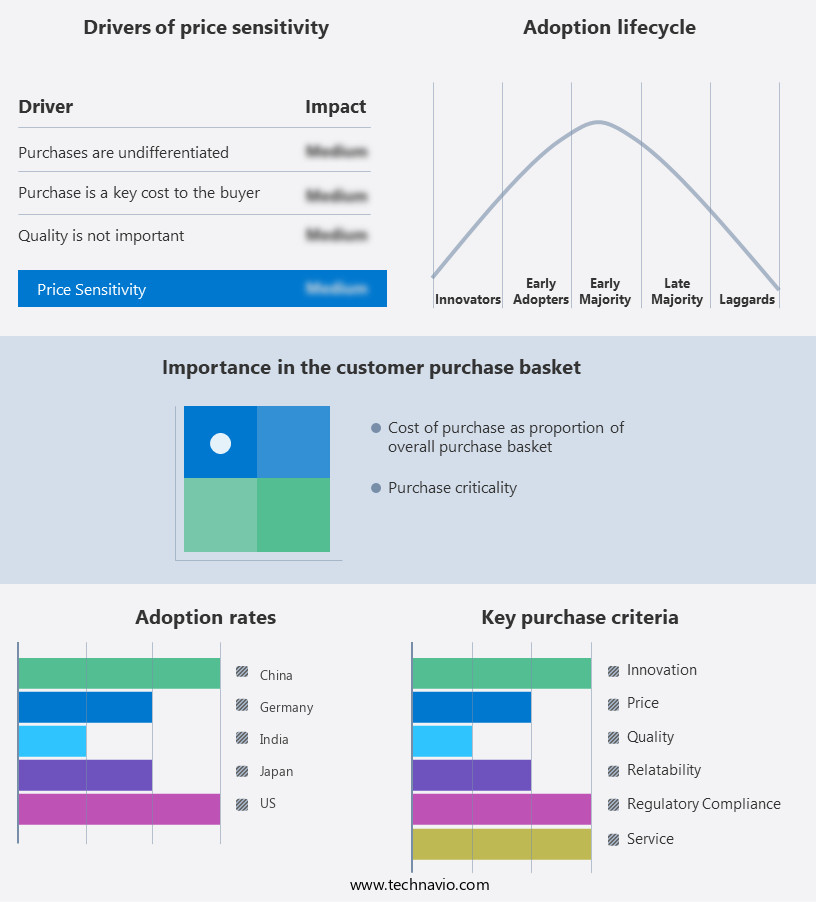
The USB Type-C market forecasting report includes the adoption lifecycle of the market, covering from the innovator's stage to the laggard's stage. It focuses on adoption rates in different regions based on penetration. Furthermore, the USB Type-C market report also includes key purchase criteria and drivers of price sensitivity to help companies evaluate and develop their market growth analysis strategies.
Customer Landscape
Key Companies & Market Insights
Companies are implementing various strategies, such as strategic alliances, USB Type-C market forecast, partnerships, mergers and acquisitions, geographical expansion, and product/service launches, to enhance their presence in the industry.
AUK - The company specializes in providing a range of USB-C solutions, including BoostCharge, Thunderbolt 3, BoostCharge Flex, and braided USB C to USB A cables.
The industry research and growth report includes detailed analyses of the competitive landscape of the market and information about key companies, including:
- AUK
- Belkin International Inc.
- Bright Industries
- ByteCable
- Cabledo
- Diodes Inc.
- Farreach Electronic Co., Ltd.
- HIROSE ELECTRIC Co. Ltd.
- Hon Hai Precision Industry Co. Ltd.
- Infineon Technologies AG
- MediaTek Inc.
- Microchip Technology Inc.
- Moke International Group Ltd.
- NXP Semiconductors NV
- ON Semiconductor Corp.
- Renesas Electronics Corp.
- Shenzhen STC Cable
- Silicon Laboratories Inc.
- STMicroelectronics NV
- Texas Instruments Inc.
Qualitative and quantitative analysis of companies has been conducted to help clients understand the wider business environment as well as the strengths and weaknesses of key industry players. Data is qualitatively analyzed to categorize companies as pure play, category-focused, industry-focused, and diversified; it is quantitatively analyzed to categorize companies as dominant, leading, strong, tentative, and weak.
Recent Development and News in USB Type-C Market
- In February 2023, Intel and Microsoft announced a strategic partnership to promote the widespread adoption of USB4 and Thunderbolt technologies using USB Type-C connectors. This collaboration aims to accelerate the integration of these high-speed interfaces into various devices, including laptops, desktops, and peripherals (Intel Press Release, 2023).
- In July 2024, Apple unveiled the iPhone 15 series, marking the first time the tech giant adopted USB-C as the sole charging port, replacing the proprietary Lightning port. This move significantly expanded the USB Type-C ecosystem and boosted the demand for USB-C compatible accessories (Apple Inc., 2024).
- In October 2024, Samsung and Sony announced a joint venture to develop advanced USB Type-C components, aiming to increase their market share and improve product offerings. The collaboration will focus on research and development of high-speed data transfer and power delivery technologies (Samsung Press Release, 2024).
- In January 2025, the European Union passed a regulation mandating the adoption of USB-C as the standard charging port for all mobile devices, digital cameras, headphones, and portable speakers. This regulatory initiative is expected to create a unified charging standard and reduce electronic waste (European Commission, 2025).
Research Analyst Overview
The market continues to evolve, with new applications and technologies unfolding across various sectors. USB-C PD (Power Delivery) has emerged as a significant trend, offering benefits such as fast charging, power delivery, and data transfer. USB-C PD is not limited to laptops but is also finding applications in monitors, tablets, gaming consoles, and power banks. Type-C to VGA and HDMI converters enable the use of older display technologies with modern devices, expanding the reach of USB-C. USB-C audio solutions offer high-quality sound output, while PD compatibility ensures seamless charging and data transfer between devices. USB-C connectors come in various forms, including Type-C to Lightning, Micro-USB, DVI, and DisplayPort, catering to diverse connectivity needs. The market is also influenced by the growing Internet of Things (IoT) trend.
Power delivery profiles enable flexible charging solutions, from fast charging to reverse charging. USB-C PD solutions are also finding their way into accessories such as dongles, hubs, charging bricks, and power adapters. The future of USB-C PD looks promising, with advancements in PD technology and implementations continuing to shape the market landscape. USB-C PD applications are not limited to consumer electronics but are also gaining traction in industrial and automotive sectors. The USB-C ecosystem is expanding rapidly, with new devices and solutions being introduced regularly. USB-C PD charging bricks and wall chargers offer efficient and fast charging solutions, while USB-C PD chargers cater to the power needs of high-performance devices. In healthcare, USB devices are essential for medical imaging equipment, DDR5 DRAM, and other medical applications.
USB-C cables offer durability and flexibility, making them a preferred choice for data transfer and charging. The USB-C PD roadmap outlines ongoing advancements in power delivery and data transfer speeds, ensuring that the market remains dynamic and innovative. USB-C PD solutions continue to redefine the way we charge and connect our devices, offering a seamless and efficient user experience. StartFragment The USB Type-C Market continues to expand with the adoption of the Type-C interface, ensuring connector reliability and superior cable quality. Advances in charging efficiency and multiprotocol support drive futureproofing technology, aligning with emerging standards. The growing device ecosystem and increasing market penetration highlight innovation in charging, particularly high-power charging and wireless charging integration. Enhanced data transfer protocols and alternate mode capabilities improve functionality, while connector longevity follows evolving design trends and ergonomic considerations. Focus on sustainability considerations and reduced environmental impact leads to extended cable lifespan and optimized device functionality. Strengthened data security and device safety ensure reliable connections, reinforcing USB Type-C's position as the preferred industry standard for efficient and versatile connectivity.
EndFragment
Dive into Technavio's strong research methodology, blending expert interviews, extensive data synthesis, and validated models for unparalleled USB Type-C Market insights. See full methodology.
|
Market Scope |
|
|
Report Coverage |
Details |
|
Page number |
233 |
|
Base year |
2024 |
|
Historic period |
2019-2023 |
|
Forecast period |
2025-2029 |
|
Growth momentum & CAGR |
Accelerate at a CAGR of 15.6% |
|
Market growth 2025-2029 |
USD 17.26 billion |
|
Market structure |
Fragmented |
|
YoY growth 2024-2025(%) |
13.2 |
|
Key countries |
China, US, Canada, India, Japan, UK, South Korea, Germany, Italy, and France |
|
Competitive landscape |
Leading Companies, Market Positioning of Companies, Competitive Strategies, and Industry Risks |
What are the Key Data Covered in this USB Type-C Market Research and Growth Report?
- CAGR of the USB Type-C industry during the forecast period
- Detailed information on factors that will drive the growth and forecasting between 2025 and 2029
- Precise estimation of the size of the market and its contribution of the industry in focus to the parent market
- Accurate predictions about upcoming growth and trends and changes in consumer behaviour
- Growth of the market across APAC, North America, Europe, Middle East and Africa, and South America
- Thorough analysis of the market's competitive landscape and detailed information about companies
- Comprehensive analysis of factors that will challenge the USB Type-C market growth of industry companies
We can help! Our analysts can customize this USB Type-C market research report to meet your requirements.


