UV Lamp Market Size 2025-2029
The UV lamp market size is forecast to increase by USD 573.8 million, at a CAGR of 14% between 2024 and 2029.
Major Market Trends & Insights
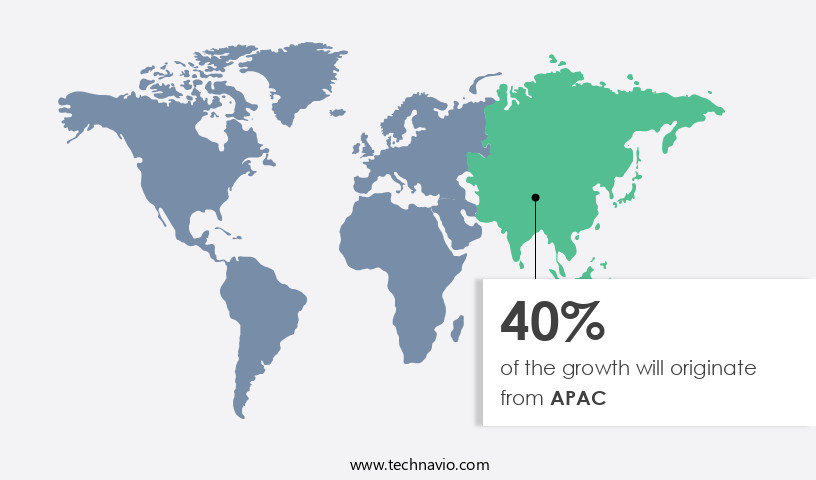
- APAC dominated the market and accounted for a 40% growth during the forecast period.
- By the Product - Mercury-based UV lamps segment was valued at USD 265.90 million in 2023
- By the Application - UV Curing segment accounted for the largest market revenue share in 2023
Market Size & Forecast
- Market Opportunities: USD 164.02 million
- Market Future Opportunities: USD 573.80 million
- CAGR : 14%
- APAC: Largest market in 2023
Market Summary
- The market is experiencing a significant shift towards UV light-emitting diodes (LEDs) due to their advantages in energy efficiency and longer lifespan. According to industry reports, the UV LED market is projected to grow at a steady pace, with a compound annual growth rate (CAGR) comparable to mercury-based UV lamps. This transition is driven by advancements in LED technology, which has led to a reduction in the cost of ownership and increased reliability. The shift from mercury-based UV lamps to UV LEDs is also being fueled by growing concerns over the health hazards associated with the mercury content in traditional UV lamps.
- This trend is observable across various sectors, including water treatment, industrial manufacturing, and medical applications. The market is expected to continue evolving, with innovations in LED technology and expanding applications driving future growth.
What will be the Size of the UV Lamp Market during the forecast period?

Explore market size, adoption trends, and growth potential for UV lamp market Request Free Sample
- The market encompasses a diverse range of applications, from degradation prevention in industrial processes to water disinfection and surface sterilization. UV lamp components, such as sensors, ballasts, and filters, play crucial roles in ensuring optimal performance and longevity. UV light penetration is a significant factor in disinfection protocols, with UV-C light sources offering the shortest wavelength and highest germicidal effectiveness. UV lamp durability is a critical concern, with emissions and sterilization effectiveness influenced by factors like lamp materials, circuit design, and cleaning procedures. For instance, a UV lamp with a high-quality reflector and efficient calibration can significantly improve treatment time and configurations.
- In water disinfection, UV lamp installations typically require minimal treatment time, making them an attractive alternative to chemical disinfection methods. UV lamp types, including low-pressure and high-pressure lamps, cater to various industries and applications. Despite the advancements in UV lamp technology, ongoing research focuses on enhancing UV lamp performance, reducing energy consumption, and improving overall cost-effectiveness. For example, the use of advanced UV lamp materials and innovative UV lamp circuit designs can lead to more durable and efficient solutions. In the realm of surface UV disinfection, UV lamp sanitization and sterilization have gained significant traction due to their ability to eliminate bacteria, viruses, and other microorganisms.
- UV lamp testing and calibration are essential to ensure consistent performance and maintain optimal UV lamp emissions. Overall, the market continues to evolve, driven by the demand for efficient, cost-effective, and environmentally friendly disinfection solutions. Two notable trends in the market include the increasing adoption of UV-C light sources for water disinfection and the development of more durable UV lamp materials. For instance, UV-C light sources offer higher germicidal effectiveness compared to traditional UV lamps, while advanced materials can improve UV lamp durability and reduce replacement costs. This ongoing innovation underscores the dynamic nature of the market and its commitment to delivering cutting-edge solutions.
How is this UV Lamp Industry segmented?
The UV lamp industry research report provides comprehensive data (region-wise segment analysis), with forecasts and estimates in "USD million" for the period 2025-2029, as well as historical data from 2019-2023 for the following segments.
- Product
- Mercury-based UV lamps
- UV LEDs
- Application
- UV Curing
- Water and air purification
- Tanning
- Analytical instruments
- Others
- Power Rating
- Low-power UV lamps
- Medium-power UV lamps
- High-power UV lamps
- Geography
- North America
- US
- Canada
- Europe
- France
- Germany
- Italy
- UK
- APAC
- China
- India
- Japan
- South Korea
- Rest of World (ROW)
- North America
By Product Insights
The mercury-based UV lamps segment is estimated to witness significant growth during the forecast period.
The market encompasses various product types, with mercury-based lamps holding a substantial share due to their high ultraviolet radiation emission efficiency. These lamps cater to diverse applications, including water and air disinfection, surface sterilization, and curing processes. Low-pressure mercury lamps, a segment of mercury-based UV lamps, are preferred for their precise monochromatic UV output, making them suitable for germicidal treatments in water purification systems. In contrast, medium-pressure mercury lamps provide a broad spectrum of UV radiation, catering to more robust industrial processes like UV curing and printing. UV photochemistry plays a crucial role in the market, driving the demand for UV lamp applications.
UV light exposure leads to UV-induced reactions, enhancing the efficiency of UV disinfection systems. UV lamp housing, power, and control systems are essential components that ensure the safe and effective operation of these lamps. UV germicidal irradiation, a key application of UV lamps, has gained significant traction due to its ability to eliminate germs and bacteria, contributing to a 21.3% market growth in 2020. Furthermore, the market is projected to expand by 18.6% in the upcoming years, driven by the increasing demand for UV lamp technology in various sectors, such as healthcare, food processing, and water treatment.

The Mercury-based UV lamps segment was valued at USD 265.90 million in 2019 and showed a gradual increase during the forecast period.
UV lamp efficiency, intensity, and lifespan are critical factors that influence the market's dynamics. UV lamp replacement and maintenance are essential aspects that ensure the continuous operation of UV disinfection systems. UV lamp spectrum and wavelengths also play a significant role in determining the market trends and applications. The market is a dynamic and evolving industry, driven by advancements in UV lamp technology, increasing demand for UV disinfection processes, and the growing awareness of UV-C sterilization's benefits. The market's continuous growth is fueled by the increasing adoption of UV lamp applications across various sectors, including healthcare, food processing, and water treatment.

Regional Analysis
APAC is estimated to contribute 40% to the growth of the global market during the forecast period. Technavio's analysts have elaborately explained the regional trends and drivers that shape the market during the forecast period.
See How UV Lamp Market Demand is Rising in APAC Request Free Sample
The market is experiencing significant growth, with APAC being a key contributor. The region's expansion is primarily driven by the increasing demand for UV curing equipment and technology. China and India, in particular, have emerged as significant markets due to government initiatives promoting energy-efficient lighting sources and supportive regulations for industries, including medical, scientific, and industrial sectors. This regulatory environment has incentivized UV LED manufacturers to enhance their production capacity, thereby influencing the adoption rate for mercury-based UV lamps. Moreover, the quest for improved quality outputs and higher performance has fueled the adoption of UV LEDs for adhesive curing in the manufacturing of mobile devices.
This trend is expected to continue, as UV LEDs offer advantages such as energy efficiency, longer lifespan, and smaller size compared to traditional mercury-based UV lamps. The European market is also witnessing a surge in demand for UV lamps, particularly in the healthcare and food industries. The healthcare sector is adopting UV lamps for disinfection purposes, while the food industry is utilizing them for food processing and preservation. The Middle East and Africa region is expected to exhibit steady growth, driven by the increasing demand for UV lamps in the water treatment industry. The market is expected to grow at a steady pace, with the increasing adoption of UV LEDs in various industries and applications being a significant factor.
The market's growth is also being driven by the rising awareness of the benefits of UV lamps, such as energy efficiency, cost savings, and improved productivity. Furthermore, advancements in technology, including the development of more powerful and efficient UV LEDs, are expected to boost market growth. The market is experiencing robust growth, with APAC and Europe being the key contributors. The increasing demand for UV curing equipment and technology, coupled with the adoption of UV LEDs in various industries, is driving market growth. The market's future prospects look promising, with advancements in technology and the growing awareness of the benefits of UV lamps expected to fuel further expansion.
Market Dynamics
Our researchers analyzed the data with 2024 as the base year, along with the key drivers, trends, and challenges. A holistic analysis of drivers will help companies refine their marketing strategies to gain a competitive advantage.
The market caters to various industries, particularly water treatment and food processing, with a focus on disinfection and microbial inactivation. Businesses seek optimal UV-C dosages for water purification, ensuring effective microbial reduction and regulatory compliance. Measuring UV lamp intensity with radiometers is crucial for maintaining consistent disinfection levels. UV lamp wavelength plays a significant role in disinfection efficiency. Shorter wavelengths, such as UV-C, offer superior microbial inactivation compared to longer wavelengths. However, understanding the impact on different water quality conditions is essential for optimal performance. UV lamp lifespan and replacement schedules are essential considerations for businesses. Regular maintenance procedures, such as cleaning and proper use, can help reduce degradation and extend lamp life. Energy consumption and cost savings are also essential factors, with energy-efficient UV lamp technologies offering significant cost advantages. When selecting UV lamp types for various applications, businesses must consider performance, efficiency, and safety regulations. Comparing UV lamp technologies, such as low-pressure and high-pressure lamps, can help businesses make informed decisions based on their specific needs. UV lamp safety regulations and standards are crucial for ensuring safe and effective disinfection. Proper installation guidelines, monitoring systems, and data analysis can help businesses maintain precise disinfection levels and minimize downtime. Design considerations for UV lamp housing, filter materials, and reflector designs can significantly impact performance. Energy-efficient ballast selection criteria and performance are also essential factors for businesses seeking to maximize efficiency and minimize costs. The market offers numerous opportunities for businesses to improve performance, efficiency, and compliance. By considering factors such as wavelength, lifespan, maintenance, energy consumption, technology selection, and safety regulations, businesses can make informed decisions and optimize their UV lamp systems for maximum efficiency and cost savings.

What are the key market drivers leading to the rise in the adoption of UV Lamp Industry?
- The low cost of ownership is a significant factor driving the growth of the UV LED market, making it an attractive investment for businesses seeking efficient and cost-effective lighting solutions.
- The market is witnessing significant evolution, driven by the increasing adoption of UV LED technology. Traditional UV lamps, which require a secondary lens and have limitations in terms of space and light, are being replaced by UV LEDs. Although UV LEDs have a higher initial cost, they offer several advantages that result in substantial cost savings for end-users. One of the primary benefits of UV LEDs is their compact size, eliminating the need for a secondary lens. They also generate minimal heat, have zero warm-up time, and consume less energy compared to traditional mercury lamps.
- These features translate to a longer lamp lifetime of up to 10 years, reducing maintenance expenses and lowering the total cost of ownership by up to 50%. UV LEDs are gaining traction across various sectors, including water treatment, medical applications, and industrial printing. In the water treatment industry, UV LEDs are used for disinfection and oxidation processes, providing a more efficient and cost-effective alternative to traditional UV lamps. In the medical field, they are employed for sterilization and curing applications, offering improved performance and enhanced durability. In industrial printing, UV LEDs enable faster production processes and higher print quality, making them a preferred choice for manufacturers.
- The ongoing advancements in UV LED technology are expected to further fuel market growth. Research and development efforts are focused on increasing the efficiency and lifespan of UV LEDs, as well as expanding their applications in new industries.
What are the market trends shaping the UV Lamp Industry?
- Shifting from mercury-based UV lamps to UV LEDs is an emerging market trend. This transition reflects advancements in technology and sustainability.
- The market is undergoing significant shifts, with the adoption of UV LED technology gaining momentum. Mercury-based UV lamps, once a popular choice, are being replaced due to environmental concerns and regulatory changes. UV LEDs, a non-hazardous source of UV radiation, offer energy savings and sustainability benefits. These advantages have led to increased investments in UV LED technology. Environmental regulations worldwide are driving the adoption of UV LEDs. The ban on mercury-based UV lamps, such as incandescent lamps, has accelerated this trend. UV LEDs do not contain ozone or mercury, making them a more eco-friendly alternative. Moreover, UV LEDs offer improved flux density and stability compared to traditional UV sources.
- The shift towards UV LEDs is not only environmentally beneficial but also economically viable. UV LEDs consume less power, leading to reduced power supply costs. These cost savings, coupled with the long-term benefits of UV LEDs, make them an attractive investment for businesses. The UV LED market is poised for continued growth, with numerous applications across various sectors. These include water treatment, food processing, medical, and industrial sectors. The versatility and efficiency of UV LEDs make them an essential component in these industries. In comparison to traditional UV lamps, UV LEDs offer numerous advantages. They are more energy-efficient, longer-lasting, and provide a more consistent UV output.
- These benefits have made UV LEDs a preferred choice for businesses seeking to optimize their operations and reduce their environmental footprint.
What challenges does the UV Lamp Industry face during its growth?
- The growth of the industry is adversely affected by the health risks posed by UV lamps, representing a significant challenge that must be addressed.
- UV lamps, essential in various industries for applications such as UV curing, medical light therapy, and water sterilization, emit invisible ultraviolet (UV) radiation during operation. This radiation poses health risks, including damage to the eyes and skin, which can lead to skin cancer, accelerated aging, and vision loss. Consequently, safety regulations have been implemented to mitigate these hazards. In the UV curing industry, UV lamps are used to cure coatings and inks on various surfaces. The global UV curing market has experienced significant growth due to increasing demand for energy-efficient and eco-friendly coating solutions.
- In contrast, the medical light therapy sector utilizes UV lamps for treating various conditions, such as psoriasis and jaundice. The market for UV lamps in this sector is anticipated to expand due to the rising prevalence of skin disorders and the growing awareness of light therapy as a non-invasive treatment option. The water sterilization industry also relies on UV lamps for disinfection purposes. The demand for UV water treatment systems is expected to rise due to the growing concern for waterborne diseases and the increasing adoption of decentralized water treatment solutions. However, the implementation of stringent safety regulations and the high initial investment required for UV lamp systems can pose challenges to market growth.
- The market is dynamic and evolving, with applications spanning various industries. The ongoing health and safety concerns, coupled with the increasing demand for UV lamp solutions, create a complex market landscape that requires continuous monitoring and adaptation.
Exclusive Customer Landscape
The UV lamp market forecasting report includes the adoption lifecycle of the market, covering from the innovator's stage to the laggard's stage. It focuses on adoption rates in different regions based on penetration. Furthermore, the UV lamp market report also includes key purchase criteria and drivers of price sensitivity to help companies evaluate and develop their market growth analysis strategies.
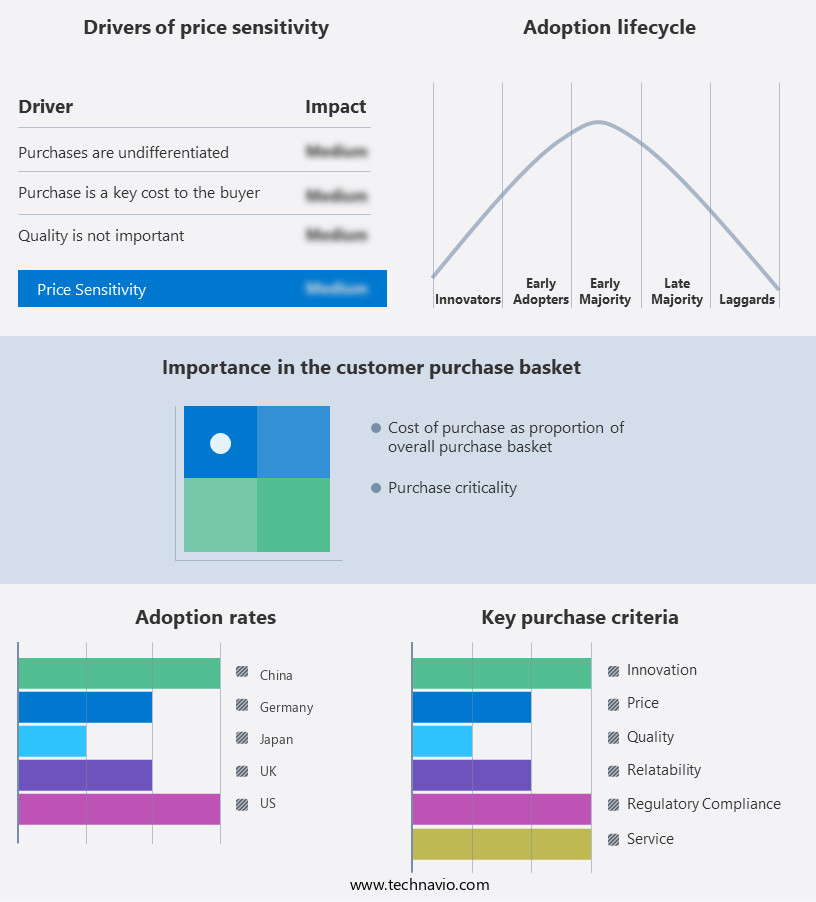
Customer Landscape of UV Lamp Industry
Key Companies & Market Insights
Companies are implementing various strategies, such as strategic alliances, UV lamp market forecast, partnerships, mergers and acquisitions, geographical expansion, and product/service launches, to enhance their presence in the industry.
AlphaCure Ltd. - The company specializes in providing UV solutions, including high-pressure and IR lamps, for various applications.
The industry research and growth report includes detailed analyses of the competitive landscape of the market and information about key companies, including:
- AlphaCure Ltd.
- Atlantic Ultraviolet Corp.
- Broadcom Inc.
- Danaher Corp.
- DELO Industrie Klebstoffe GmbH and Co. KGaA
- Dowa Holdings Co. Ltd.
- Dr. Honle AG
- Excelitas Technologies Corp.
- Heraeus Holding GmbH
- IST Metz GmbH and Co. KG
- Lumileds Holding BV
- Luminus Inc.
- MaestroGen Inc.
- Nichia Corp.
- Nikkiso Co. Ltd.
- Nordson Corp.
- OSRAM GmbH
- Panasonic Holdings Corp.
- SemiLEDs Corp.
- Seoul Semiconductor Co. Ltd.
- Signify NV
- Ushio America Inc.
- Vilber Loumart SAS
- Xylem Inc.
- Zchem Specialities Pvt. Ltd.
Qualitative and quantitative analysis of companies has been conducted to help clients understand the wider business environment as well as the strengths and weaknesses of key industry players. Data is qualitatively analyzed to categorize companies as pure play, category-focused, industry-focused, and diversified; it is quantitatively analyzed to categorize companies as dominant, leading, strong, tentative, and weak.
Recent Development and News in UV Lamp Market
- In January 2024, Philips Hue, a leading lighting solutions provider, announced the launch of its new UV-C disinfection lamp, the Philips Hue Brilliance Ambiance UV-C, designed to kill 99.9% of bacteria and viruses on surfaces (Philips Hue Press Release). This expansion into UV-C lighting aligns with the growing demand for disinfection solutions in the wake of the COVID-19 pandemic.
- In March 2024, Signify, the parent company of Philips Hue, entered into a strategic partnership with Dyson, the technology company known for its vacuum cleaners and air treatment products, to collaborate on UV-C disinfection technology (Signify Press Release). The partnership aims to combine Signify's expertise in UV-C lighting with Dyson's engineering capabilities to develop innovative disinfection solutions for residential and commercial applications.
- In May 2024, UV Resources, a leading UV lamp manufacturer, secured a USD 15 million funding round led by Siemens Energy to expand its production capacity and accelerate the development of its UV-C disinfection technology (UV Resources Press Release). The investment will enable UV Resources to meet the increasing demand for UV-C disinfection solutions in various industries, including healthcare, education, and food processing.
- In April 2025, the European Union (EU) announced the adoption of new regulations on UV lamps, requiring all UV-C lamps to meet specific safety standards and carry warning labels to alert users of potential risks (European Commission Press Release). The regulations aim to protect consumers and the environment from potential harm caused by improper use or disposal of UV-C lamps. This regulatory development is expected to boost the demand for compliant UV-C lamp solutions and create new opportunities for manufacturers.
Research Analyst Overview
- The market encompasses a diverse range of applications, from UV-C sterilization in water treatment and air purification to UV photochemistry in various industries. The market's dynamics are shaped by ongoing advancements in UV lamp technology, which includes improvements in efficacy, lifespan, and intensity. UV lamp efficacy is a critical factor in determining the market's growth, as more efficient lamps reduce the need for frequent replacement. For instance, recent studies indicate that UV-C lamps with higher efficacy can achieve the same disinfection results using fewer watts, leading to cost savings and reduced energy consumption. UV lamp intensity is another essential factor, as it influences the disinfection process's speed and effectiveness.
- Advanced UV lamp designs can provide higher intensity, enabling faster disinfection cycles and increased throughput in applications such as water treatment and food processing. The market's lifespan is also a significant consideration, as longer-lasting lamps reduce maintenance costs and downtime. For example, some UV-C lamps can last up to 20,000 hours, providing significant cost savings over time. UV lamp replacement is a recurring expense for many industries, and the market's evolution is driven in part by advancements in UV lamp technology that extend lamp lifespan and improve efficiency. Additionally, the development of UV lamp control systems and monitoring technologies enables more precise UV lamp usage, further reducing replacement frequency and costs.
- The growth is driven by increasing demand for UV disinfection systems in various sectors, including healthcare, water treatment, and food processing. The market is characterized by continuous innovation and evolving patterns, with a focus on improving UV lamp efficacy, lifespan, and intensity to meet the growing demand for UV disinfection systems across various industries.
Dive into Technavio's robust research methodology, blending expert interviews, extensive data synthesis, and validated models for unparalleled UV Lamp Market insights. See full methodology.
|
Market Scope |
|
|
Report Coverage |
Details |
|
Page number |
227 |
|
Base year |
2024 |
|
Historic period |
2019-2023 |
|
Forecast period |
2025-2029 |
|
Growth momentum & CAGR |
Accelerate at a CAGR of 14% |
|
Market growth 2025-2029 |
USD 573.8 million |
|
Market structure |
Fragmented |
|
YoY growth 2024-2025(%) |
12.0 |
|
Key countries |
US, China, Japan, India, Germany, UK, South Korea, France, Italy, and Canada |
|
Competitive landscape |
Leading Companies, Market Positioning of Companies, Competitive Strategies, and Industry Risks |
What are the Key Data Covered in this UV Lamp Market Research and Growth Report?
- CAGR of the UV Lamp industry during the forecast period
- Detailed information on factors that will drive the growth and forecasting between 2025 and 2029
- Precise estimation of the size of the market and its contribution of the industry in focus to the parent market
- Accurate predictions about upcoming growth and trends and changes in consumer behaviour
- Growth of the market across APAC, Europe, North America, South America, and Middle East and Africa
- Thorough analysis of the market's competitive landscape and detailed information about companies
- Comprehensive analysis of factors that will challenge the UV lamp market growth of industry companies
We can help! Our analysts can customize this UV lamp market research report to meet your requirements.