Vending Machine Food And Beverages Market Analysis North America, Europe, APAC, South America, Middle East and Africa - US, Japan, UK, Germany, China - Size and Forecast 2024-2028

Vending Machine Food And Beverages Market Analysis North America, Europe, APAC, South America, Middle East and Africa - US, Japan, UK, Germany, China - Size and Forecast 2024-2028

Published: Jun 2024 153 Pages SKU: IRTNTR73176

Market Overview at a Glance

$1.27 B
Market Opportunity
4.5%
CAGR
4.23
YoY growth 2023-2024(%)

Vending Machine Food And Beverages Market Size 2024-2028 

The vending machine food and beverages market size is forecast to increase by USD 1.27 billion at a CAGR of 4.5% between 2023 and 2028. The market is experiencing significant growth, driven by the increasing preference for convenient and quick consumption options. One trend influencing the market is the rise of flavored water and healthier food choices in vending machines. Another trend is the integration of technology, such as contactless vending machines and IoT sensors, which enhance the retail experience and enable inventory management and personalized recommendations. These innovations are particularly relevant in sectors like office cafeterias, retail stores, airports, and hotels. However, regulatory issues, such as food safety concerns and restrictions on vending machine installation, pose challenges for market growth. The beverage segment, in particular, is expected to dominate the market due to its high consumer demand.

What will be the Size of the Market During the Forecast Period?

Vending Machine Food And Beverages Market Size

 Request Free Sample

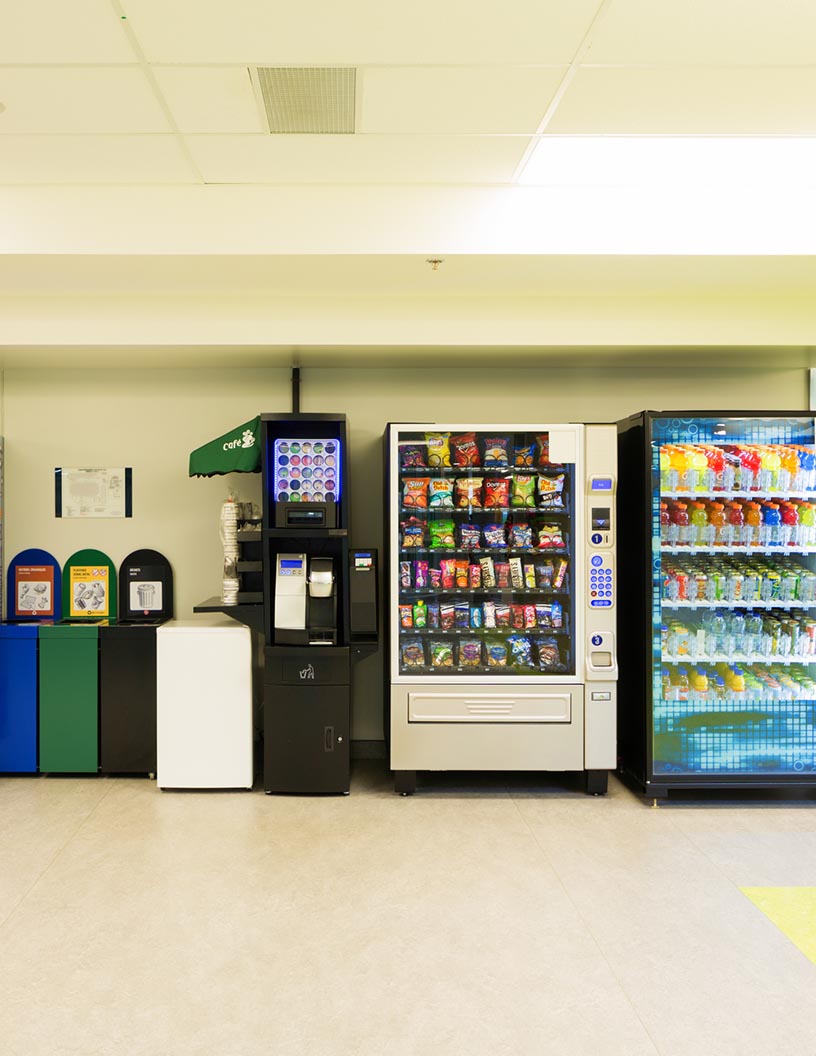
The vending machine food and beverages market is evolving rapidly, driven by the demand for healthier alternatives in the corporate sector and office buildings and workplaces. Consumers are increasingly looking for fresh, nutritious options in addition to traditional canned and bottled beverages and fast food. The rise of customizable vending machine interfaces allows users to select from a wide variety of snacks, drinks, and meals tailored to their preferences. Innovative solutions like the pizza vending machine and advanced touch screen ordering technology offer quick and convenient food options. Payment options are also expanding, with machines now accepting cash, debit, or credit card payments, enhancing convenience for consumers on the go. As the market grows, these machines are becoming more integrated into everyday life, providing both convenience and healthier choices.

Further, both snack vending machines and beverage vending machines are in high demand, with the former accounting for a larger market share. Innovations in technology, such as AI and IoT, have transformed traditional vending machines into smart machines. These machines now feature touch interfaces and digital screens, allowing customers to make purchases with ease and providing them with a more personalized experience. Eco-friendly packaging materials are increasingly being used in the vending machine industry to reduce environmental impact. This trend is particularly important in educational institutions, such as schools and colleges, where there is a growing emphasis on sustainability. With the increasing use of technology, eco-friendly practices, and a wide range of product offerings, vending machines are becoming an essential part of modern life.

Market Segmentation

The market research report provides comprehensive data (region-wise segment analysis), with forecasts and estimates in "USD million" for the period 2024-2028, as well as historical data from 2018-2022 for the following segments.

  • Application
    • Vending machine beverage
    • Vending machine food
  • Geography
    • North America
      • US
    • Europe
      • Germany
      • UK
    • APAC
      • China
      • Japan
    • South America
    • Middle East and Africa

By Application Insights

The vending machine beverage segment is estimated to witness significant growth during the forecast period. The market is projected to expand at a consistent pace over the coming years. Companies in this sector are introducing innovative products to captivate consumers. For example, there is an increasing trend towards the launch of flavored water and low-sugar beverage options, such as Diet Coke and Diet Pepsi, to address the rising issue of obesity.

In addition, companies are investing in research and development to create more intelligent vending machines. The market for vending machines in retail experiences, including office cafeterias, airports, hotels, and retail stores, is expected to witness significant growth due to the convenience and contactless nature of these machines.

Vending Machine Food And Beverages Market Size

Get a glance at the market share of various segments Request Free Sample

The vending machine beverage segment accounted for USD 3.53 billion in 2018 and showed a gradual increase during the forecast period.

Regional Insights

North America is estimated to contribute 35% to the growth of the global market during the forecast period. Technavio's analysts have elaborately explained the regional trends and drivers that shape the market during the forecast period.

Vending Machine Food And Beverages Market Share by Geography

For more insights on the market share of various regions Request Free Sample

The market in North America is expected to expand significantly due to the convenience they offer consumers. The integration of digital screens, cashless payment options via QR codes, and mobile apps with geolocation data has made vending machines more accessible and user-friendly. Additionally, the use of eco-friendly packaging materials and energy-efficient machines aligns with consumer preferences for sustainability. Food safety standards and hygiene practices are essential considerations for the market. Vending machine operators prioritize these aspects to ensure the quality and safety of the products. Bulk snack bins and customization options cater to various consumer preferences, further boosting sales.

Further, advancements in technology include AI-powered vending machines that allow for custom requests and on-demand delivery. These machines offer a personalized experience for consumers, contributing to the growth of the market. The adoption of these intelligent vending machines is on the rise, making the purchasing process more seamless and efficient. In conclusion, the market in North America is poised for growth due to the integration of technology, consumer preferences, and the convenience they offer. The use of digital interfaces, eco-friendly materials, and energy-efficient machines are key trends driving the market's expansion. Additionally, the focus on food safety and hygiene practices ensures the quality and safety of the products. The adoption of AI-powered vending machines offers a personalized purchasing experience, further enhancing the market's appeal.

Our researchers analyzed the data with 2023 as the base year, along with the key drivers, trends, and challenges. A holistic analysis of drivers will help companies refine their marketing strategies to gain a competitive advantage.

Market Driver

The increasing popularity of vending machines is the key driver of the market. The market is experiencing significant growth due to the rising preference for convenience among consumers. Vending machines offering processed foods and sugary beverages continue to gain popularity, particularly in educational institutions and workplaces. IoT technology and automation are increasingly being integrated into these machines, enabling 24/7 service and manageability. The sales of colas and cold drinks account for a substantial portion of vending machine sales, with the number of machines continuing to increase. The convenience and availability of these machines make them an attractive option for consumers, contributing to the market's expansion.

Market Trends

Innovations in vending machines is the upcoming trend in the market. Vending machines selling packaged food products and beverages have gained significant traction in the market due to the fast-paced lifestyles of consumers. The convenience offered by these machines, particularly in corporate settings, has made on-the-go snacks and beverages a popular choice for many. Innovations in vending machine technology continue to drive sales growth. For example, cashless payment options, such as credit cards, debit cards, and mobile payments, have become increasingly common. This ease of transaction is expected to boost sales of food and beverage items through vending machines during the forecast period. Furthermore, the growing popularity of near field technology (NFT) is also contributing to the trend towards cashless transactions.

Companies like Coca-Cola are leading the way with AI-powered smart digital vending machines that enhance the consumer experience. These machines offer personalized recommendations and the ability to track inventory levels in real-time. Overall, the market for vending machine food and beverages is poised for continued growth due to the convenience and innovation offered by these machines.

Market Challenge

Bans and restrictions on installation of vending machines is a key challenge affecting the market growth. The market is experiencing significant shifts due to changing consumer preferences and regulatory requirements. The trend towards cashless and contactless payments is gaining momentum, with an increasing number of consumers opting for credit or debit cards, mobile wallets, and other digital payment methods. This trend is particularly noticeable in sectors such as fitness clubs, where members prefer to pay for their supplements, protein bars, and other health-conscious snacks using contactless methods. Simultaneously, there are regulatory challenges to the growth of the market. For instance, some states and cities have imposed bans on the installation of vending machines, particularly those selling sugary drinks and non-nutritious foods, in public places such as shopping complexes, train stations, hospitals, and interstate highways.

In conclusion, the market is undergoing significant changes, driven by shifting consumer preferences, regulatory requirements, and technological innovations. Despite the challenges, the market continues to grow, offering convenience and a diverse range of products to consumers across various sectors. Market players are focusing on innovation and technology to enhance the consumer experience and address concerns around health and nutrition.

Exclusive Customer Landscape

The market forecasting report includes the adoption lifecycle of the market, covering from the innovator's stage to the laggard's stage. It focuses on adoption rates in different regions based on penetration. Furthermore, the report also includes key purchase criteria and drivers of price sensitivity to help companies evaluate and develop their market growth analysis strategies.
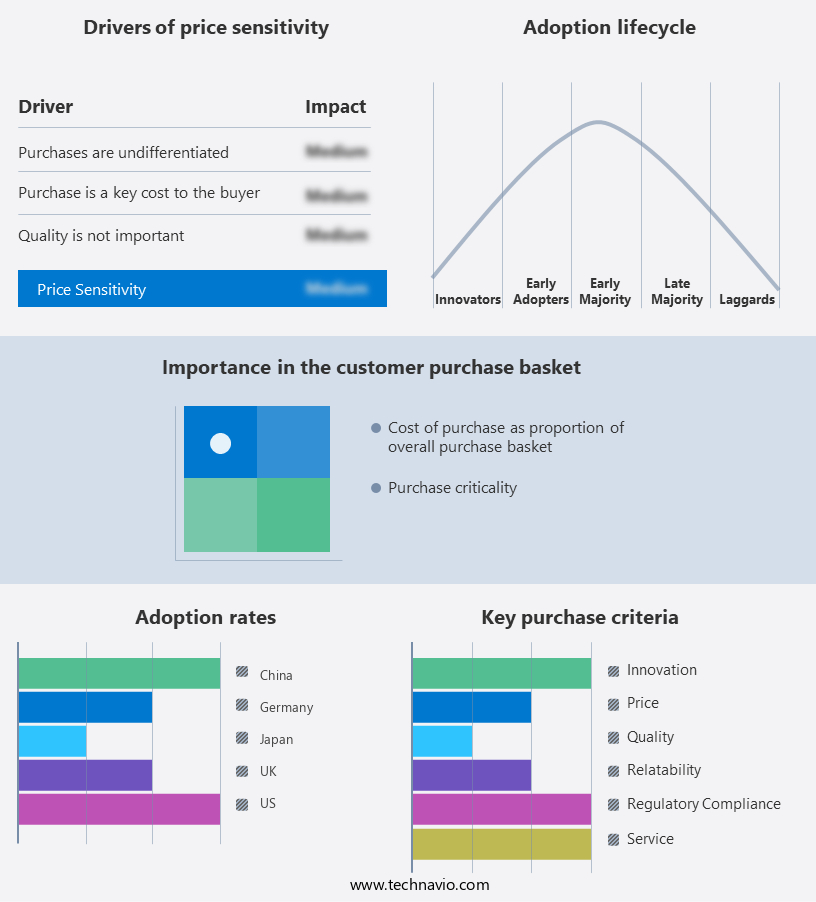
Vending Machine Food And Beverages Market Share by Geography

 Customer Landscape

Key Companies & Market Insights

Companies are implementing various strategies, such as strategic alliances, partnerships, mergers and acquisitions, geographical expansion, and product/service launches, to enhance their presence in the market.

American Food and Vending: The company offers vending machine such as snack machines, vending machines for food and hot and cold beverages, fresh and frozen food vending machines, and coffee machines.

The market research and growth report includes detailed analyses of the competitive landscape of the market and information about key companies, including:

  • Aramark
  • Automated Merchandising Systems Inc.
  • Azkoyen SA
  • Bianchi Industry SpA
  • BULK VENDING SYSTEMS Ltd.
  • Compass Group Plc
  • Crane Holdings Co.
  • FAS International Srl
  • Fuji Electric Co. Ltd.
  • Honeywell International Inc.
  • Kellogg Co.
  • Mondelez International Inc.
  • Nestle SA
  • PepsiCo Inc.
  • Royal Companies Inc.
  • Seaga Manufacturing Inc.
  • Selecta Group BV
  • The Coca Cola Co.
  • Westomatic Vending Services Ltd.

Qualitative and quantitative analysis of companies has been conducted to help clients understand the wider business environment as well as the strengths and weaknesses of key market players. Data is qualitatively analyzed to categorize companies as pure play, category-focused, industry-focused, and diversified; it is quantitatively analyzed to categorize companies as dominant, leading, strong, tentative, and weak.

Research Analyst Overview

In today's fast-paced world, the demand for convenient and on-the-go food and beverage options has flooded. Packaged food products, including chips, chocolates, granola bars, nuts, and sodas, have become staples in food vending machines. These machines cater to various sectors such as corporate offices, retail stores, airports, hotels, and educational institutions. The integration of AI and IoT technology in vending machines has revolutionized the industry. Contactless vending machines, inventory management, personalized recommendations, and touch interfaces are some of the features that enhance the retail experience. The beverage segment, including coffee, energy drinks, and flavored water, dominates the market. Food safety and hygiene practices are essential considerations in the vending industry. Eco-friendly packaging materials, cashless payment options, and QR codes are becoming increasingly popular. The food segment, which offers ready-to-eat food products, is growing rapidly.

Further, vending operators use IoT sensors for inventory management and machine performance monitoring. Customization, product packaging, and bulk snack bins are other features that attract customers. Food safety standards and health risks associated with processed foods and sugary beverages are key concerns. The market includes traditional vending machines, branded vending machines, and snack and beverage vending machines. Automation, 24/7 service, manageability, and energy efficiency are essential factors driving the growth of the vending machine industry. The fitness industry, including fitness clubs and sports stadiums, is a new and emerging market for vending machines, offering supplements, protein bars, and energy drinks.

Market Scope

Report Coverage

Details

Page number

153

Base year

2023

Historic period

2018-2022

Forecast period

2024-2028

Growth momentum & CAGR

Accelerate at a CAGR of 4.5%

Market growth 2024-2028

USD 1.27 billion

Market structure

Fragmented

YoY growth 2023-2024(%)

4.23

Regional analysis

North America, Europe, APAC, South America, and Middle East and Africa

Performing market contribution

North America at 35%

Key countries

US, Japan, UK, Germany, and China

Competitive landscape

Leading Companies, Market Positioning of Companies, Competitive Strategies, and Industry Risks

Key companies profiled

American Food and Vending, Aramark, Automated Merchandising Systems Inc., Azkoyen SA, Bianchi Industry SpA, BULK VENDING SYSTEMS Ltd., Compass Group Plc, Crane Holdings Co., FAS International Srl, Fuji Electric Co. Ltd., Honeywell International Inc., Kellogg Co., Mondelez International Inc., Nestle SA, PepsiCo Inc., Royal companies Inc., Seaga Manufacturing Inc., Selecta Group BV, The Coca Cola Co., and Westomatic Vending Services Ltd.

Market dynamics

Parent market analysis, market growth inducers and obstacles, market forecast, fast-growing and slow-growing segment analysis, COVID-19 impact and recovery analysis and future consumer dynamics, market condition analysis for the forecast period

Customization purview

If our market report has not included the data that you are looking for, you can reach out to our analysts and get segments customized.

Request Free Sample

What are the Key Data Covered in this Market Research and Growth Report?

  • CAGR of the market during the forecast period
  • Detailed information on factors that will drive the market growth and forecasting between 2024 and 2028
  • Precise estimation of the size of the market  and its contribution of the market in focus to the parent market
  • Accurate predictions about upcoming market growth and trends and changes in consumer behaviour
  • Growth of the market across North America, Europe, APAC, South America, and Middle East and Africa
  • Thorough analysis of the market's competitive landscape and detailed information about companies
  • Comprehensive analysis of factors that will challenge the growth of market companies

We can help! Our analysts can customize this market research report to meet your requirements. Get in touch

1 Executive Summary

  • 1.1 Market overview
    • Executive Summary - Chart on Market Overview
    • Executive Summary - Data Table on Market Overview
    • Executive Summary - Chart on Global Market Characteristics
    • Executive Summary - Chart on Market by Geography
    • Executive Summary - Chart on Market Segmentation by Application
    • Executive Summary - Chart on Incremental Growth
    • Executive Summary - Data Table on Incremental Growth
    • Executive Summary - Chart on Company Market Positioning

2 Market Landscape

  • 2.1 Market ecosystem
    • Parent Market
    • Data Table on - Parent Market
  • 2.2 Market characteristics
    • Market characteristics analysis
  • 2.3 Value chain analysis
    • Value Chain Analysis

3 Market Sizing

  • 3.1 Market definition
    • Offerings of companies included in the market definition
  • 3.2 Market segment analysis
    • Market segments
  • 3.3 Market size 2023
    • 3.4 Market outlook: Forecast for 2023-2028
      • Chart on Global - Market size and forecast 2023-2028 ($ million)
      • Data Table on Global - Market size and forecast 2023-2028 ($ million)
      • Chart on Global Market: Year-over-year growth 2023-2028 (%)
      • Data Table on Global Market: Year-over-year growth 2023-2028 (%)

    4 Historic Market Size

    • 4.1 Global Vending Machine Food And Beverages Market 2018 - 2022
      • Historic Market Size - Data Table on Global Vending Machine Food And Beverages Market 2018 - 2022 ($ million)
    • 4.2 Application segment analysis 2018 - 2022
      • Historic Market Size - Application Segment 2018 - 2022 ($ million)
    • 4.3 Geography segment analysis 2018 - 2022
      • Historic Market Size - Geography Segment 2018 - 2022 ($ million)
    • 4.4 Country segment analysis 2018 - 2022
      • Historic Market Size - Country Segment 2018 - 2022 ($ million)

    5 Five Forces Analysis

    • 5.1 Five forces summary
      • Five forces analysis - Comparison between 2023 and 2028
    • 5.2 Bargaining power of buyers
      • Bargaining power of buyers - Impact of key factors 2023 and 2028
    • 5.3 Bargaining power of suppliers
      • Bargaining power of suppliers - Impact of key factors in 2023 and 2028
    • 5.4 Threat of new entrants
      • Threat of new entrants - Impact of key factors in 2023 and 2028
    • 5.5 Threat of substitutes
      • Threat of substitutes - Impact of key factors in 2023 and 2028
    • 5.6 Threat of rivalry
      • Threat of rivalry - Impact of key factors in 2023 and 2028
    • 5.7 Market condition
      • Chart on Market condition - Five forces 2023 and 2028

    6 Market Segmentation by Application

    • 6.1 Market segments
      • Chart on Application - Market share 2023-2028 (%)
      • Data Table on Application - Market share 2023-2028 (%)
    • 6.2 Comparison by Application
      • Chart on Comparison by Application
      • Data Table on Comparison by Application
    • 6.3 Vending machine beverage - Market size and forecast 2023-2028
      • Chart on Vending machine beverage - Market size and forecast 2023-2028 ($ million)
      • Data Table on Vending machine beverage - Market size and forecast 2023-2028 ($ million)
      • Chart on Vending machine beverage - Year-over-year growth 2023-2028 (%)
      • Data Table on Vending machine beverage - Year-over-year growth 2023-2028 (%)
    • 6.4 Vending machine food - Market size and forecast 2023-2028
      • Chart on Vending machine food - Market size and forecast 2023-2028 ($ million)
      • Data Table on Vending machine food - Market size and forecast 2023-2028 ($ million)
      • Chart on Vending machine food - Year-over-year growth 2023-2028 (%)
      • Data Table on Vending machine food - Year-over-year growth 2023-2028 (%)
    • 6.5 Market opportunity by Application
      • Market opportunity by Application ($ million)
      • Data Table on Market opportunity by Application ($ million)

    7 Customer Landscape

    • 7.1 Customer landscape overview
      • Analysis of price sensitivity, lifecycle, customer purchase basket, adoption rates, and purchase criteria

    8 Geographic Landscape

    • 8.1 Geographic segmentation
      • Chart on Market share by geography 2023-2028 (%)
      • Data Table on Market share by geography 2023-2028 (%)
    • 8.2 Geographic comparison
      • Chart on Geographic comparison
      • Data Table on Geographic comparison
    • 8.3 North America - Market size and forecast 2023-2028
      • Chart on North America - Market size and forecast 2023-2028 ($ million)
      • Data Table on North America - Market size and forecast 2023-2028 ($ million)
      • Chart on North America - Year-over-year growth 2023-2028 (%)
      • Data Table on North America - Year-over-year growth 2023-2028 (%)
    • 8.4 Europe - Market size and forecast 2023-2028
      • Chart on Europe - Market size and forecast 2023-2028 ($ million)
      • Data Table on Europe - Market size and forecast 2023-2028 ($ million)
      • Chart on Europe - Year-over-year growth 2023-2028 (%)
      • Data Table on Europe - Year-over-year growth 2023-2028 (%)
    • 8.5 APAC - Market size and forecast 2023-2028
      • Chart on APAC - Market size and forecast 2023-2028 ($ million)
      • Data Table on APAC - Market size and forecast 2023-2028 ($ million)
      • Chart on APAC - Year-over-year growth 2023-2028 (%)
      • Data Table on APAC - Year-over-year growth 2023-2028 (%)
    • 8.6 South America - Market size and forecast 2023-2028
      • Chart on South America - Market size and forecast 2023-2028 ($ million)
      • Data Table on South America - Market size and forecast 2023-2028 ($ million)
      • Chart on South America - Year-over-year growth 2023-2028 (%)
      • Data Table on South America - Year-over-year growth 2023-2028 (%)
    • 8.7 Middle East and Africa - Market size and forecast 2023-2028
      • Chart on Middle East and Africa - Market size and forecast 2023-2028 ($ million)
      • Data Table on Middle East and Africa - Market size and forecast 2023-2028 ($ million)
      • Chart on Middle East and Africa - Year-over-year growth 2023-2028 (%)
      • Data Table on Middle East and Africa - Year-over-year growth 2023-2028 (%)
    • 8.8 US - Market size and forecast 2023-2028
      • Chart on US - Market size and forecast 2023-2028 ($ million)
      • Data Table on US - Market size and forecast 2023-2028 ($ million)
      • Chart on US - Year-over-year growth 2023-2028 (%)
      • Data Table on US - Year-over-year growth 2023-2028 (%)
    • 8.9 Japan - Market size and forecast 2023-2028
      • Chart on Japan - Market size and forecast 2023-2028 ($ million)
      • Data Table on Japan - Market size and forecast 2023-2028 ($ million)
      • Chart on Japan - Year-over-year growth 2023-2028 (%)
      • Data Table on Japan - Year-over-year growth 2023-2028 (%)
    • 8.10 UK - Market size and forecast 2023-2028
      • Chart on UK - Market size and forecast 2023-2028 ($ million)
      • Data Table on UK - Market size and forecast 2023-2028 ($ million)
      • Chart on UK - Year-over-year growth 2023-2028 (%)
      • Data Table on UK - Year-over-year growth 2023-2028 (%)
    • 8.11 Germany - Market size and forecast 2023-2028
      • Chart on Germany - Market size and forecast 2023-2028 ($ million)
      • Data Table on Germany - Market size and forecast 2023-2028 ($ million)
      • Chart on Germany - Year-over-year growth 2023-2028 (%)
      • Data Table on Germany - Year-over-year growth 2023-2028 (%)
    • 8.12 China - Market size and forecast 2023-2028
      • Chart on China - Market size and forecast 2023-2028 ($ million)
      • Data Table on China - Market size and forecast 2023-2028 ($ million)
      • Chart on China - Year-over-year growth 2023-2028 (%)
      • Data Table on China - Year-over-year growth 2023-2028 (%)
    • 8.13 Market opportunity by geography
      • Market opportunity by geography ($ million)
      • Data Tables on Market opportunity by geography ($ million)

    9 Drivers, Challenges, and Opportunity/Restraints

    • 9.1 Market drivers
      • 9.2 Market challenges
        • 9.3 Impact of drivers and challenges
          • Impact of drivers and challenges in 2023 and 2028
        • 9.4 Market opportunities/restraints

          10 Competitive Landscape

          • 10.1 Overview
            • 10.2 Competitive Landscape
              • Overview on criticality of inputs and factors of differentiation
            • 10.3 Landscape disruption
              • Overview on factors of disruption
            • 10.4 Industry risks
              • Impact of key risks on business

            11 Competitive Analysis

            • 11.1 Companies profiled
              • Companies covered
            • 11.2 Market positioning of companies
              • Matrix on companies position and classification
            • 11.3 American Food and Vending
              • American Food and Vending - Overview
              • American Food and Vending - Product / Service
              • American Food and Vending - Key offerings
            • 11.4 Bianchi Industry SpA
              • Bianchi Industry SpA - Overview
              • Bianchi Industry SpA - Product / Service
              • Bianchi Industry SpA - Key offerings
            • 11.5 BULK VENDING SYSTEMS Ltd.
              • BULK VENDING SYSTEMS Ltd. - Overview
              • BULK VENDING SYSTEMS Ltd. - Product / Service
              • BULK VENDING SYSTEMS Ltd. - Key offerings
            • 11.6 Fuji Electric Co. Ltd.
              • Fuji Electric Co. Ltd. - Overview
              • Fuji Electric Co. Ltd. - Business segments
              • Fuji Electric Co. Ltd. - Key news
              • Fuji Electric Co. Ltd. - Key offerings
              • Fuji Electric Co. Ltd. - Segment focus
            • 11.7 Honeywell International Inc.
              • Honeywell International Inc. - Overview
              • Honeywell International Inc. - Business segments
              • Honeywell International Inc. - Key news
              • Honeywell International Inc. - Key offerings
              • Honeywell International Inc. - Segment focus
            • 11.8 Kellogg Co.
              • Kellogg Co. - Overview
              • Kellogg Co. - Business segments
              • Kellogg Co. - Key news
              • Kellogg Co. - Key offerings
              • Kellogg Co. - Segment focus
            • 11.9 Mondelez International Inc.
              • Mondelez International Inc. - Overview
              • Mondelez International Inc. - Business segments
              • Mondelez International Inc. - Key news
              • Mondelez International Inc. - Key offerings
              • Mondelez International Inc. - Segment focus
            • 11.10 Nestle SA
              • Nestle SA - Overview
              • Nestle SA - Business segments
              • Nestle SA - Key news
              • Nestle SA - Key offerings
              • Nestle SA - Segment focus
            • 11.11 PepsiCo Inc.
              • PepsiCo Inc. - Overview
              • PepsiCo Inc. - Business segments
              • PepsiCo Inc. - Key news
              • PepsiCo Inc. - Key offerings
              • PepsiCo Inc. - Segment focus
            • 11.12 The Coca Cola Co.
              • The Coca Cola Co. - Overview
              • The Coca Cola Co. - Business segments
              • The Coca Cola Co. - Key news
              • The Coca Cola Co. - Key offerings
              • The Coca Cola Co. - Segment focus

            12 Appendix

            • 12.1 Scope of the report
              • 12.2 Inclusions and exclusions checklist
                • Inclusions checklist
                • Exclusions checklist
              • 12.3 Currency conversion rates for US$
                • Currency conversion rates for US$
              • 12.4 Research methodology
                • Research methodology
              • 12.5 Data procurement
                • Information sources
              • 12.6 Data validation
                • Data validation
              • 12.7 Validation techniques employed for market sizing
                • Validation techniques employed for market sizing
              • 12.8 Data synthesis
                • Data synthesis
              • 12.9 360 degree market analysis
                • 360 degree market analysis
              • 12.10 List of abbreviations
                • List of abbreviations

              Research Methodology

              Technavio presents a detailed picture of the market by way of study, synthesis, and summation of data from multiple sources. The analysts have presented the various facets of the market with a particular focus on identifying the key industry influencers. The data thus presented is comprehensive, reliable, and the result of extensive research, both primary and secondary.

              INFORMATION SOURCES

              Primary sources

              • Manufacturers and suppliers
              • Channel partners
              • Industry experts
              • Strategic decision makers

              Secondary sources

              • Industry journals and periodicals
              • Government data
              • Financial reports of key industry players
              • Historical data
              • Press releases

              DATA ANALYSIS

              Data Synthesis

              • Collation of data
              • Estimation of key figures
              • Analysis of derived insights

              Data Validation

              • Triangulation with data models
              • Reference against proprietary databases
              • Corroboration with industry experts

              REPORT WRITING

              Qualitative

              • Market drivers
              • Market challenges
              • Market trends
              • Five forces analysis

              Quantitative

              • Market size and forecast
              • Market segmentation
              • Geographical insights
              • Competitive landscape

              Interested in this report?

              Get your sample now to see our research methodology and insights!

              Download Now

              Frequently Asked Questions

              Vending Machine Food And Beverages market growth will increase by $ 1271.1 mn during 2024-2028 .

              The Vending Machine Food And Beverages market is expected to grow at a CAGR of 4.5% during 2024-2028 .

              Vending Machine Food And Beverages market is segmented by Application( Vending machine beverage, Vending machine food, Others)

              American Food and Vending, Aramark, Automated Merchandising Systems Inc., Azkoyen SA, Bianchi Industry SpA, BULK VENDING SYSTEMS Ltd., Compass Group Plc, Crane Holdings Co., FAS International Srl, Fuji Electric Co. Ltd., Honeywell International Inc., Kellogg Co., Mondelez International Inc., Nestle SA, PepsiCo Inc., Royal Vendors Inc., Seaga Manufacturing Inc., Selecta Group BV, The Coca Cola Co., Westomatic Vending Services Ltd. are a few of the key vendors in the Vending Machine Food And Beverages market.

              North America will register the highest growth rate of 35% among the other regions. Therefore, the Vending Machine Food And Beverages market in North America is expected to garner significant business opportunities for the vendors during the forecast period.

              US, Japan, UK, Germany, China

              • Increasing popularity of vending machinesThe increasing popularity of vending machines among consumers is a significant growth driver for the global vending machine food and beverages market. Also is the driving factor this market.
              • the convenience factor offered by vending machines makes them popular among consumers. The number of vending machines in schools and offices is increasing is the driving factor this market.
              • and new vending machines are being installed due to the increasing popularity of vending machines. Japan has the highest number of vending machines per capita in the world is the driving factor this market.
              • and the count is expected to increase in the future. The number of vending machines in the US is also increasing is the driving factor this market.
              • and the sales of colas and cold drinks constitute approximately 40%- 50% of the total sales of merchandise through vending machines. Consumer demand for salty and sugary fast food has likely led to junk food dominating American vending machines. Innovative is the driving factor this market.
              • intelligent vending machines are also transforming vending experiences and are increasing the popularity of vending machines. The rapidly changing lifestyles of the consumers often leave them hard-pressed for time to cook at home is the driving factor this market.
              • which makes vending machines that dispense healthy foods a popular option among them. Consequently is the driving factor this market.
              • various startups have begun launching vending machines that dispense healthy foods. All these influencing factors will drive the growth of the global vending machine food and beverages market during the forecast period. is the driving factor this market.

              The Vending Machine Food And Beverages market vendors should focus on grabbing business opportunities from the Vending machine beverage segment as it accounted for the largest market share in the base year.