Vending Machine Market Size 2025-2029
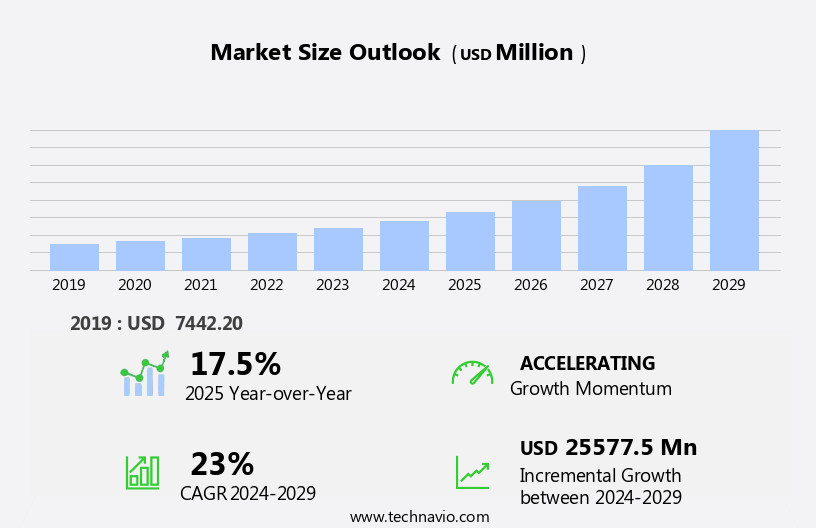
The vending machine market size is forecast to increase by USD 25.58 billion, at a CAGR of 23% between 2024 and 2029.
- The market is witnessing significant growth due to the increasing preference for cashless transactions and strategic partnerships between retailers and manufacturers. The shift towards cashless payments is driving the demand for advanced vending machines that offer contactless payment options, enhancing customer convenience and safety. These advanced machines offer a wider range of products, including tobacco, personal care items, snacks, coffee, sports equipment, protein bars, energy drinks, and nutrition supplements. Furthermore, collaborations between retailers and manufacturers are enabling the development and deployment of innovative vending solutions, catering to diverse consumer needs. However, the market faces challenges with high initial investments and maintenance costs for vending machines.
- These expenses can deter potential entrants and impact the profitability of existing players. Companies must focus on optimizing their operations and exploring cost-effective solutions to remain competitive in the market. By addressing these challenges and capitalizing on the growing demand for cashless vending machines and strategic partnerships, businesses can effectively navigate the competitive landscape and capitalize on the opportunities in the market.
What will be the Size of the Vending Machine Market during the forecast period?
Explore in-depth regional segment analysis with market size data - historical 2019-2023 and forecasts 2025-2029 - in the full report.
Request Free Sample
The market continues to evolve, with dynamic market trends shaping its landscape. Cup dispensers integrate seamlessly with recycling programs, promoting sustainability. Energy efficiency is a key focus, with machines adhering to stringent safety standards. Eco-friendly materials and customization options cater to diverse consumer preferences. Cashless payment systems facilitate convenience, while waste reduction strategies minimize environmental impact. Purchase patterns influence parts availability and branding opportunities. Refrigeration technology ensures optimal temperature control for cold drink dispensing, and credit card readers offer flexibility. Preventive maintenance and hot drink dispensing enhance user experience. Digital displays and pricing strategies attract customers, while advertising displays and product tracking optimize sales.
Supply chain management and retail locations in high-traffic areas benefit from remote monitoring and theft prevention. Public spaces and transportation hubs incorporate vending machines, offering user-friendly interfaces and inventory management systems. Technical support and compliance regulations ensure smooth operations. Heater technology and energy consumption are essential considerations for hot and cold beverage dispensing. Snack dispensing, bottle dispensers, and can dispensers cater to various consumer needs. Selection buttons and spiral technology streamline the purchasing process. Remote diagnostics and security features ensure machine reliability. User experience is further enhanced through product placement, micro markets, and promotional materials. Sales data analytics and customer segmentation enable effective marketing strategies.
Mobile payment integration and service contracts offer added convenience. Cleaning protocols and compliance regulations maintain hygiene and health codes. Automated restocking and bulk storage optimize machine efficiency. The market's continuous evolution reflects the industry's commitment to innovation and adaptability.
How is this Vending Machine Industry segmented?
The vending machine industry research report provides comprehensive data (region-wise segment analysis), with forecasts and estimates in "USD million" for the period 2025-2029, as well as historical data from 2019-2023 for the following segments.
- Distribution Channel
- Offline
- Online
- Product
- Low end vending machines
- Intelligent vending machines
- Type
- Food and beverages vending machine
- Fresh food vending machine
- Non-food items vending machine
- Ice-cream vending machine
- Application
- Hotels and restaurants
- Corporate offices and institutions
- Public places
- Retail stores
- Method
- Cash-based vending machine
- Cashless-based vending machine
- Geography
- North America
- US
- Canada
- Europe
- France
- Germany
- Italy
- UK
- APAC
- China
- India
- Japan
- South Korea
- Rest of World (ROW)
- North America
By Distribution Channel Insights
The offline segment is estimated to witness significant growth during the forecast period.
In the market, companies cater to diverse consumer needs through both offline and online sales channels. Offline distribution includes specialty retailers and direct-to-consumer (D2C) sales. Specialty stores, offering a range of brands and product portfolios, are increasingly popular due to their wide selection. These stores may specialize in specific brands or carry multiple brands, selling similar products across multiple outlets. Department stores, such as Tesco, Lowes, and Home Depot, are another distribution avenue. With extensive product offerings and personalized customer service, these retailers attract consumers seeking vending machines. Energy efficiency, safety standards, eco-friendly materials, and customization options are essential features in today's vending machines.
Cashless payment systems, waste reduction, and purchase patterns influence machine design and functionality. Refrigeration technology, credit card readers, preventive maintenance, and hot and cold drink dispensing are essential features for various office environments. Technical support, inventory management systems, and service contracts ensure smooth operations. Remote monitoring, theft prevention, and supply chain management are critical for retail locations and high-traffic areas. User experience, product placement, and micro markets are essential considerations for public spaces. Compliance regulations, heater technology, and energy consumption are crucial factors in the market's evolution. Companies focus on sales data analytics, customer segmentation, mobile payment integration, and promotional materials to enhance their offerings.
Beverage and snack dispensing, selection buttons, and spiral technology are integral to the user interface. Remote diagnostics and security features ensure machine security. Companies prioritize profit margins, distribution networks, and health codes to maintain a competitive edge. Automated restocking and cleaning protocols are essential for maintaining product quality and consumer trust. Can dispensers, user interfaces, and inventory management systems streamline operations, while service contracts and consumer behavior shape market trends.
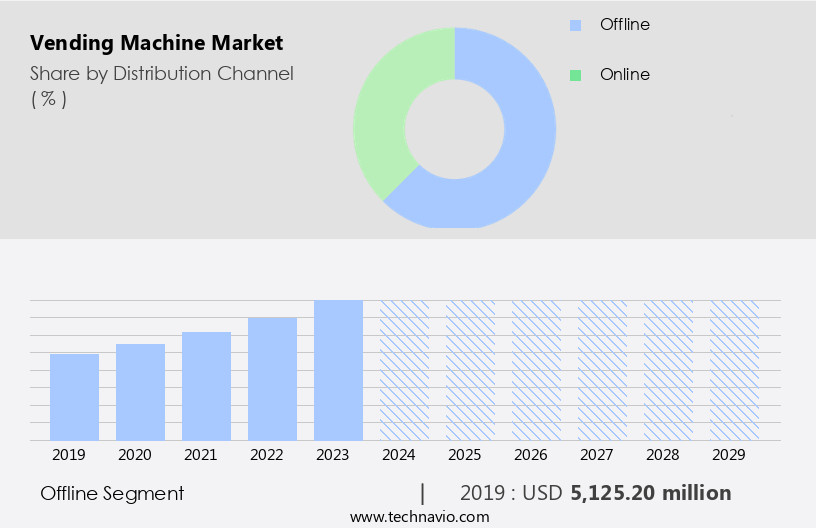
The Offline segment was valued at USD 5.13 billion in 2019 and showed a gradual increase during the forecast period.
Regional Analysis
North America is estimated to contribute 39% to the growth of the global market during the forecast period. Technavio's analysts have elaborately explained the regional trends and drivers that shape the market during the forecast period.
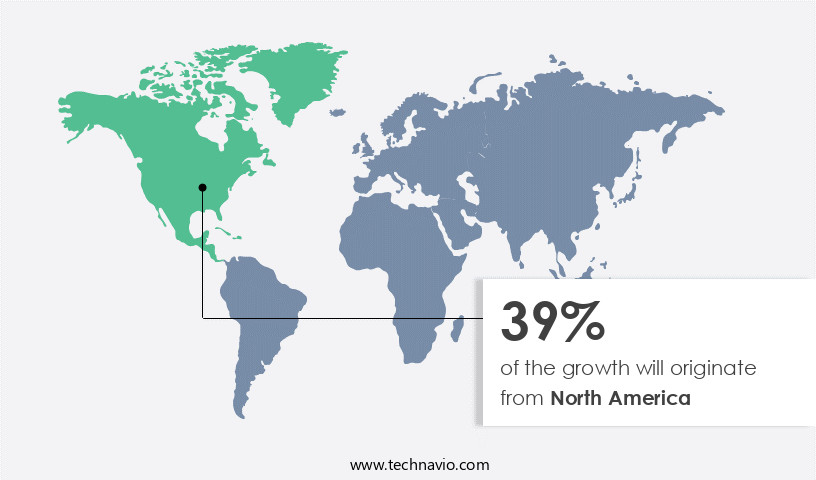
In the North American market, vending machines continue to gain traction across various industries, fueled by increasing demand from retailers and small businesses. The US leads the region's market, with significant contributions from Canada and Mexico. The popularity of vending machines stems from their convenience, efficiency, and versatility. Energy efficiency and eco-friendly materials are becoming essential considerations, with many machines incorporating recycling programs and waste reduction features. Customization options, cashless payment systems, and digital displays cater to evolving consumer preferences. Refrigeration technology ensures temperature control for cold drinks, while credit card readers and preventive maintenance enhance the user experience.
Hot and cold drink dispensing, snack dispensing, and even bottle dispensers cater to diverse product offerings. Safety standards and security features ensure peace of mind for businesses and consumers. Remote monitoring, theft prevention, and automated restocking further streamline operations. Branding opportunities and inventory management systems enable businesses to optimize their offerings based on consumer behavior and purchasing patterns. Heater technology and energy consumption are essential factors in maintaining profit margins and adhering to health codes. The market's growth is also driven by the integration of mobile payment systems, sales data analytics, and product tracking. Micro markets, tamper-evident seals, and can dispensers cater to specific market segments.
Compliance regulations and preventive maintenance contracts ensure smooth operations and regulatory adherence. In office environments, high-traffic areas, public spaces, and transportation hubs, vending machines offer a convenient solution for various products and services. Remote diagnostics and technical support ensure minimal downtime, while preventive maintenance scheduling and pricing strategies optimize costs. The market in North America continues to evolve, with a focus on innovation, sustainability, and consumer convenience.
Market Dynamics
Our researchers analyzed the data with 2024 as the base year, along with the key drivers, trends, and challenges. A holistic analysis of drivers will help companies refine their marketing strategies to gain a competitive advantage.
The global vending machine market is experiencing significant expansion, driven by evolving vending machine market trends toward enhanced automation. Beverage vending machines and food vending machines remain central to the growing vending machine market size, reflecting robust vending machine market growth. The proliferation of smart vending machines is a key differentiator, integrating advanced cashless payment systems vending and leveraging IoT in vending machines for improved efficiency.
Remote monitoring vending machines and real-time inventory management vending capabilities are optimizing operations for vendors. The demand for healthy vending machines is rising, catering to health-conscious consumers in public places vending machines and corporate offices vending machines. Key regions like the North America vending machine market and Asia-Pacific vending machine market are witnessing rapid adoption. Leading vending machine manufacturers are innovating with touchless vending machines and diverse specialty vending machines, incorporating seamless mobile payment integration vending for ultimate convenience.
What are the key market drivers leading to the rise in the adoption of Vending Machine Industry?
- The increasing preference for cashless transactions is primarily fueling the market expansion for cashless vending machines.
- Vending machines are evolving to cater to modern consumer preferences and business requirements. The shift towards cashless payments is driving the growth of the market. With the increasing adoption of smartphones and Internet-enabled devices, consumers are opting for contactless transactions using debit cards, credit cards, and mobile payments. Vending machine manufacturers and retailers are responding to this trend by installing intelligent vending machines that accept various payment methods. These machines offer several advantages, such as automated restocking, real-time data analysis, and inventory management systems. Moreover, compliance with health codes and cleaning protocols is essential for vending machines in various public places.
- Heater technology and energy consumption are other critical factors influencing the market dynamics. Distribution networks and service contracts are also crucial elements that impact the profit margins of vending machine operators. User interfaces and can dispensers are essential features that enhance the consumer experience. Intelligent vending machines are gaining popularity in various sectors, including offices, commercial complexes, institutes, hospitals, and hotels. Retailers are increasingly preferring vending machines that offer cashless features, automated restocking, and real-time data analysis to optimize their inventory management and enhance customer satisfaction. The market is expected to continue growing, driven by consumer behavior and compliance regulations.
What are the market trends shaping the Vending Machine Industry?
- The relationship between retailers and manufacturers is becoming increasingly important in the current market trend. This alliance not only benefits both parties but also enhances consumer experience through efficient supply chains and improved product offerings.
- Intelligent vending machines are gaining popularity among industries such as cosmetics, personal and beauty care, and consumer goods and retail. These advanced machines offer numerous benefits, including cashless payment systems, credit card readers, and customization options, which are driving their adoption by major global retailers. Coca-Cola was an early adopter of such technology, implementing machines that accept various payment methods and alert managers when beverage levels are low. Moreover, eco-friendly materials and recycling programs are becoming essential features in today's vending machines, aligning with the growing emphasis on sustainability. Energy efficiency and safety standards are also crucial factors in the market, ensuring that these machines operate efficiently and securely.
- Refrigeration technology is another critical component of modern vending machines, enabling the dispensing of hot and cold drinks and food items. Preventive maintenance and parts availability are essential for ensuring the machines' longevity and optimal performance. Branding opportunities are also significant, as vending machines offer a prime advertising space for companies to showcase their products and engage with consumers. In conclusion, the shift towards intelligent vending machines offers numerous advantages for businesses, including waste reduction, purchase pattern insights, and a seamless user experience.
What challenges does the Vending Machine Industry face during its growth?
- The vending machine industry faces significant challenges due to high upfront investments and ongoing maintenance costs, which can hinder its growth.
- Intelligent vending machines have become a significant investment for businesses, offering digital displays, pricing strategies, advertising, product tracking, and maintenance scheduling. However, the initial investment in purchasing both hardware and software can be substantial. Customization options can add to the expense, as businesses may choose to outsource this task to third-party suppliers. In the competitive market, innovation is essential, necessitating substantial investments in research and development. Manufacturing costs for vending machines are high, and rental fees continue to rise annually. Moreover, the need for continuous software upgrades and related services adds to the ongoing expenses.
- Companies must balance these costs against the benefits of offering advanced features like beverage dispensing using spiral technology, selection buttons, and cold drink and snack dispensing. Remote diagnostics, security features, and technical support are also essential for efficient machine operation. Effective supply chain management is crucial for maintaining inventory and minimizing downtime. In conclusion, while intelligent vending machines offer numerous advantages, businesses must carefully consider the costs associated with their acquisition, customization, and maintenance.
Exclusive Customer Landscape
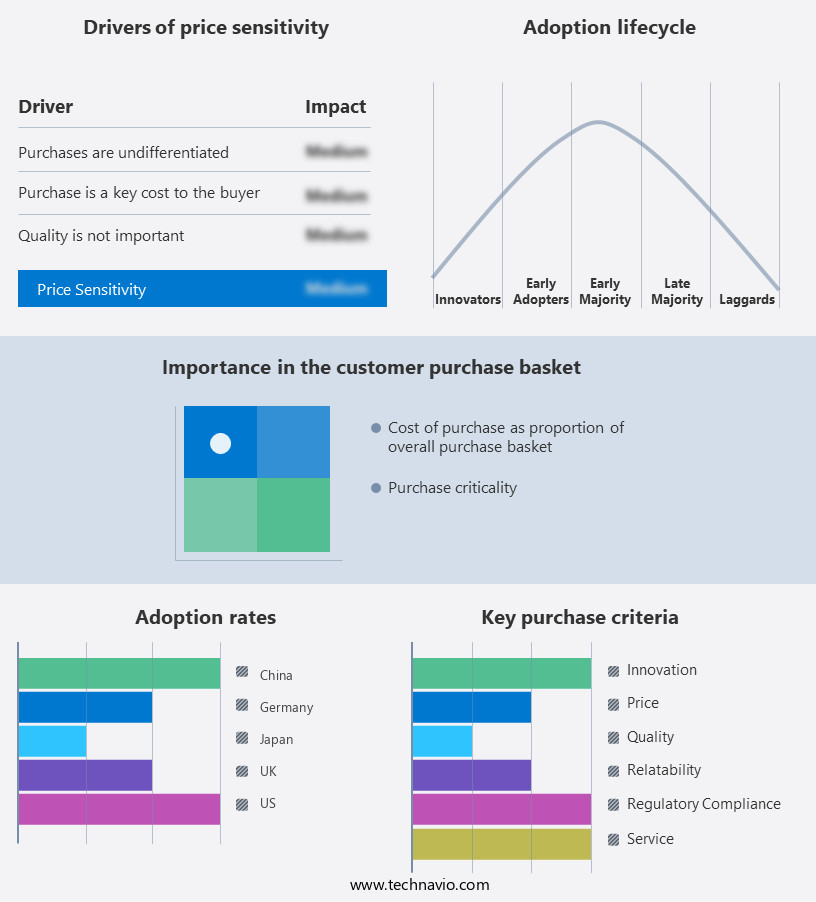
The vending machine market forecasting report includes the adoption lifecycle of the market, covering from the innovator's stage to the laggard's stage. It focuses on adoption rates in different regions based on penetration. Furthermore, the vending machine market report also includes key purchase criteria and drivers of price sensitivity to help companies evaluate and develop their market growth analysis strategies.
Customer Landscape
Key Companies & Market Insights
Companies are implementing various strategies, such as strategic alliances, vending machine market forecast, partnerships, mergers and acquisitions, geographical expansion, and product/service launches, to enhance their presence in the industry.
Azkoyen SA - The company specializes in providing a range of advanced vending machines, including the Vitro S1, Vitro S5, Novara Espresso, Neo Q Espresso, Neo Q double Espresso, and Novara Instant models.
The industry research and growth report includes detailed analyses of the competitive landscape of the market and information about key companies, including:
- Azkoyen SA
- Bianchi Industry Spa
- BULK VENDING SYSTEMS Ltd.
- Compass Group Plc
- Continental Vending Inc.
- Crane Payment Innovations Inc.
- Ellab AS
- Federal Machine
- Furukawa Electric Co. Ltd.
- Future Techniks India Pvt. Ltd.
- Glory Ltd.
- Intel Corp.
- Orasesta Spa
- Royal Vendors Inc.
- Sanden Corp.
- Seaga Manufacturing Inc.
- Sielaff GmbH and Co. KG
- The Coca Cola Co.
- Westomatic Vending Services Ltd.
- Worldline SA
Qualitative and quantitative analysis of companies has been conducted to help clients understand the wider business environment as well as the strengths and weaknesses of key industry players. Data is qualitatively analyzed to categorize companies as pure play, category-focused, industry-focused, and diversified; it is quantitatively analyzed to categorize companies as dominant, leading, strong, tentative, and weak.
Recent Development and News in Vending Machine Market
- In January 2024, Coca-Cola European Partners (CCEP) announced the acquisition of Selecta, a leading European self-service automation solutions provider, for â¬1.2 billion. This strategic move aimed to expand CCEP's presence in the market and strengthen its offering in the growing area of automated retail solutions (Source: Coca-Cola European Partners Press Release).
- In March 2024, Nestle and PepsiCo unveiled their new partnership to introduce Nestle products in PepsiCo's vending machines. This collaboration marked a significant shift in the beverage industry, allowing Nestle to expand its reach in the vending sector and PepsiCo to diversify its product offerings (Source: Nestle and PepsiCo Press Releases).
- In May 2024, Panasonic Corporation launched its new generation of vending machines, featuring advanced AI technology and facial recognition capabilities. These smart vending machines were designed to improve customer experience by offering personalized recommendations and contactless payment options (Source: Panasonic Corporation Press Release).
- In April 2025, the European Union passed the New Circular Economy Action Plan, which included provisions for extended producer responsibility (EPR) in vending machines. The new regulations aimed to encourage manufacturers to design more sustainable vending machines and improve recycling rates (Source: European Commission Press Release).
Research Analyst Overview
- The market is experiencing significant advancements, driven by the integration of various technologies and shifting consumer preferences. RFID technology and NFC enable contactless payments, enhancing sales promotion and customer engagement. Subscription services and personalized offers cater to consumer preferences, fostering brand loyalty. Computer vision and machine learning improve efficiency by identifying products and predicting demand. Cloud connectivity and mobile applications facilitate real-time data analytics, enabling supply chain optimization and technical support. Warranty claims are streamlined through AI-powered systems, reducing costs and improving customer service. Industry trends include IOT integration, touchscreen interfaces, and voice recognition for enhanced user experience.
- Future trends encompass virtual reality, augmented reality, and biometric authentication for customized products and increased security. Marketing strategies leverage data analytics platforms to target audience segments effectively. Product development focuses on cost reduction and efficiency improvement through emerging technologies like 3D printing and smart vending machines. Loyalty programs and machine learning algorithms optimize distribution channels, ensuring a consistent product life cycle. AI and ML enable predictive maintenance, reducing downtime and enhancing overall performance.
Dive into Technavio's robust research methodology, blending expert interviews, extensive data synthesis, and validated models for unparalleled Vending Machine Market insights. See full methodology.
|
Market Scope |
|
|
Report Coverage |
Details |
|
Page number |
250 |
|
Base year |
2024 |
|
Historic period |
2019-2023 |
|
Forecast period |
2025-2029 |
|
Growth momentum & CAGR |
Accelerate at a CAGR of 23% |
|
Market growth 2025-2029 |
USD 25577.5 million |
|
Market structure |
Fragmented |
|
YoY growth 2024-2025(%) |
17.5 |
|
Key countries |
US, Canada, China, India, Germany, France, UK, Italy, Japan, and South Korea |
|
Competitive landscape |
Leading Companies, Market Positioning of Companies, Competitive Strategies, and Industry Risks |
What are the Key Data Covered in this Vending Machine Market Research and Growth Report?
- CAGR of the Vending Machine industry during the forecast period
- Detailed information on factors that will drive the growth and forecasting between 2025 and 2029
- Precise estimation of the size of the market and its contribution of the industry in focus to the parent market
- Accurate predictions about upcoming growth and trends and changes in consumer behaviour
- Growth of the market across North America, Europe, APAC, South America, and Middle East and Africa
- Thorough analysis of the market's competitive landscape and detailed information about companies
- Comprehensive analysis of factors that will challenge the vending machine market growth of industry companies
We can help! Our analysts can customize this vending machine market research report to meet your requirements.