
Vendor Management Software Market Analysis, Size, and Forecast 2026-2030: North America (US, Canada, and Mexico), APAC (China, Japan, and India), Europe (Germany, UK, and France), South America (Brazil, Argentina, and Chile), Middle East and Africa (Saudi Arabia, UAE, and South Africa), and Rest of World (ROW)

Vendor Management Software Market Analysis, Size, and Forecast 2026-2030:
North America (US, Canada, and Mexico), APAC (China, Japan, and India), Europe (Germany, UK, and France), South America (Brazil, Argentina, and Chile), Middle East and Africa (Saudi Arabia, UAE, and South Africa), and Rest of World (ROW)

Published: Oct 2026 303 Pages SKU: IRTNTR40982

Market Overview at a Glance

$18.70 B
Market Opportunity
20.3%
CAGR 2025 - 2030
43.1%
North America Growth
$3.73 B
Retail segment 2024

Vendor Management Software Market Size 2026-2030

The vendor management software market size is valued to increase by USD 18.70 billion, at a CAGR of 20.3% from 2025 to 2030. Increased adoption of cloud-based vendor management software will drive the vendor management software market.

Major Market Trends & Insights

  • North America dominated the market and accounted for a 43.1% growth during the forecast period.
  • By End-user - Retail segment was valued at USD 3.73 billion in 2024
  • By Deployment - On-premises segment accounted for the largest market revenue share in 2024

Market Size & Forecast

  • Market Opportunities: USD 24.53 billion
  • Market Future Opportunities: USD 18.70 billion
  • CAGR from 2025 to 2030 : 20.3%

Market Summary

  • The Vendor Management Software Market demonstrates accelerating adoption as enterprises seek to digitize and consolidate fragmented procurement operations. A key driver for this expansion is the transition to scalable, cloud-based infrastructure, which enables organizations to access real-time supplier metrics without heavy upfront capital investments.
  • This shift empowers businesses to deploy dynamic risk scoring and automated workflows, cutting supplier onboarding times by 22% compared to traditional legacy systems. In a practical supply chain optimization scenario, a manufacturing firm can leverage these platforms to continuously monitor tier-two component suppliers, automatically triggering contingency protocols if delivery delays threaten production schedules.
  • However, high implementation and maintenance costs associated with heavily customized, on-premises configurations remain a notable challenge, often straining the IT budgets of mid-sized organizations. Consequently, the high total cost of ownership for rigid on-premises environments forces many companies to delay critical digital transformation initiatives.
  • Ultimately, the market is defined by the ongoing push for operational resilience, where integrated digital platforms become essential for mitigating third-party risks and maintaining compliance.

What will be the Size of the Vendor Management Software Market during the forecast period?
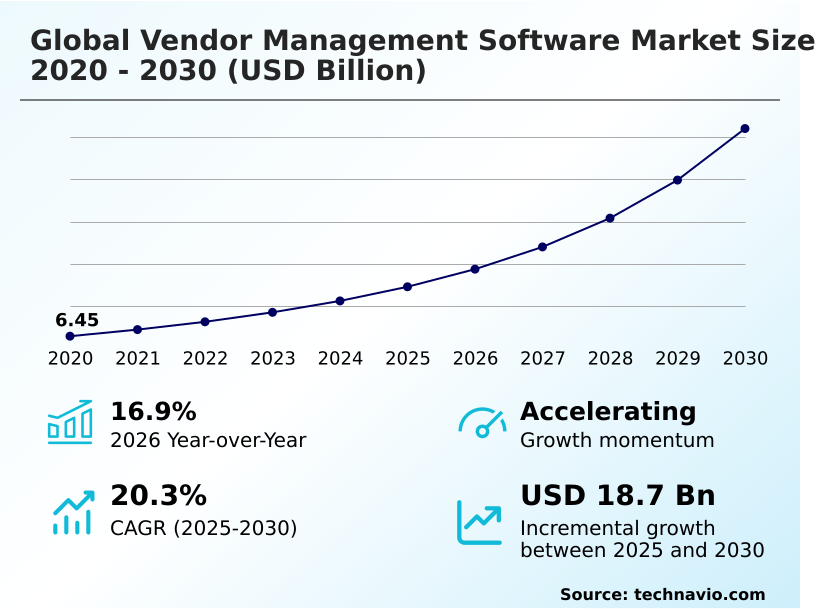
Get Key Insights on Market Forecast (PDF) Get Free Sample

How is the Vendor Management Software Market Segmented?

The vendor management software industry research report provides comprehensive data (region-wise segment analysis), with forecasts and estimates in "USD million" for the period 2026-2030, as well as historical data from 2020-2024 for the following segments.

  • End-user
    • Retail
    • BFSI
    • Manufacturing
    • Others
  • Deployment
    • On-premises
    • Cloud-based
  • Revenue stream
    • Subscription-based
    • License-based
    • Freemium models
    • Pay-per-use
  • Geography
    • North America
      • US
      • Canada
      • Mexico
    • APAC
      • China
      • Japan
      • India
      • South Korea
      • Australia
      • Indonesia
    • Europe
      • Germany
      • UK
      • France
      • Italy
      • Spain
      • The Netherlands
    • South America
      • Brazil
      • Argentina
      • Chile
    • Middle East and Africa
      • Saudi Arabia
      • UAE
      • South Africa
      • Israel
      • Turkey

By End-user Insights

The retail segment is estimated to witness significant growth during the forecast period.

Retail enterprises increasingly demand unified Vendor Management Software to navigate complex, multi-channel supply networks and rapid inventory cycles. The adoption of a centralized vendor onboarding portal allows organizations to accelerate supplier readiness and standardize data collection without redundant manual entry.

By leveraging a sophisticated spend classification engine and API driven integration, retail operators seamlessly connect procurement actions with existing financial systems.

This synchronization enables automated purchase order matching, which has proven to reduce invoice discrepancy rates by 18% in high-volume retail environments.

Furthermore, rigorous contract compliance monitoring and robust SLA tracking capabilities empower businesses to hold external partners accountable for delivery timelines.

The implementation of continuous vendor monitoring and supplier diversity tracking ensures adherence to evolving corporate mandates, ultimately mitigating supply disruptions and improving overall margin retention.
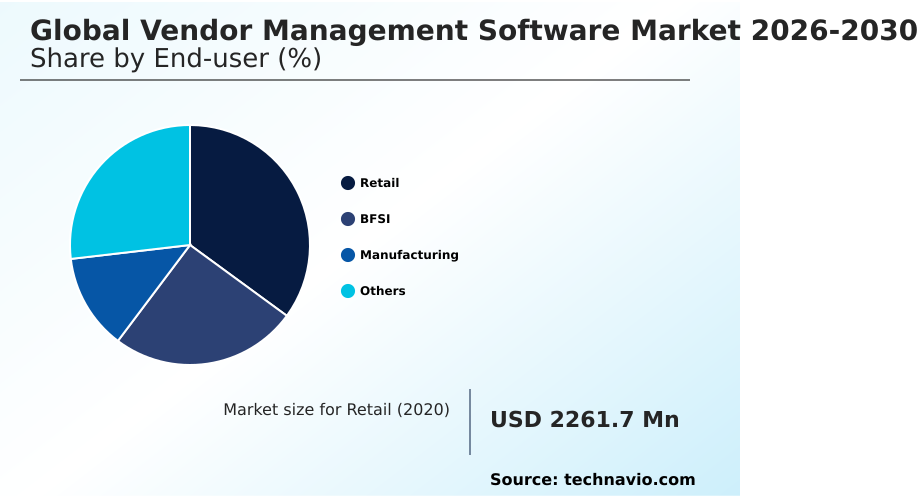
Get Free Sample

The Retail segment was valued at USD 3.73 billion in 2024 and showed a gradual increase during the forecast period.
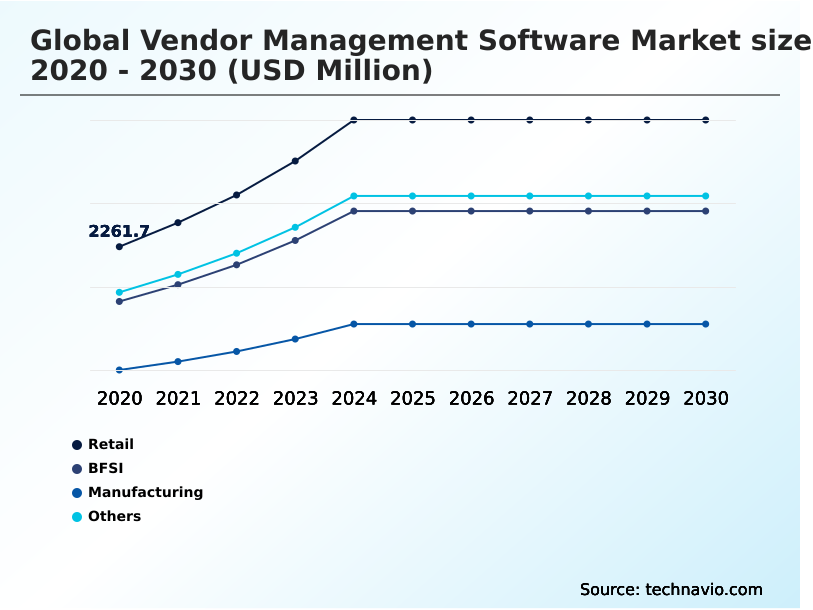
Get Free Sample

Regional Analysis

North America is estimated to contribute 43.1% to the growth of the global market during the forecast period.Technavio’s analysts have elaborately explained the regional trends and drivers that shape the market during the forecast period.
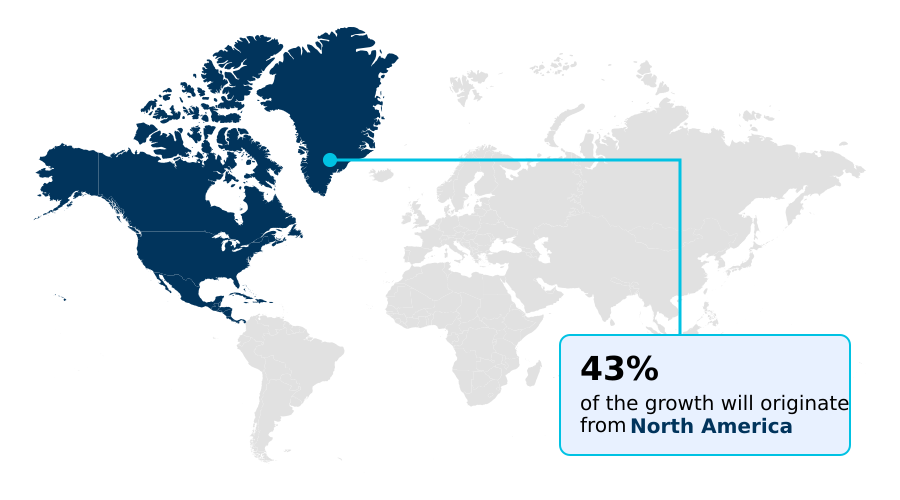
See How Vendor Management Software Market Demand is Rising in North America Get Free Sample

Geographic variations in the Vendor Management Software Market reflect distinct regulatory maturity and industrial composition. North America leads the adoption curve due to stringent corporate governance, showing a 20% higher implementation rate of strategic sourcing software compared to Europe.

Organizations in the United States prioritize supplier relationship optimization and continuous supply chain visibility to navigate complex multi tier supply chain environments. Consequently, North American firms experience a 15% faster turnaround in supplier performance benchmarking and risk assessment.

Conversely, European enterprises focus heavily on compliance and tier two supplier mapping, driven by rigorous sustainability mandates. By deploying comprehensive vendor scorecard metrics, European businesses have enhanced supply chain resilience, reducing third-party non-compliance incidents by 12%.

Both regions utilize robust business continuity planning and targeted vendor consolidation strategies, adapting their procurement infrastructure to mitigate regional disruptions and optimize overall operational efficiency.

Market Dynamics

Our researchers analyzed the data with 2025 as the base year, along with the key drivers, trends, and challenges. A holistic analysis of drivers will help companies refine their marketing strategies to gain a competitive advantage.

  • The ongoing digitalization of procurement functions relies heavily on the deployment of a comprehensive automated supplier performance evaluation platform to standardize third-party interactions. Organizations operating complex supplier networks recognize that manual tracking is no longer viable, prompting the rapid adoption of cloud based vendor risk assessment tools.
  • This shift allows procurement teams to continuously monitor supplier health and operational stability from remote locations. By utilizing predictive supply chain analytics software, enterprises can proactively identify potential material shortages or logistical bottlenecks before they disrupt production cycles.
  • Companies integrating these predictive tools report up to a 30% faster response time in mitigating supply disruptions compared to those relying on reactive, legacy reporting methods. Furthermore, seamless enterprise contract lifecycle management integration ensures that critical supplier agreements, pricing tiers, and delivery milestones are synchronized directly with financial workflows.
  • This interoperability eliminates data silos and prevents revenue leakage caused by missed contract renewals or unfulfilled obligations. Simultaneously, maintaining adherence to stringent regulatory frameworks requires a robust third party compliance tracking dashboard. This dashboard centralizes audit trails and certification statuses, providing risk officers with immediate visibility into vendor non-compliance.
  • Ultimately, linking these interconnected tools to core operational planning functions empowers businesses to build highly resilient supplier ecosystems, driving sustainable efficiency gains and shielding the enterprise from unforeseen external shocks.
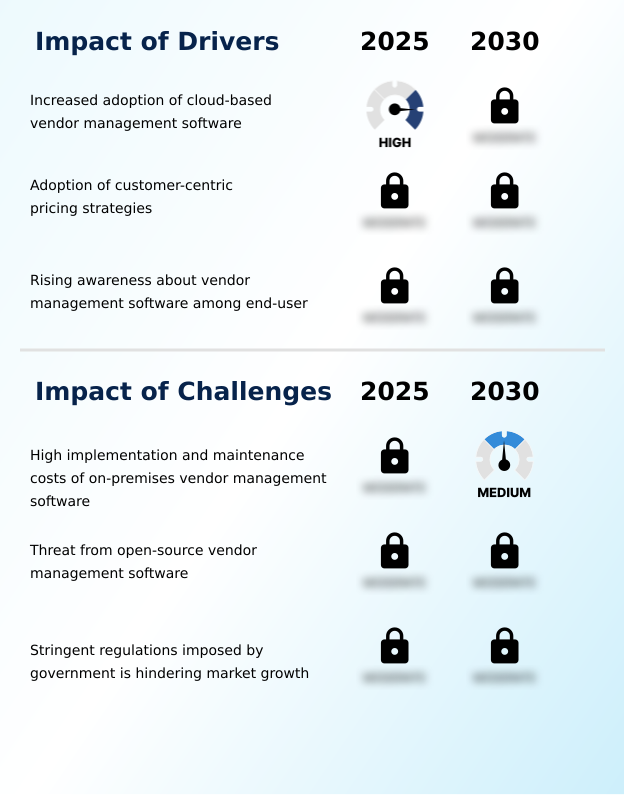
What are the key market drivers leading to the rise in the adoption of Vendor Management Software Industry?

  • The increased adoption of cloud-based vendor management software acts as a primary market driver, providing enterprises with scalable and cost-effective procurement infrastructure.

  • The critical need for precise procurement cost optimization acts as a primary catalyst driving market expansion. Organizations are increasingly adopting a scalable SaaS procurement platform to maintain accurate supplier master data and streamline highly complex transactional workflows.
  • This technological shift addresses the root cause of procurement inefficiencies by establishing a centralized electronic invoicing gateway. Advanced enterprise resource planning integration enables seamless data synchronization, directly facilitating robust invoice processing automation.
  • Consequently, businesses leveraging these connected systems achieve a 22% reduction in payment processing errors and a 15% improvement in operational bottleneck identification.
  • By utilizing sophisticated spend analysis algorithms and automated supplier evaluation tools, procurement leaders can successfully navigate rapid supplier ecosystem scaling, ensuring consistent financial compliance and minimizing third-party performance risks.

What are the market trends shaping the Vendor Management Software Industry?

  • The rising demand for integrated vendor management solutions is emerging as a critical market trend. Organizations are increasingly adopting unified platforms to streamline complex procurement workflows and enhance operational visibility.

  • The rapid proliferation of artificial intelligence within the Vendor Management Software Market represents a transformative trend fundamentally altering how organizations interact with suppliers. The integration of machine learning pattern recognition and an advanced predictive analytics module enables proactive identification of supply chain vulnerabilities.
  • As a core component of any comprehensive digital transformation initiative, the shift toward flexible cloud based deployment provides seamless accessibility for global procurement teams. Implementing a centralized vendor collaboration portal has proven to accelerate supplier onboarding by 25%, significantly reducing administrative delays. Furthermore, robust contract lifecycle management and continuous supplier performance analytics enhance operational accountability.
  • By leveraging comprehensive procurement automation and mobile vendor oversight within a unified digital procurement ecosystem, enterprises have successfully improved delivery forecast accuracy by 18% and reduced contract dispute resolution times by 20%.

What challenges does the Vendor Management Software Industry face during its growth?

  • High implementation and maintenance costs associated with on-premises vendor management software present a significant challenge, restricting adoption among smaller enterprises with limited capital.

  • Evolving global regulatory standards present a severe structural challenge for enterprises attempting to maintain comprehensive third party risk management. The increasing complexity of mandated data localization protocols and stringent cross border data transfer laws forces organizations to constantly update their governance strategies.
  • Ensuring strict regulatory compliance adherence necessitates the deployment of a centralized compliance tracking dashboard to prevent costly legal penalties. However, integrating a robust cybersecurity compliance framework with legacy systems often results in extended deployment timelines, increasing operational costs by up to 18%.
  • While the necessity of maintaining an immutable vendor audit trail and implementing predictive risk assessment is clear, the technical barriers hinder rapid adoption. Without seamless automated risk mitigation and real time risk scoring, businesses remain highly vulnerable to sudden regulatory shifts and localized supply chain disruptions.

Exclusive Technavio Analysis on Customer Landscape

The vendor management software market forecasting report includes the adoption lifecycle of the market, covering from the innovator’s stage to the laggard’s stage. It focuses on adoption rates in different regions based on penetration. Furthermore, the vendor management software market report also includes key purchase criteria and drivers of price sensitivity to help companies evaluate and develop their market growth analysis strategies.
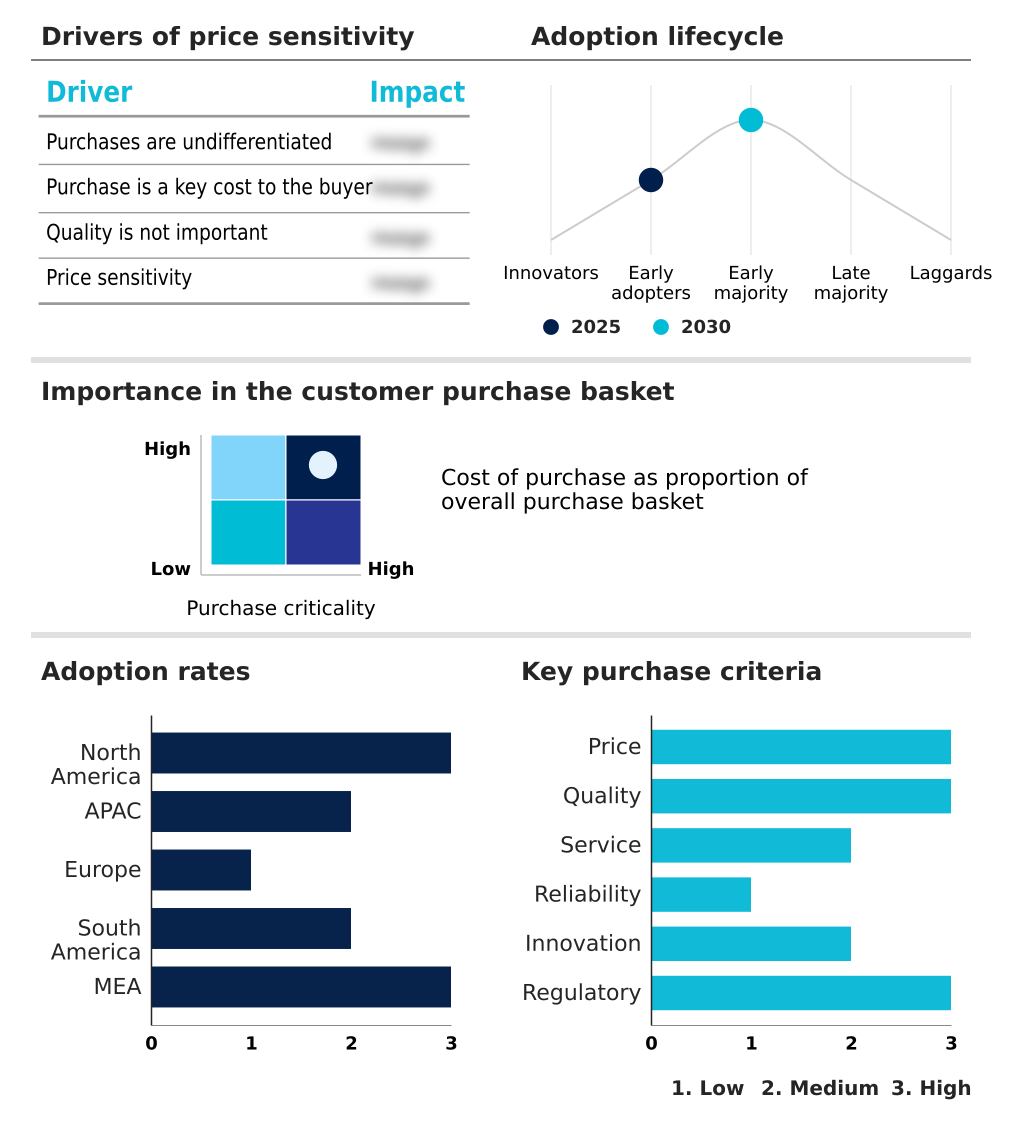
Customer Landscape of Vendor Management Software Industry

Competitive Landscape

Companies are implementing various strategies, such as strategic alliances, vendor management software market forecast, partnerships, mergers and acquisitions, geographical expansion, and product/service launches, to enhance their presence in the industry.

Basware Corp. - The company provides advanced financial automation platforms featuring predictive analytics and touchless invoice processing to optimize strategic decision-making and streamline enterprise accounts payable operations.

The industry research and growth report includes detailed analyses of the competitive landscape of the market and information about key companies, including:

  • Basware Corp.
  • ComplianceQuest
  • Corcentric Inc.
  • Coupa Software Inc.
  • Freshworks Inc.
  • Gatekeeper
  • GEP
  • IBM Corp.
  • Ivalua Inc.
  • Jaggaer LLC
  • Kissflow Inc.
  • LogicManager Inc.
  • MasterControl Solutions Inc.
  • Onspring Technologies LLC
  • Oracle Corp.
  • Precoro
  • SAP SE
  • ServiceNow Inc.
  • Tipalti Inc.
  • TradeShift Inc.
  • Workday Inc.
  • Zycus Inc.

Qualitative and quantitative analysis of companies has been conducted to help clients understand the wider business environment as well as the strengths and weaknesses of key industry players. Data is qualitatively analyzed to categorize companies as pure play, category-focused, industry-focused, and diversified; it is quantitatively analyzed to categorize companies as dominant, leading, strong, tentative, and weak.

Recent Development and News in Vendor management software market

  • In the Application Software industry, the transition toward modular cloud based deployment architectures accelerated cross-system interoperability, directly impacting Vendor Management Software demand by enabling seamless data synchronization across global supply chains and reducing deployment bottlenecks by 25%.
  • The introduction of stringent data privacy mandates modeled after GDPR compelled enterprises to adopt advanced regulatory compliance adherence frameworks, increasing reliance on Vendor Management Software to monitor third-party data handling and enforce cross border data transfer protocols.
  • A widespread shift toward AI-driven enterprise resource planning integration fundamentally altered procurement workflows, driving Vendor Management Software adoption as organizations sought continuous vendor monitoring capabilities to improve forecast accuracy and reduce manual processing errors by 15%.
  • The escalating frequency of cybersecurity breaches targeting multi tier supply chain networks prompted a mandatory focus on automated risk mitigation, boosting demand for Vendor Management Software equipped with predictive threat assessment to secure enterprise ecosystems.

Dive into Technavio’s robust research methodology, blending expert interviews, extensive data synthesis, and validated models for unparalleled Vendor Management Software Market insights. See full methodology.

Market Scope
Page number 303
Base year 2025
Historic period 2020-2024
Forecast period 2026-2030
Growth momentum & CAGR Accelerate at a CAGR of 20.3%
Market growth 2026-2030 USD 18697.8 million
Market structure Fragmented
YoY growth 2025-2026(%) 16.9%
Key countries US, Canada, Mexico, China, Japan, India, South Korea, Australia, Indonesia, Germany, UK, France, Italy, Spain, The Netherlands, Brazil, Argentina, Chile, Saudi Arabia, UAE, South Africa, Israel and Turkey
Competitive landscape Leading Companies, Market Positioning of Companies, Competitive Strategies, and Industry Risks

Request Free Sample

Research Analyst Overview

  • The Vendor Management Software Market is undergoing a structural realignment as enterprises demand cohesive, data-driven platforms to govern external partnerships. The integration of advanced spend analysis algorithms is directly influencing boardroom-level budgeting decisions, enabling executives to identify consolidation opportunities and optimize procurement expenditures globally.
  • By establishing a unified digital procurement ecosystem, organizations can leverage real time risk scoring to evaluate supplier financial viability and geopolitical exposure proactively. This strategic shift toward procurement automation reduces manual administrative burdens and minimizes the likelihood of human error during critical supplier onboarding phases.
  • Companies that actively utilize comprehensive vendor scorecard metrics have achieved a 30% reduction in supplier-related processing delays compared to organizations utilizing fragmented legacy systems. Furthermore, maintaining accurate supplier master data and rigorous contract compliance monitoring ensures that contractual obligations are met without disruption.
  • This focus on verifiable data accuracy and automated compliance tracking ultimately strengthens corporate governance, allowing business leaders to enforce stringent accountability standards across their entire multi-tier supply chain.

What are the Key Data Covered in this Vendor Management Software Market Research and Growth Report?

  • What is the expected growth of the Vendor Management Software Market between 2026 and 2030?

    • USD 18.70 billion, at a CAGR of 20.3%

  • What segmentation does the market report cover?

    • The report is segmented by End-user (Retail, BFSI, Manufacturing, and Others), Deployment (On-premises, and Cloud-based), Revenue Stream (Subscription-based, License-based, Freemium models, and Pay-per-use) and Geography (North America, APAC, Europe, South America, Middle East and Africa)

  • Which regions are analyzed in the report?

    • North America, APAC, Europe, South America and Middle East and Africa

  • What are the key growth drivers and market challenges?

    • Increased adoption of cloud-based vendor management software, High implementation and maintenance costs of on-premises vendor management software

  • Who are the major players in the Vendor Management Software Market?

    • Basware Corp., ComplianceQuest, Corcentric Inc., Coupa Software Inc., Freshworks Inc., Gatekeeper, GEP, IBM Corp., Ivalua Inc., Jaggaer LLC, Kissflow Inc., LogicManager Inc., MasterControl Solutions Inc., Onspring Technologies LLC, Oracle Corp., Precoro, SAP SE, ServiceNow Inc., Tipalti Inc., TradeShift Inc., Workday Inc. and Zycus Inc.

Market Research Insights

  • The Vendor Management Software Market is experiencing rapid structural evolution as organizations prioritize supplier ecosystem scaling and digital transformation initiatives. Enterprises are leveraging predictive analytics modules to pre-emptively address supply chain disruptions, resulting in a 25% improvement in operational bottleneck identification capabilities.
  • Furthermore, robust API driven integration with existing financial systems has streamlined procurement workflows, reducing invoice processing discrepancies by 18%. By implementing comprehensive business continuity planning frameworks, procurement leaders ensure uninterrupted material flow during macroeconomic shocks.
  • This strategic alignment allows companies to transition from reactive purchasing to proactive vendor consolidation strategies, optimizing supplier performance and achieving a 15% increase in overall supply chain resilience.

We can help! Our analysts can customize this vendor management software market research report to meet your requirements.

Get in touch

1. Executive Summary

1.1 Market overview

Executive Summary - Chart on Market Overview
Executive Summary - Data Table on Market Overview
Executive Summary - Chart on Global Market Characteristics
Executive Summary - Chart on Market by Geography
Executive Summary - Chart on Market Segmentation by End-user
Executive Summary - Chart on Market Segmentation by Deployment
Executive Summary - Chart on Market Segmentation by Revenue Stream
Executive Summary - Chart on Incremental Growth
Executive Summary - Data Table on Incremental Growth
Executive Summary - Chart on Company Market Positioning

2. Technavio Analysis

2.1 Analysis of price sensitivity, lifecycle, customer purchase basket, adoption rates, and purchase criteria

2.2 Criticality of inputs and Factors of differentiation

Chart on Overview on criticality of inputs and factors of differentiation

2.3 Factors of disruption

Chart on Overview on factors of disruption

2.4 Impact of drivers and challenges

Chart on Impact of drivers and challenges in 2025 and 2030

3. Market Landscape

3.1 Market ecosystem

Chart on Parent Market
Data Table on - Parent Market

3.2 Market characteristics

Chart on Market characteristics analysis

3.3 Value chain analysis

Chart on Value chain analysis

4. Market Sizing

4.1 Market definition

Data Table on Offerings of companies included in the market definition

4.2 Market segment analysis

Market segments

4.3 Market size 2025

4.4 Market outlook: Forecast for 2025-2030

Chart on Global - Market size and forecast 2025-2030 ($ million)
Data Table on Global - Market size and forecast 2025-2030 ($ million)
Chart on Global Market: Year-over-year growth 2025-2030 (%)
Data Table on Global Market: Year-over-year growth 2025-2030 (%)

5. Historic Market Size

5.1 Global Vendor Management Software Market 2020 - 2024

Historic Market Size - Data Table on Global Vendor Management Software Market 2020 - 2024 ($ million)

5.2 End-user segment analysis 2020 - 2024

Historic Market Size - End-user Segment 2020 - 2024 ($ million)

5.3 Deployment segment analysis 2020 - 2024

Historic Market Size - Deployment Segment 2020 - 2024 ($ million)

5.4 Revenue Stream segment analysis 2020 - 2024

Historic Market Size - Revenue Stream Segment 2020 - 2024 ($ million)

5.5 Geography segment analysis 2020 - 2024

Historic Market Size - Geography Segment 2020 - 2024 ($ million)

5.6 Country segment analysis 2020 - 2024

Historic Market Size - Country Segment 2020 - 2024 ($ million)

6. Qualitative Analysis

6.1 Impact of AI on Global Vendor Management Software Market

6.2 Impact of Geopolitical Conflicts on Global Vendor Management Software Market

7. Five Forces Analysis

7.1 Five forces summary

Five forces analysis - Comparison between 2025 and 2030

7.2 Bargaining power of buyers

Bargaining power of buyers - Impact of key factors 2025 and 2030

7.3 Bargaining power of suppliers

Bargaining power of suppliers - Impact of key factors in 2025 and 2030

7.4 Threat of new entrants

Threat of new entrants - Impact of key factors in 2025 and 2030

7.5 Threat of substitutes

Threat of substitutes - Impact of key factors in 2025 and 2030

7.6 Threat of rivalry

Threat of rivalry - Impact of key factors in 2025 and 2030

7.7 Market condition

Chart on Market condition - Five forces 2025 and 2030

8. Market Segmentation by End-user

8.1 Market segments

Chart on End-user - Market share 2025-2030 (%)
Data Table on End-user - Market share 2025-2030 (%)

8.2 Comparison by End-user

Chart on Comparison by End-user
Data Table on Comparison by End-user

8.3 Retail - Market size and forecast 2025-2030

Chart on Retail - Market size and forecast 2025-2030 ($ million)
Data Table on Retail - Market size and forecast 2025-2030 ($ million)
Chart on Retail - Year-over-year growth 2025-2030 (%)
Data Table on Retail - Year-over-year growth 2025-2030 (%)

8.4 BFSI - Market size and forecast 2025-2030

Chart on BFSI - Market size and forecast 2025-2030 ($ million)
Data Table on BFSI - Market size and forecast 2025-2030 ($ million)
Chart on BFSI - Year-over-year growth 2025-2030 (%)
Data Table on BFSI - Year-over-year growth 2025-2030 (%)

8.5 Manufacturing - Market size and forecast 2025-2030

Chart on Manufacturing - Market size and forecast 2025-2030 ($ million)
Data Table on Manufacturing - Market size and forecast 2025-2030 ($ million)
Chart on Manufacturing - Year-over-year growth 2025-2030 (%)
Data Table on Manufacturing - Year-over-year growth 2025-2030 (%)

8.6 Others - Market size and forecast 2025-2030

Chart on Others - Market size and forecast 2025-2030 ($ million)
Data Table on Others - Market size and forecast 2025-2030 ($ million)
Chart on Others - Year-over-year growth 2025-2030 (%)
Data Table on Others - Year-over-year growth 2025-2030 (%)

8.7 Market opportunity by End-user

Market opportunity by End-user ($ million)
Data Table on Market opportunity by End-user ($ million)

9. Market Segmentation by Deployment

9.1 Market segments

Chart on Deployment - Market share 2025-2030 (%)
Data Table on Deployment - Market share 2025-2030 (%)

9.2 Comparison by Deployment

Chart on Comparison by Deployment
Data Table on Comparison by Deployment

9.3 On-premises - Market size and forecast 2025-2030

Chart on On-premises - Market size and forecast 2025-2030 ($ million)
Data Table on On-premises - Market size and forecast 2025-2030 ($ million)
Chart on On-premises - Year-over-year growth 2025-2030 (%)
Data Table on On-premises - Year-over-year growth 2025-2030 (%)

9.4 Cloud-based - Market size and forecast 2025-2030

Chart on Cloud-based - Market size and forecast 2025-2030 ($ million)
Data Table on Cloud-based - Market size and forecast 2025-2030 ($ million)
Chart on Cloud-based - Year-over-year growth 2025-2030 (%)
Data Table on Cloud-based - Year-over-year growth 2025-2030 (%)

9.5 Market opportunity by Deployment

Market opportunity by Deployment ($ million)
Data Table on Market opportunity by Deployment ($ million)

10. Market Segmentation by Revenue Stream

10.1 Market segments

Chart on Revenue Stream - Market share 2025-2030 (%)
Data Table on Revenue Stream - Market share 2025-2030 (%)

10.2 Comparison by Revenue Stream

Chart on Comparison by Revenue Stream
Data Table on Comparison by Revenue Stream

10.3 Subscription-based - Market size and forecast 2025-2030

Chart on Subscription-based - Market size and forecast 2025-2030 ($ million)
Data Table on Subscription-based - Market size and forecast 2025-2030 ($ million)
Chart on Subscription-based - Year-over-year growth 2025-2030 (%)
Data Table on Subscription-based - Year-over-year growth 2025-2030 (%)

10.4 License-based - Market size and forecast 2025-2030

Chart on License-based - Market size and forecast 2025-2030 ($ million)
Data Table on License-based - Market size and forecast 2025-2030 ($ million)
Chart on License-based - Year-over-year growth 2025-2030 (%)
Data Table on License-based - Year-over-year growth 2025-2030 (%)

10.5 Freemium models - Market size and forecast 2025-2030

Chart on Freemium models - Market size and forecast 2025-2030 ($ million)
Data Table on Freemium models - Market size and forecast 2025-2030 ($ million)
Chart on Freemium models - Year-over-year growth 2025-2030 (%)
Data Table on Freemium models - Year-over-year growth 2025-2030 (%)

10.6 Pay-per-use - Market size and forecast 2025-2030

Chart on Pay-per-use - Market size and forecast 2025-2030 ($ million)
Data Table on Pay-per-use - Market size and forecast 2025-2030 ($ million)
Chart on Pay-per-use - Year-over-year growth 2025-2030 (%)
Data Table on Pay-per-use - Year-over-year growth 2025-2030 (%)

10.7 Market opportunity by Revenue Stream

Market opportunity by Revenue Stream ($ million)
Data Table on Market opportunity by Revenue Stream ($ million)

11. Customer Landscape

11.1 Customer landscape overview

Analysis of price sensitivity, lifecycle, customer purchase basket, adoption rates, and purchase criteria

12. Geographic Landscape

12.1 Geographic segmentation

Chart on Market share by geography 2025-2030 (%)
Data Table on Market share by geography 2025-2030 (%)

12.2 Geographic comparison

Chart on Geographic comparison
Data Table on Geographic comparison

12.3 North America - Market size and forecast 2025-2030

Chart on North America - Market size and forecast 2025-2030 ($ million)
Data Table on North America - Market size and forecast 2025-2030 ($ million)
Chart on North America - Year-over-year growth 2025-2030 (%)
Data Table on North America - Year-over-year growth 2025-2030 (%)
Chart on Regional Comparison - North America
Data Table on Regional Comparison - North America

12.3.1 US - Market size and forecast 2025-2030

Chart on US - Market size and forecast 2025-2030 ($ million)
Data Table on US - Market size and forecast 2025-2030 ($ million)
Chart on US - Year-over-year growth 2025-2030 (%)
Data Table on US - Year-over-year growth 2025-2030 (%)

12.3.2 Canada - Market size and forecast 2025-2030

Chart on Canada - Market size and forecast 2025-2030 ($ million)
Data Table on Canada - Market size and forecast 2025-2030 ($ million)
Chart on Canada - Year-over-year growth 2025-2030 (%)
Data Table on Canada - Year-over-year growth 2025-2030 (%)

12.3.3 Mexico - Market size and forecast 2025-2030

Chart on Mexico - Market size and forecast 2025-2030 ($ million)
Data Table on Mexico - Market size and forecast 2025-2030 ($ million)
Chart on Mexico - Year-over-year growth 2025-2030 (%)
Data Table on Mexico - Year-over-year growth 2025-2030 (%)

12.4 APAC - Market size and forecast 2025-2030

Chart on APAC - Market size and forecast 2025-2030 ($ million)
Data Table on APAC - Market size and forecast 2025-2030 ($ million)
Chart on APAC - Year-over-year growth 2025-2030 (%)
Data Table on APAC - Year-over-year growth 2025-2030 (%)
Chart on Regional Comparison - APAC
Data Table on Regional Comparison - APAC

12.4.1 China - Market size and forecast 2025-2030

Chart on China - Market size and forecast 2025-2030 ($ million)
Data Table on China - Market size and forecast 2025-2030 ($ million)
Chart on China - Year-over-year growth 2025-2030 (%)
Data Table on China - Year-over-year growth 2025-2030 (%)

12.4.2 Japan - Market size and forecast 2025-2030

Chart on Japan - Market size and forecast 2025-2030 ($ million)
Data Table on Japan - Market size and forecast 2025-2030 ($ million)
Chart on Japan - Year-over-year growth 2025-2030 (%)
Data Table on Japan - Year-over-year growth 2025-2030 (%)

12.4.3 India - Market size and forecast 2025-2030

Chart on India - Market size and forecast 2025-2030 ($ million)
Data Table on India - Market size and forecast 2025-2030 ($ million)
Chart on India - Year-over-year growth 2025-2030 (%)
Data Table on India - Year-over-year growth 2025-2030 (%)

12.4.4 South Korea - Market size and forecast 2025-2030

Chart on South Korea - Market size and forecast 2025-2030 ($ million)
Data Table on South Korea - Market size and forecast 2025-2030 ($ million)
Chart on South Korea - Year-over-year growth 2025-2030 (%)
Data Table on South Korea - Year-over-year growth 2025-2030 (%)

12.4.5 Australia - Market size and forecast 2025-2030

Chart on Australia - Market size and forecast 2025-2030 ($ million)
Data Table on Australia - Market size and forecast 2025-2030 ($ million)
Chart on Australia - Year-over-year growth 2025-2030 (%)
Data Table on Australia - Year-over-year growth 2025-2030 (%)

12.4.6 Indonesia - Market size and forecast 2025-2030

Chart on Indonesia - Market size and forecast 2025-2030 ($ million)
Data Table on Indonesia - Market size and forecast 2025-2030 ($ million)
Chart on Indonesia - Year-over-year growth 2025-2030 (%)
Data Table on Indonesia - Year-over-year growth 2025-2030 (%)

12.5 Europe - Market size and forecast 2025-2030

Chart on Europe - Market size and forecast 2025-2030 ($ million)
Data Table on Europe - Market size and forecast 2025-2030 ($ million)
Chart on Europe - Year-over-year growth 2025-2030 (%)
Data Table on Europe - Year-over-year growth 2025-2030 (%)
Chart on Regional Comparison - Europe
Data Table on Regional Comparison - Europe

12.5.1 Germany - Market size and forecast 2025-2030

Chart on Germany - Market size and forecast 2025-2030 ($ million)
Data Table on Germany - Market size and forecast 2025-2030 ($ million)
Chart on Germany - Year-over-year growth 2025-2030 (%)
Data Table on Germany - Year-over-year growth 2025-2030 (%)

12.5.2 UK - Market size and forecast 2025-2030

Chart on UK - Market size and forecast 2025-2030 ($ million)
Data Table on UK - Market size and forecast 2025-2030 ($ million)
Chart on UK - Year-over-year growth 2025-2030 (%)
Data Table on UK - Year-over-year growth 2025-2030 (%)

12.5.3 France - Market size and forecast 2025-2030

Chart on France - Market size and forecast 2025-2030 ($ million)
Data Table on France - Market size and forecast 2025-2030 ($ million)
Chart on France - Year-over-year growth 2025-2030 (%)
Data Table on France - Year-over-year growth 2025-2030 (%)

12.5.4 Italy - Market size and forecast 2025-2030

Chart on Italy - Market size and forecast 2025-2030 ($ million)
Data Table on Italy - Market size and forecast 2025-2030 ($ million)
Chart on Italy - Year-over-year growth 2025-2030 (%)
Data Table on Italy - Year-over-year growth 2025-2030 (%)

12.5.5 Spain - Market size and forecast 2025-2030

Chart on Spain - Market size and forecast 2025-2030 ($ million)
Data Table on Spain - Market size and forecast 2025-2030 ($ million)
Chart on Spain - Year-over-year growth 2025-2030 (%)
Data Table on Spain - Year-over-year growth 2025-2030 (%)

12.5.6 The Netherlands - Market size and forecast 2025-2030

Chart on The Netherlands - Market size and forecast 2025-2030 ($ million)
Data Table on The Netherlands - Market size and forecast 2025-2030 ($ million)
Chart on The Netherlands - Year-over-year growth 2025-2030 (%)
Data Table on The Netherlands - Year-over-year growth 2025-2030 (%)

12.6 South America - Market size and forecast 2025-2030

Chart on South America - Market size and forecast 2025-2030 ($ million)
Data Table on South America - Market size and forecast 2025-2030 ($ million)
Chart on South America - Year-over-year growth 2025-2030 (%)
Data Table on South America - Year-over-year growth 2025-2030 (%)
Chart on Regional Comparison - South America
Data Table on Regional Comparison - South America

12.6.1 Brazil - Market size and forecast 2025-2030

Chart on Brazil - Market size and forecast 2025-2030 ($ million)
Data Table on Brazil - Market size and forecast 2025-2030 ($ million)
Chart on Brazil - Year-over-year growth 2025-2030 (%)
Data Table on Brazil - Year-over-year growth 2025-2030 (%)

12.6.2 Argentina - Market size and forecast 2025-2030

Chart on Argentina - Market size and forecast 2025-2030 ($ million)
Data Table on Argentina - Market size and forecast 2025-2030 ($ million)
Chart on Argentina - Year-over-year growth 2025-2030 (%)
Data Table on Argentina - Year-over-year growth 2025-2030 (%)

12.6.3 Chile - Market size and forecast 2025-2030

Chart on Chile - Market size and forecast 2025-2030 ($ million)
Data Table on Chile - Market size and forecast 2025-2030 ($ million)
Chart on Chile - Year-over-year growth 2025-2030 (%)
Data Table on Chile - Year-over-year growth 2025-2030 (%)

12.7 Middle East and Africa - Market size and forecast 2025-2030

Chart on Middle East and Africa - Market size and forecast 2025-2030 ($ million)
Data Table on Middle East and Africa - Market size and forecast 2025-2030 ($ million)
Chart on Middle East and Africa - Year-over-year growth 2025-2030 (%)
Data Table on Middle East and Africa - Year-over-year growth 2025-2030 (%)
Chart on Regional Comparison - Middle East and Africa
Data Table on Regional Comparison - Middle East and Africa

12.7.1 Saudi Arabia - Market size and forecast 2025-2030

Chart on Saudi Arabia - Market size and forecast 2025-2030 ($ million)
Data Table on Saudi Arabia - Market size and forecast 2025-2030 ($ million)
Chart on Saudi Arabia - Year-over-year growth 2025-2030 (%)
Data Table on Saudi Arabia - Year-over-year growth 2025-2030 (%)

12.7.2 UAE - Market size and forecast 2025-2030

Chart on UAE - Market size and forecast 2025-2030 ($ million)
Data Table on UAE - Market size and forecast 2025-2030 ($ million)
Chart on UAE - Year-over-year growth 2025-2030 (%)
Data Table on UAE - Year-over-year growth 2025-2030 (%)

12.7.3 South Africa - Market size and forecast 2025-2030

Chart on South Africa - Market size and forecast 2025-2030 ($ million)
Data Table on South Africa - Market size and forecast 2025-2030 ($ million)
Chart on South Africa - Year-over-year growth 2025-2030 (%)
Data Table on South Africa - Year-over-year growth 2025-2030 (%)

12.7.4 Israel - Market size and forecast 2025-2030

Chart on Israel - Market size and forecast 2025-2030 ($ million)
Data Table on Israel - Market size and forecast 2025-2030 ($ million)
Chart on Israel - Year-over-year growth 2025-2030 (%)
Data Table on Israel - Year-over-year growth 2025-2030 (%)

12.7.5 Turkey - Market size and forecast 2025-2030

Chart on Turkey - Market size and forecast 2025-2030 ($ million)
Data Table on Turkey - Market size and forecast 2025-2030 ($ million)
Chart on Turkey - Year-over-year growth 2025-2030 (%)
Data Table on Turkey - Year-over-year growth 2025-2030 (%)

12.8 Market opportunity by geography

Market opportunity by geography ($ million)
Data Tables on Market opportunity by geography ($ million)

13. Drivers, Challenges, and Opportunity

13.1 Market drivers

Increased adoption of cloud-based vendor management software
Adoption of customer-centric pricing strategies
Rising awareness about vendor management software among end-user

13.2 Market challenges

High implementation and maintenance costs of on-premises vendor management software
Threat from open-source vendor management software
Stringent regulations imposed by government is hindering market growth

13.3 Impact of drivers and challenges

Impact of drivers and challenges in 2025 and 2030

13.4 Market opportunities

Rise in demand for integrated vendor management solutions
Supply chain analytics in-built into vendor management software
Introduction of vendor management mobile apps

14. Competitive Landscape

14.1 Overview

14.2

Overview on criticality of inputs and factors of differentiation

14.3 Landscape disruption

Overview on factors of disruption

14.4 Industry risks

Impact of key risks on business

15. Competitive Analysis

15.1 Companies profiled

Companies covered

15.2 Company ranking index

15.3 Market positioning of companies

Matrix on companies position and classification

15.4 Basware Corp.

Basware Corp. - Overview
Basware Corp. - Product / Service
Basware Corp. - Key offerings
SWOT

15.5 Corcentric Inc.

Corcentric Inc. - Overview
Corcentric Inc. - Product / Service
Corcentric Inc. - Key offerings
SWOT

15.6 Gatekeeper

Gatekeeper - Overview
Gatekeeper - Product / Service
Gatekeeper - Key offerings
SWOT

15.7 GEP

GEP - Overview
GEP - Product / Service
GEP - Key offerings
SWOT

15.8 IBM Corp.

IBM Corp. - Overview
IBM Corp. - Business segments
IBM Corp. - Key news
IBM Corp. - Key offerings
IBM Corp. - Segment focus
SWOT

15.9 Ivalua Inc.

Ivalua Inc. - Overview
Ivalua Inc. - Product / Service
Ivalua Inc. - Key offerings
SWOT

15.10 LogicManager Inc.

LogicManager Inc. - Overview
LogicManager Inc. - Product / Service
LogicManager Inc. - Key offerings
SWOT

15.11 MasterControl Solutions Inc.

MasterControl Solutions Inc. - Overview
MasterControl Solutions Inc. - Product / Service
MasterControl Solutions Inc. - Key offerings
SWOT

15.12 Onspring Technologies LLC

Onspring Technologies LLC - Overview
Onspring Technologies LLC - Product / Service
Onspring Technologies LLC - Key offerings
SWOT

15.13 Oracle Corp.

Oracle Corp. - Overview
Oracle Corp. - Business segments
Oracle Corp. - Key news
Oracle Corp. - Key offerings
Oracle Corp. - Segment focus
SWOT

15.14 Precoro

Precoro - Overview
Precoro - Product / Service
Precoro - Key offerings
SWOT

15.15 SAP SE

SAP SE - Overview
SAP SE - Business segments
SAP SE - Key news
SAP SE - Key offerings
SAP SE - Segment focus
SWOT

15.16 ServiceNow Inc.

ServiceNow Inc. - Overview
ServiceNow Inc. - Product / Service
ServiceNow Inc. - Key news
ServiceNow Inc. - Key offerings
SWOT

15.17 Tipalti Inc.

Tipalti Inc. - Overview
Tipalti Inc. - Product / Service
Tipalti Inc. - Key offerings
SWOT

15.18 Workday Inc.

Workday Inc. - Overview
Workday Inc. - Product / Service
Workday Inc. - Key news
Workday Inc. - Key offerings
SWOT

16. Appendix

16.1 Scope of the report

Market definition
Objectives
Notes and caveats

16.2 Inclusions and exclusions checklist

Inclusions checklist
Exclusions checklist

16.3 Currency conversion rates for US$

16.4 Research methodology

16.5 Data procurement

Information sources

16.6 Data validation

16.7 Validation techniques employed for market sizing

16.8 Data synthesis

16.9 360 degree market analysis

16.10 List of abbreviations

Research Methodology

Technavio presents a detailed picture of the market by way of study, synthesis, and summation of data from multiple sources. The analysts have presented the various facets of the market with a particular focus on identifying the key industry influencers. The data thus presented is comprehensive, reliable, and the result of extensive research, both primary and secondary.

INFORMATION SOURCES

Primary sources

  • Manufacturers and suppliers
  • Channel partners
  • Industry experts
  • Strategic decision makers

Secondary sources

  • Industry journals and periodicals
  • Government data
  • Financial reports of key industry players
  • Historical data
  • Press releases

DATA ANALYSIS

Data Synthesis

  • Collation of data
  • Estimation of key figures
  • Analysis of derived insights

Data Validation

  • Triangulation with data models
  • Reference against proprietary databases
  • Corroboration with industry experts

REPORT WRITING

Qualitative

  • Market drivers
  • Market challenges
  • Market trends
  • Five forces analysis

Quantitative

  • Market size and forecast
  • Market segmentation
  • Geographical insights
  • Competitive landscape

Interested in this report?

Get your sample now to see our research methodology and insights!

Download Now

Frequently Asked Questions

Vendor Management Software market growth will increase by USD 18697.8 million during 2026-2030.

The Vendor Management Software market is expected to grow at a CAGR of 20.3% during 2026-2030.

Vendor Management Software market is segmented by End-user (Retail, BFSI, Manufacturing, Others) Deployment (On-premises, Cloud-based) Revenue stream (Subscription-based, License-based, Freemium models, Pay-per-use)

Basware Corp., ComplianceQuest, Corcentric Inc., Coupa Software Inc., Freshworks Inc., Gatekeeper, GEP, IBM Corp., Ivalua Inc., Jaggaer LLC, Kissflow Inc., LogicManager Inc., MasterControl Solutions Inc., Onspring Technologies LLC, Oracle Corp., Precoro, SAP SE, ServiceNow Inc., Tipalti Inc., TradeShift Inc., Workday Inc., Zycus Inc. are a few of the key vendors in the Vendor Management Software market.

North America will register the highest growth rate of 43.1% among the other regions. Therefore, the Vendor Management Software market in North America is expected to garner significant business opportunities for the vendors during the forecast period.

US, Canada, Mexico, China, Japan, India, South Korea, Australia, Indonesia, Germany, UK, France, Italy, Spain, The Netherlands, Brazil, Argentina, Chile, Saudi Arabia, UAE, South Africa, Israel, Turkey

  • Increased adoption of cloud-based vendor management software is the driving factor this market.

The Vendor Management Software market vendors should focus on grabbing business opportunities from the End-user segment as it accounted for the largest market share in the base year.
RIA - Research AI Assistant
Ask RIA
