Veterinary CRO Market Size 2024-2028
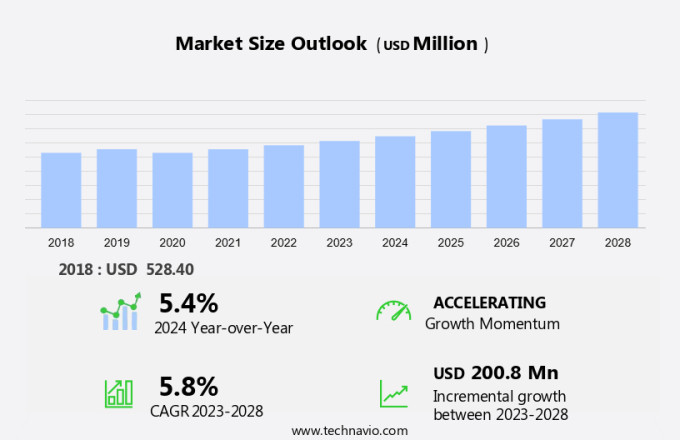
The veterinary CRO market size is forecast to increase by USD 200.8 million at a CAGR of 5.8% between 2023 and 2028.
- The veterinary CRO market is experiencing significant growth due to several key drivers. The rise in pet ownership and the subsequent increase in the diseased population among companion animals are primary factors fueling market expansion. Strict government regulations, particularly in relation to animal seizures and the ethical treatment of animals in clinical trials, are also influencing market trends.
- Moreover, outsourcing of veterinary research to contract research organizations (CROs) and the advancement of clinical trials in various phases, including oncology trials for dogs, further contribute to market growth. The human resource access required for the development and production of veterinary drugs is another critical factor driving market development. Overall, the veterinary drugs industry is witnessing substantial growth and innovation, with a focus on improving animal health and welfare.
What will be the Size of the Market During the Forecast Period?
- The veterinary clinical research and development (CRO) market plays a crucial role in advancing the field of veterinary medicine. This sector focuses on ensuring the safety, efficacy, and regulatory compliance of veterinary drugs and treatments. Animal health economics is a significant consideration within the market. Veterinary drug trials are conducted to assess the safety, efficacy, and optimal dosing of new treatments. These trials adhere to strict animal health policies and regulations to ensure the welfare of the animals involved. Veterinary data processing is an integral part of the clinical research process.
- Moreover, it involves collecting, analyzing, and interpreting data from various sources, including PK/PD studies and tolerance studies, to inform veterinary treatment plans and improve animal health innovation. Animal diseases pose a constant threat to animal populations and require ongoing research and development. Veterinary medicine technology, including veterinary toxicology, is essential in identifying and addressing these diseases. Ethical considerations, such as veterinary research ethics, are paramount in ensuring the humane treatment of animals during research. Animal health development is a collaborative effort between veterinary CROs, researchers, and policymakers. Animal health regulations and legislation are crucial in ensuring the safety and efficacy of veterinary treatments.
- Pet travel and pet ownership are growing trends, leading to an increased demand for veterinary care. Pet medication online and pet health insurance are becoming more accessible, making veterinary marketing and education essential components of the market. Animal behavior and welfare are also important areas of research within the market. Animal training, animal shelters, and animal rights are all topics that require ongoing research and innovation to improve the lives of animals. Pet care tips and pet health insurance are essential services for pet owners. Veterinary legislation and pet grooming are important considerations for pet owners and veterinary professionals alike.
- In conclusion, the veterinary clinical research and development market plays a vital role in advancing the field of veterinary medicine. It is essential in ensuring the safety, efficacy, and regulatory compliance of veterinary treatments, while also addressing the ongoing needs of animal health and welfare.
How is this market segmented and which is the largest segment?
The market research report provides comprehensive data (region-wise segment analysis), with forecasts and estimates in "USD million" for the period 2024-2028, as well as historical data from 2018-2022 for the following segments.
- Type
- Clinical trials
- Toxicology
- Market authorization and regulatory support
- Geography
- North America
- Canada
- Mexico
- US
- Europe
- Germany
- UK
- France
- Spain
- Asia
- China
- India
- Japan
- Rest of World (ROW)
- North America
By Type Insights
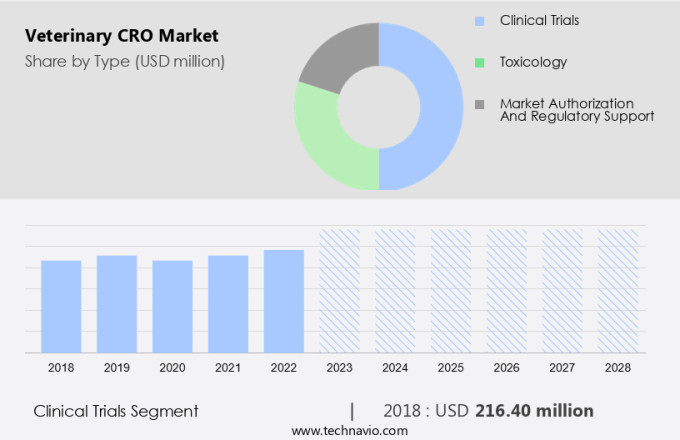
- The clinical trials segment is estimated to witness significant growth during the forecast period.
The veterinary Contract Research Organizations (CRO) market plays a significant role in the advancement of animal healthcare through outsourcing clinical trials. These trials are essential for investigating new treatments and therapies for various animal diseases. The clinical trials segment is the largest sector in the market. Animal clinical trials encompass a wide range of research areas, including the development of new medications, diagnostic methods, surgical procedures, and equipment. These trials can improve the quality of life for dogs, particularly those with chronic illnesses, by offering innovative treatments and solutions. The initiation of a veterinary clinical study requires approval from multiple committees.
Moreover, these committees ensure that the study adheres to Good Clinical Practice (GCP) standards. GCP guarantees the accuracy of data, ethical treatment of animals, and protection of their welfare and rights throughout the trial process. Contract research organizations (CROs) are instrumental in managing and executing these trials, providing human resource access and expertise to the veterinary industry. By outsourcing clinical trials to CROs, the industry can focus on its core competencies while ensuring the highest standards of animal care and scientific rigor. Clinical trials in veterinary medicine undergo various phases, from phase 1 (safety and dosage) to phase 3 (efficacy and long-term safety).
The successful completion of these trials is crucial for the approval of new veterinary drugs and treatments. In conclusion, the market plays a vital role in the development and implementation of new treatments and therapies for animals. The clinical trials segment, which is dominated by CROs, is a crucial component of this market, ensuring the ethical and scientifically sound investigation of new treatments and the protection of animal welfare.
Get a glance at the market report of share of various segments Request Free Sample
The clinical trials segment was valued at USD 216.40 million in 2018 and showed a gradual increase during the forecast period.
Regional Analysis
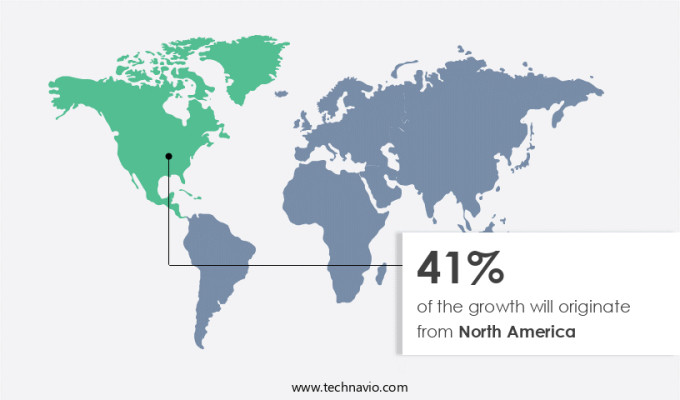
- North America is estimated to contribute 41% to the growth of the global market during the forecast period.
Technavio's analysts have elaborately explained the regional trends and drivers that shape the market during the forecast period.
For more insights on the market share of various regions Request Free Sample
In North America, the veterinary Contract Research Organizations (CRO) market experienced significant growth in 2023, fueled by the rise in pet ownership and increased spending on animal healthcare. The region's advanced healthcare industry necessitates rigorous testing of new formulations and treatments for animals before they can be administered. Moreover, the expanding livestock population and the need for efficient healthcare management in the agricultural sector further contribute to the market's expansion. The adoption of companion animals and livestock for social well-being and a healthy lifestyle in North America has led to heightened awareness and concern for their health. Consequently, veterinary drug manufacturers increasingly rely on veterinary CROs to provide toxicology services, formulation development, and research for new treatments and formulations to meet the growing demand for effective animal healthcare solutions.
Market Dynamics
Our researchers analyzed the data with 2023 as the base year, along with the key drivers, trends, and challenges. A holistic analysis of drivers will help companies refine their marketing strategies to gain a competitive advantage.
What are the key market drivers leading to the rise in adoption of Veterinary CRO Market?
An increase in ownership of companion animals is the key driver of the market.
- The expansion of pet ownership and populations in the United States offers significant opportunities for the veterinary industry to boost profitability. According to World Population Review, the US is the global leader in pet ownership, with an estimated 70 million domestic dogs and 74 million domestic cats in 2024. The COVID-19 pandemic has had minimal impact on these numbers, as more individuals working from home adopted pets at an increased rate. Pets provide companionship and emotional support, and they can also contribute to maintaining good health. The veterinary drug lifecycle involves the development, manufacturing, and regulatory submissions of innovative treatments for animals.
- Moreover, stringent regulations ensure the efficient production and safety of veterinary therapeutics. Veterinary Contract Development and Manufacturing Organizations (CDMOs) play a crucial role in the drug development process, providing expertise in manufacturing and production. As the demand for veterinary therapeutics grows, so does the need for efficient and effective production methods. The veterinary industry is committed to delivering high-quality treatments for pets while adhering to regulatory standards.
What are the market trends shaping the Veterinary CRO Market?
An increase in the prevalence of diseases among companion animals is the upcoming trend in the market.
- The market in the United States is witnessing significant growth due to the increasing prevalence of various health conditions in companion animals and livestock. Neurological disorders, obesity, diabetes, and heartworm disease are some of the common health issues diagnosed in canine and feline populations. Diabetes Mellitus, a chronic condition, requires ongoing treatment and careful monitoring, leading to an increase in veterinary clinic visits.
- Moreover, infectious diseases in animals pose a threat not only to animal health but also to human health through zoonoses. These diseases, such as atrophic rhinitis, bluetongue, bovine spongiform encephalopathy (BSE), avian influenza, swine influenza, and bovine diarrhea, can significantly impact livestock production and sales. To ensure the safety and efficacy of veterinary medicines and animal health products, multi-site clinical trials are conducted. These trials involve data processing and analysis to obtain market authorization. Higher education institutions and veterinary CROs play a crucial role in conducting field studies and providing expertise in veterinary medicine. Animal health expenditure in the US is expected to continue growing due to the increasing awareness of animal welfare and the importance of preventive care. The veterinary Cro industry is a critical contributor to this expenditure, providing essential goods and services to ensure the health and wellbeing of animals.
What challenges does Veterinary CRO Market face during the growth?
Stringent government regulations are key challenges affecting market growth.
- In the United States, the Food and Drug Administration (FDA), the Environmental Protection Agency (EPA, and the United States Department of Agriculture (USDA) oversee the approval process for animal medicines, ensuring they meet the same stringent safety and efficacy standards as human medicines. Animal medicines, including advanced veterinary drugs, biologics, and companion animal medications, undergo rigorous research and testing before being cleared for production and commercialization. The approval process can take five to seven years and cost tens of millions of dollars.
- However, CDMOs (Contract Development and Manufacturing Organizations) play a crucial role in the production of these advanced therapies, particularly for small-scale production. Biotechnology companies often partner with CDMOs to bring their animal medicines to market. Regulatory services are essential throughout the process to ensure compliance with FDA, USDA, and EPA guidelines. The FDA's rigorous approval process safeguards animals, humans, and the environment by ensuring the safety, purity, and efficacy of animal medicines.
Exclusive Customer Landscape
The market forecasting report includes the adoption lifecycle of the market, covering from the innovator's stage to the laggard's stage. It focuses on adoption rates in different regions based on penetration. Furthermore, the market report also includes key purchase criteria and drivers of price sensitivity to help companies evaluate and develop their market growth analysis strategies.
Customer Landscape
Key Companies & Market Insights
Companies are implementing various strategies, such as strategic alliances, market forecast, partnerships, mergers and acquisitions, geographical expansion, and product/service launches, to enhance their presence in the market.
The market research and growth report includes detailed analyses of the competitive landscape of the market and information about key companies, including:
- Argenta Ltd.
- Avogadro LS
- Cebiphar
- Charles River Laboratories International Inc.
- Clinvet
- GD
- Ictyopharma
- Invetus
- Kingfisher International
- KLIFOVET GmbH
- knoell
- Lohlein and Wolf vet research
- Oncovet Clinical Research
- ONDAX Scientific SL
- Ridgeway Research Ltd.
- Rockstep Solutions
- RTI LLC
- Veterinary Research Management
- VETSPIN SRL
- Wageningen University and Research
Qualitative and quantitative analysis of companies has been conducted to help clients understand the wider business environment as well as the strengths and weaknesses of key market players. Data is qualitatively analyzed to categorize companies as pure play, category-focused, industry-focused, and diversified; it is quantitatively analyzed to categorize companies as dominant, leading, strong, tentative, and weak.
Research Analyst Overview
The veterinary CRO industry plays a significant role in the advancement of veterinary medicine by providing goods and services related to animal health research. This industry focuses on various areas, including neurology, oncology, dermatology, gastrointestinal disorders, and toxicology studies for dogs, cats, and other companion animals, as well as livestock populations. Field studies and clinical trials are crucial components of the veterinary CRO industry. These organizations provide clinical trial services, including contract research organizations (CROs), to veterinary drug manufacturers for all phases of drug development. CROs offer outsourcing solutions for various aspects of research, such as human resource access, formulation development, and regulatory submissions.
In summary, the veterinary CRO industry caters to a diseased population, ensuring the efficient production of veterinary drugs and advanced therapies, including biologics and innovative treatments. Stringent regulations govern the industry to ensure the safety and efficacy of veterinary medications. Veterinary CDMOs and CROs offer regulatory services to help navigate the complex regulatory landscape. Animal health expenditure continues to grow, driven by increasing pet ownership and the need for advanced veterinary treatments. The veterinary drug lifecycle involves various stages, from discovery to manufacturing and market authorization. The industry is also seeing an increase in multi-site clinical trials and the development of new formulations to address unmet medical needs.
|
Market Scope |
|
|
Report Coverage |
Details |
|
Page number |
159 |
|
Base year |
2023 |
|
Historic period |
2018-2022 |
|
Forecast period |
2024-2028 |
|
Growth momentum & CAGR |
Accelerate at a CAGR of 5.8% |
|
Market growth 2024-2028 |
USD 200.8 million |
|
Market structure |
Fragmented |
|
YoY growth 2023-2024(%) |
5.4 |
|
Key countries |
US, Canada, Germany, China, UK, Mexico, France, Japan, India, and Spain |
|
Competitive landscape |
Leading Companies, Market Positioning of Companies, Competitive Strategies, and Industry Risks |
What are the Key Data Covered in this Market Research and Growth Report?
- CAGR of the market during the forecast period
- Detailed information on factors that will drive the market growth and forecasting between 2024 and 2028
- Precise estimation of the size of the market and its contribution of the market in focus to the parent market
- Accurate predictions about upcoming market growth and trends and changes in consumer behaviour
- Growth of the market across North America, Europe, Asia, and Rest of World (ROW)
- Thorough analysis of the market's competitive landscape and detailed information about companies
- Comprehensive analysis of factors that will challenge the growth of market companies
We can help! Our analysts can customize this market research report to meet your requirements. Get in touch


