Vibrating Conveyors Market Analysis, Size, and Forecast 2026-2030: APAC (China, India, and Japan), Europe (Germany, UK, and France), North America (US, Canada, and Mexico), South America (Brazil and Argentina), Middle East and Africa (Saudi Arabia, South Africa, and UAE), and Rest of World (ROW)

Vibrating Conveyors Market Analysis, Size, and Forecast 2026-2030:
APAC (China, India, and Japan), Europe (Germany, UK, and France), North America (US, Canada, and Mexico), South America (Brazil and Argentina), Middle East and Africa (Saudi Arabia, South Africa, and UAE), and Rest of World (ROW)

Published: Jan 2026 292 Pages SKU: IRTNTR74029

Market Overview at a Glance

$154.6 Mn
Market Opportunity
2.1%
CAGR 2025 - 2030
36%
APAC Growth
$385.5 Mn
Pharmaceuticals segment 2024

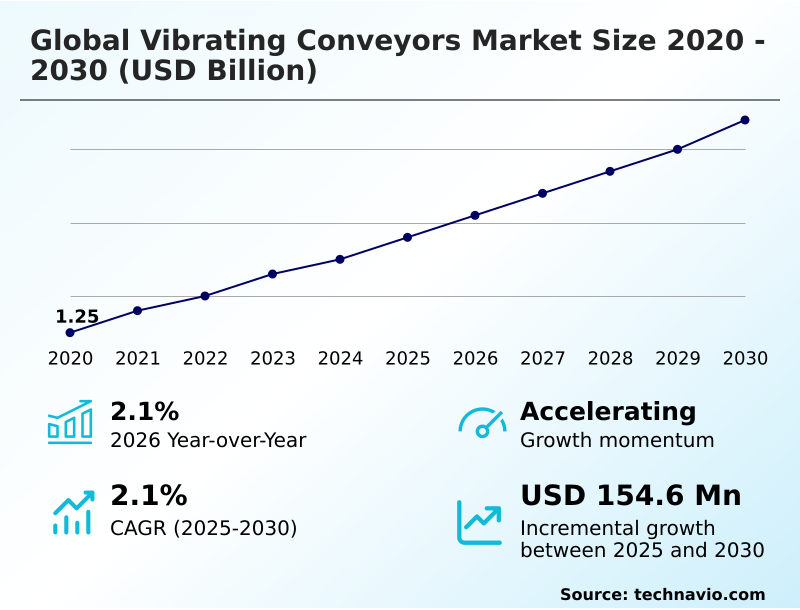
Vibrating Conveyors Market Size 2026-2030

The vibrating conveyors market size is valued to increase by USD 154.6 million, at a CAGR of 2.1% from 2025 to 2030. Acceleration of sanitary automation in food and pharmaceutical sectors will drive the vibrating conveyors market.

Major Market Trends & Insights

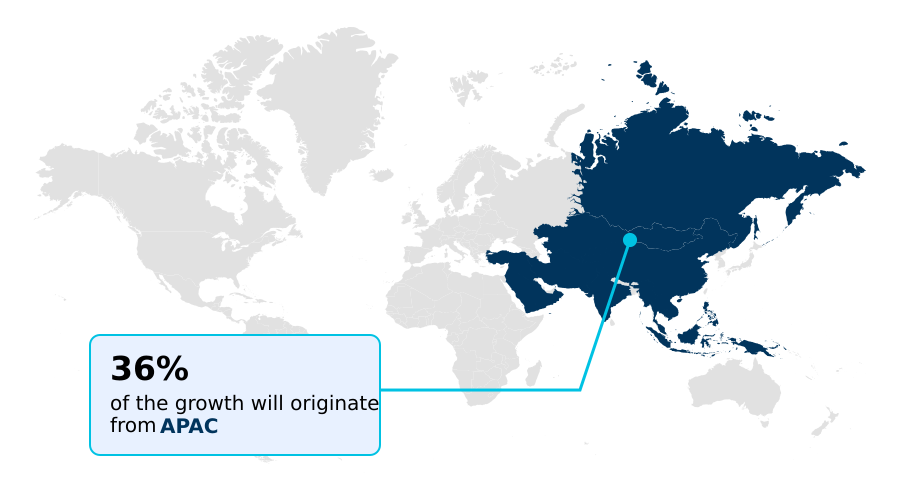
  • APAC dominated the market and accounted for a 36% growth during the forecast period.
  • By End-user - Pharmaceuticals segment was valued at USD 385.5 million in 2024
  • By Type - Mechanical segment accounted for the largest market revenue share in 2024

Market Size & Forecast

  • Market Opportunities: USD 284.2 million
  • Market Future Opportunities: USD 154.6 million
  • CAGR from 2025 to 2030 : 2.1%

Market Summary

  • The vibrating conveyors market is foundational to modern industrial operations, facilitating the efficient movement of bulk materials across sectors from mining to food processing. A primary driver is the accelerating push for sanitary automation, where monolithic stainless steel troughs and hygienic processing lines replace traditional systems to comply with stringent food safety mandates.
  • Concurrently, the mining industry's need for energy-efficient material handling to process declining ore grades sustainably fuels demand for equipment with advanced exciter drives. Technology is evolving rapidly, with a significant trend toward integrating Industrial Internet of Things (IIoT) sensors for predictive maintenance, which transforms equipment from passive assets into smart, data-generating systems.
  • For instance, a food processing plant can deploy a network of sanitary vibratory conveyors to automate the distribution of fragile snacks to multiple packaging machines, drastically reducing manual labor and minimizing product breakage. However, the market also contends with challenges such as high initial capital costs and the operational complexities of meeting new occupational health regulations for particulate matter control.

What will be the Size of the Vibrating Conveyors Market during the forecast period?

Get Key Insights on Market Forecast (PDF) Request Free Sample

How is the Vibrating Conveyors Market Segmented?

The vibrating conveyors industry research report provides comprehensive data (region-wise segment analysis), with forecasts and estimates in "USD million" for the period 2026-2030, as well as historical data from 2020-2024 for the following segments.
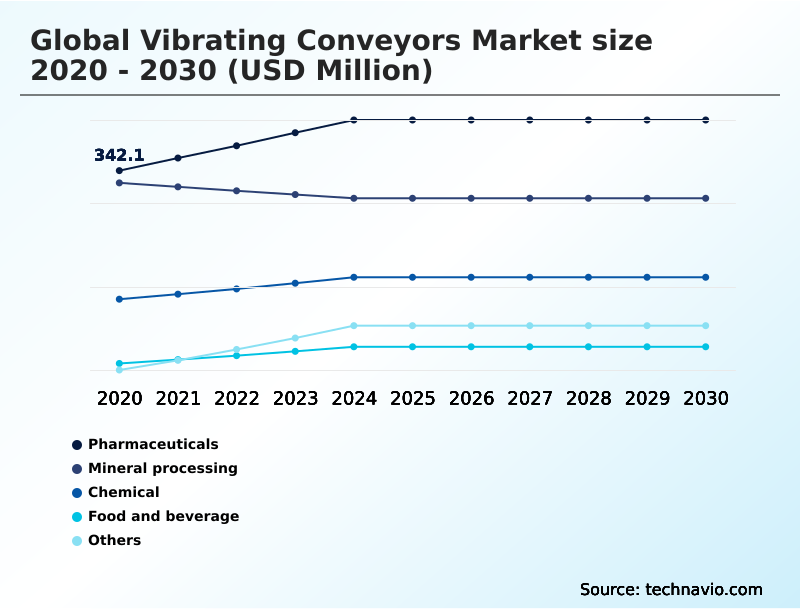
  • End-user
    • Pharmaceuticals
    • Mineral processing
    • Chemical
    • Food and beverage
    • Others
  • Type
    • Mechanical
    • Electromagnetic
  • Product type
    • Light or medium duty
    • Heavy duty
  • Geography
    • APAC
      • China
      • India
      • Japan
    • Europe
      • Germany
      • UK
      • France
    • North America
      • US
      • Canada
      • Mexico
    • South America
      • Brazil
      • Argentina
    • Middle East and Africa
      • Saudi Arabia
      • South Africa
      • UAE
    • Rest of World (ROW)

By End-user Insights

The pharmaceuticals segment is estimated to witness significant growth during the forecast period.

The pharmaceutical segment's adoption of advanced vibratory conveying is driven by the industry's shift to continuous manufacturing and the stringent requirements for high-containment processing.

To meet rigorous Good Manufacturing Practice (GMP) standards, there is a heightened demand for sanitary conveying solutions and gravimetric feeders that deliver precise material flows with high accuracy.

This technology is crucial for handling high-potency active pharmaceutical ingredients (APIs) and excipients. The integration of Process Analytical Technology (PAT) with vibratory equipment for bulk material handling allows for real-time adjustments, ensuring process control and product consistency.

In automated high-potency drug production, implementing specialized vibratory feeders has led to a 100% increase in production capacity while ensuring operator safety through hermetic sealing.

Request Free Sample

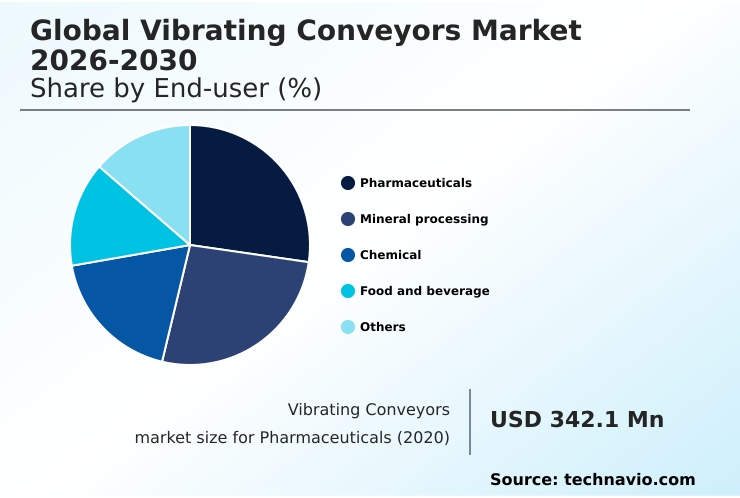
The Pharmaceuticals segment was valued at USD 385.5 million in 2024 and showed a gradual increase during the forecast period.

Request Free Sample

Regional Analysis

APAC is estimated to contribute 36% to the growth of the global market during the forecast period.Technavio’s analysts have elaborately explained the regional trends and drivers that shape the market during the forecast period.

See How Vibrating Conveyors Market Demand is Rising in APAC Request Free Sample

The geographic landscape of the vibrating conveyors market is diverse, with distinct regional drivers shaping demand.

In APAC, which accounts for approximately 36% of the market's incremental growth, the expansion of mining and the automation of food processing are key catalysts.

North America, contributing around 29% of growth, is heavily influenced by stringent regulatory updates, such as new occupational safety rules that mandate dust exposure limits below 50 micrograms per cubic meter, driving the adoption of enclosed vibratory feeders.

Europe's market is characterized by a focus on the circular economy and energy efficiency, with operators retrofitting existing systems with advanced exciter drives to lower operational costs.

Across all regions, the demand for vibratory equipment for bulk material handling and heavy-duty screening applications remains robust, tailored to specific industrial needs.

Market Dynamics

Our researchers analyzed the data with 2025 as the base year, along with the key drivers, trends, and challenges. A holistic analysis of drivers will help companies refine their marketing strategies to gain a competitive advantage.

  • The application of vibrating conveyors is expanding across multiple industries, each with specific requirements. The use of vibrating conveyors for food processing is a prominent area of innovation, where gentle product handling capabilities are critical for minimizing breakage of fragile items.
  • This intersects with the needs of sanitary vibratory conveyors for pharmaceuticals, which must adhere to the strictest hygiene and containment standards for active pharmaceutical ingredients. In heavy industry, heavy-duty conveyors for mineral processing are engineered for durability and high throughput.
  • A key consideration in this sector is the energy consumption of mechanical vibrating conveyors, leading to the development of systems that leverage natural frequency design to optimize efficiency. The integration of predictive maintenance for vibrating screens is becoming standard, as it can reduce unplanned downtime by more than 50% compared to reactive maintenance schedules.
  • The market offers a wide range of solutions, from high-capacity brute force feeders to precision electromagnetic vibratory feeders. Other specialized applications include vibrating conveyors in recycling plants and mobile vibratory screening solutions for construction sites.
  • The comparison between belt conveyors and vibrating conveyors often centers on sanitation and maintenance, while the choice between mechanical and electromagnetic vibrating conveyors depends on the need for precision versus raw power. Finally, vibratory feeders for packaging lines are essential for high-speed, automated operations.

What are the key market drivers leading to the rise in the adoption of Vibrating Conveyors Industry?

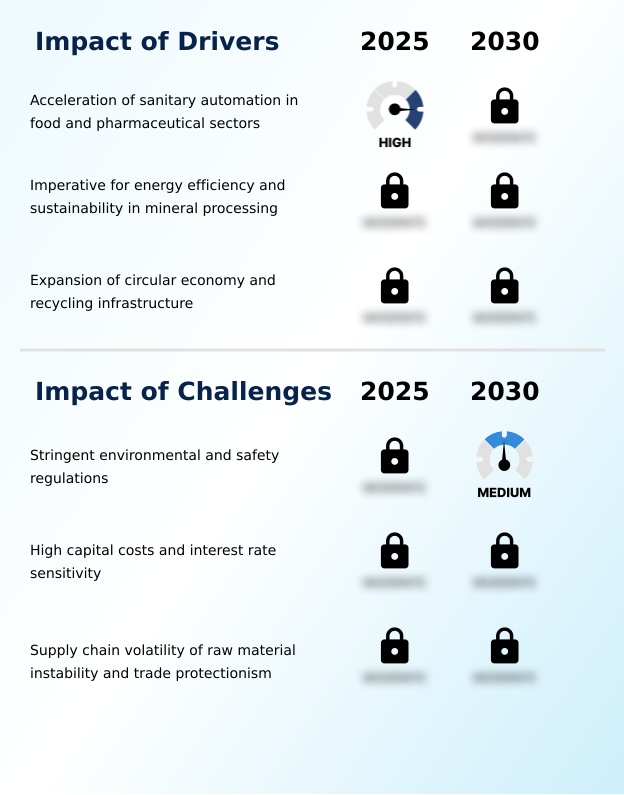
  • The acceleration of sanitary automation within the food and pharmaceutical sectors stands as a primary driver for market growth.

  • The market is propelled by three primary drivers: the acceleration of sanitary automation, the demand for energy-efficient material handling, and the global expansion of recycling infrastructure.
  • In the food and pharmaceutical sectors, a push for automation to combat labor shortages and meet stringent food safety compliance standards is increasing demand for hygienic processing lines.
  • In mining, the need to process larger volumes of low-grade ore sustainably is driving the adoption of next-generation vibratory equipment that reduces energy consumption by up to 20%.
  • This aligns with corporate ESG commitments and provides a rapid return on investment.
  • The operationalization of the circular economy, particularly in Europe, necessitates investment in material recovery facilities where vibratory feeders and screens are essential for separating waste streams, supporting higher recycling rates and resource efficiency.

What are the market trends shaping the Vibrating Conveyors Industry?

  • The integration of digital intelligence and Industrial Internet of Things (IIoT) technologies for predictive maintenance is an emergent trend reshaping the vibrating conveyors market.

  • Key trends reshaping the market include the integration of digital intelligence and the shift toward mobile recycling solutions. Smart manufacturing initiatives are driving the adoption of systems with embedded sensors for condition-based monitoring, which has been shown to reduce unplanned downtime by over 30% in heavy industrial settings. This move toward data-driven uptime management is critical in remote mining operations.
  • Concurrently, the convergence of hygienic design and high-capacity automation is transforming the food processing sector. New sanitary vibratory conveyors feature open-frame construction and electropolished surfaces, which can cut cleaning times by half compared to legacy equipment.
  • Furthermore, the expansion of the circular economy is fueling demand for modular, mobile vibrating screens that enable on-site processing of construction and demolition waste, aligning with global sustainability goals and resource recovery mandates.

What challenges does the Vibrating Conveyors Industry face during its growth?

  • The imposition of stringent environmental and safety regulations presents a significant challenge to the industry's growth trajectory.

  • The market faces significant challenges from a stringent regulatory landscape, high capital costs, and supply chain volatility. Intensifying occupational health regulations, such as the rule lowering permissible silica dust exposure to 50 micrograms per cubic meter, mandate expensive engineering controls like enclosed systems for particulate matter control. This increases the total cost of ownership and can slow equipment sales cycles.
  • Economically, high initial capital investment, magnified by elevated interest rates, leads to project deferrals, with capital expenditure on heavy machinery declining in some regions. Furthermore, geopolitical tensions and trade protectionism have introduced raw material instability, with steel tariff increases of 25% in certain corridors disrupting production costs and lead times, complicating long-term project planning and supply chain resilience.

Exclusive Technavio Analysis on Customer Landscape

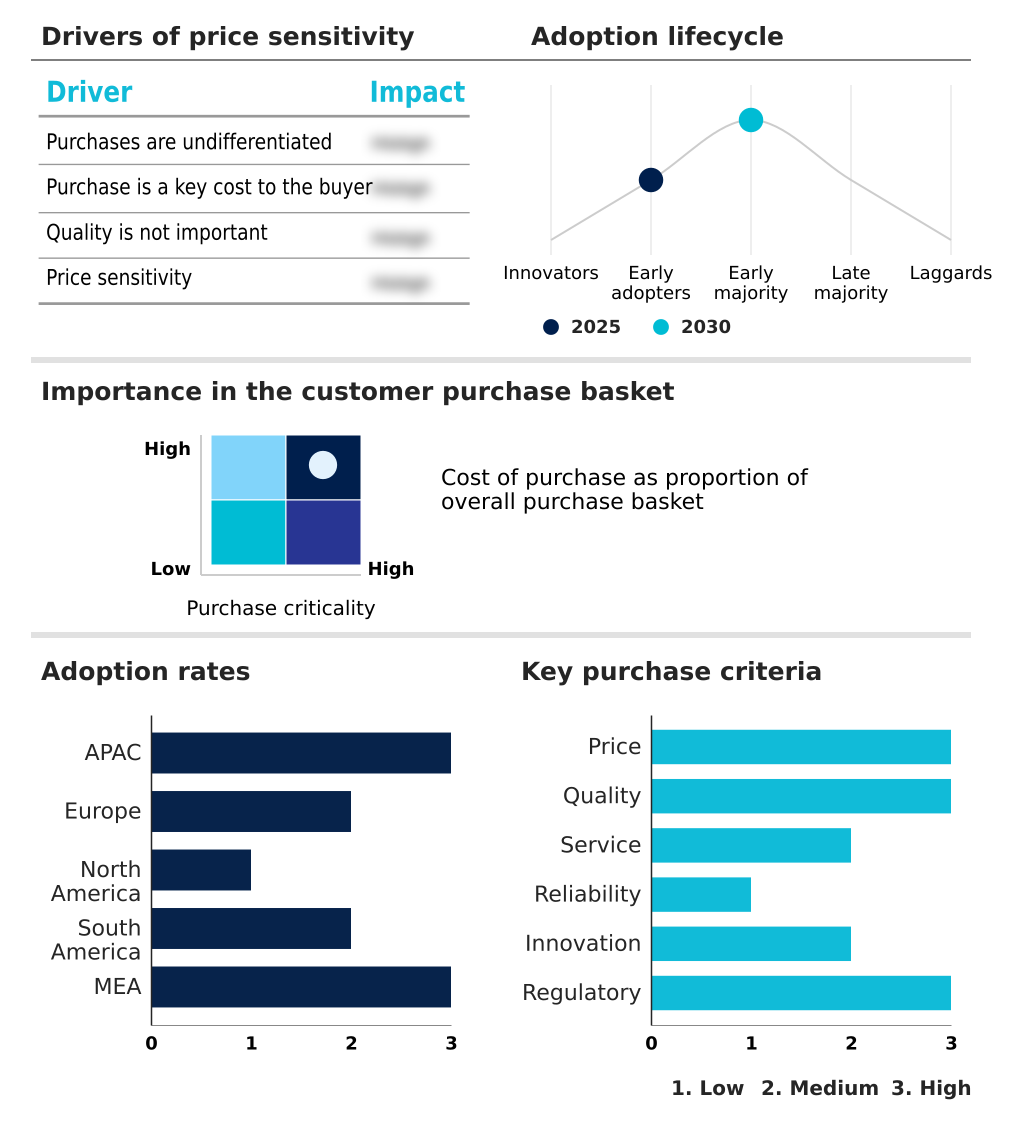
The vibrating conveyors market forecasting report includes the adoption lifecycle of the market, covering from the innovator’s stage to the laggard’s stage. It focuses on adoption rates in different regions based on penetration. Furthermore, the vibrating conveyors market report also includes key purchase criteria and drivers of price sensitivity to help companies evaluate and develop their market growth analysis strategies.

Customer Landscape of Vibrating Conveyors Industry

Competitive Landscape

Companies are implementing various strategies, such as strategic alliances, vibrating conveyors market forecast, partnerships, mergers and acquisitions, geographical expansion, and product/service launches, to enhance their presence in the industry.

AViTEQ Vibrationstechnik GmbH - Offers robust vibratory and rotary equipment, including para-mount models, engineered for processing diverse bulk materials across various industrial applications.

The industry research and growth report includes detailed analyses of the competitive landscape of the market and information about key companies, including:

  • AViTEQ Vibrationstechnik GmbH
  • Bruks Siwertell Group
  • Carrier Vibrating Equipment Inc.
  • Duravant LLC
  • GEA Group AG
  • General Kinematics Corp.
  • JOST GmbH Co. KG
  • Kadant Inc.
  • Kinergy Corp.
  • N.M. Heilig B.V.
  • RHEWUM GmbH
  • ROLLIVIBRA S.L.
  • Schenck Process Holding GmbH
  • SINFONIA TECHNOLOGY Co. Ltd.
  • Smalley Manufacturing Co.
  • Tarnos SA
  • Vibra Screw Inc.
  • Webster Industries Inc.

Qualitative and quantitative analysis of companies has been conducted to help clients understand the wider business environment as well as the strengths and weaknesses of key industry players. Data is qualitatively analyzed to categorize companies as pure play, category-focused, industry-focused, and diversified; it is quantitatively analyzed to categorize companies as dominant, leading, strong, tentative, and weak.

Recent Development and News in Vibrating conveyors market

  • In August 2024, Metso showcased its expanded Planet Positive portfolio at MINExpo International, highlighting new vibrating screens and feeders with reduced energy footprints for the mining industry.
  • In September 2024, Key Technology introduced a new line of high-capacity vibratory conveyors engineered to transport up to 100,000 pounds of product per hour for large-scale food processing.
  • In September 2024, Metso finalized its acquisition of Screen Machine Industries, a move designed to strengthen its market position in the North American mobile recycling and infrastructure sectors.
  • In March 2025, it was reported that Pfizer selected Coperion K-Tron's high-accuracy pharmaceutical feeders for its new high-containment manufacturing facility in Freiburg, Germany, to enhance automated drug production.

Dive into Technavio’s robust research methodology, blending expert interviews, extensive data synthesis, and validated models for unparalleled Vibrating Conveyors Market insights. See full methodology.

Market Scope
Page number 292
Base year 2025
Historic period 2020-2024
Forecast period 2026-2030
Growth momentum & CAGR Accelerate at a CAGR of 2.1%
Market growth 2026-2030 USD 154.6 million
Market structure Fragmented
YoY growth 2025-2026(%) 2.1%
Key countries China, India, Japan, South Korea, Australia, Indonesia, Germany, UK, France, Italy, Spain, The Netherlands, US, Canada, Mexico, Brazil, Argentina, Chile, Saudi Arabia, South Africa, UAE, Turkey and Egypt
Competitive landscape Leading Companies, Market Positioning of Companies, Competitive Strategies, and Industry Risks

Request Free Sample

Research Analyst Overview

  • The vibrating conveyors market is defined by its critical role in bulk material handling and the continuous evolution of its core technologies. The distinction between a mechanical vibrating conveyor and an electromagnetic vibrating conveyor dictates application suitability, with the former favored for brute force feeders in mining and the latter for precision dosing with electromagnetic vibratory feeders.
  • Growth is driven by the need for heavy-duty screening and sanitary conveying solutions across industrial verticals. In food and pharmaceuticals, equipment must provide gentle product handling capabilities and adhere to stringent cleanability standards. Key innovations focus on natural frequency design to improve energy efficiency and the use of advanced exciter drives in heavy-duty vibratory feeders.
  • The adoption of predictive maintenance for vibrating screens, using sensors to monitor performance, has been shown to more than double the interval between maintenance cycles. This trend toward digitalization represents a significant boardroom-level consideration, forcing a strategic shift in capital budgeting from procuring simple hardware to investing in integrated systems that guarantee uptime.
  • The market is also expanding into specialized areas like vibrating conveyors in recycling plants and mobile vibratory screening solutions.

What are the Key Data Covered in this Vibrating Conveyors Market Research and Growth Report?

  • What is the expected growth of the Vibrating Conveyors Market between 2026 and 2030?

    • USD 154.6 million, at a CAGR of 2.1%

  • What segmentation does the market report cover?

    • The report is segmented by End-user (Pharmaceuticals, Mineral processing, Chemical, Food and beverage, and Others), Type (Mechanical, and Electromagnetic), Product Type (Light or medium duty, and Heavy duty) and Geography (APAC, Europe, North America, South America, Middle East and Africa)

  • Which regions are analyzed in the report?

    • APAC, Europe, North America, South America and Middle East and Africa

  • What are the key growth drivers and market challenges?

    • Acceleration of sanitary automation in food and pharmaceutical sectors, Stringent environmental and safety regulations

  • Who are the major players in the Vibrating Conveyors Market?

    • AViTEQ Vibrationstechnik GmbH, Bruks Siwertell Group, Carrier Vibrating Equipment Inc., Duravant LLC, GEA Group AG, General Kinematics Corp., JOST GmbH Co. KG, Kadant Inc., Kinergy Corp., N.M. Heilig B.V., RHEWUM GmbH, ROLLIVIBRA S.L., Schenck Process Holding GmbH, SINFONIA TECHNOLOGY Co. Ltd., Smalley Manufacturing Co., Tarnos SA, Vibra Screw Inc. and Webster Industries Inc.

Market Research Insights

  • The dynamics of the vibrating conveyors market are shaped by the convergence of industrial automation, regulatory compliance, and operational efficiency. The adoption of hygienic processing lines in the food sector is accelerating, with facilities reporting up to a 40% reduction in cleaning and changeover times by using sanitary by design equipment.
  • In heavy industry, energy-efficient material handling is paramount; next-generation systems reduce power consumption by over 25% compared to legacy models. However, the market faces headwinds from stringent regulations regarding particulate matter control, mandating dust exposure levels below 50 micrograms per cubic meter in certain applications.
  • This regulatory pressure, coupled with supply chain resilience concerns and the need for food safety compliance, forces operators to balance capital expenditure with long-term performance and sustainability goals.

We can help! Our analysts can customize this vibrating conveyors market research report to meet your requirements.

Get in touch

1. Executive Summary

1.1 Market overview

Executive Summary - Chart on Market Overview
Executive Summary - Data Table on Market Overview
Executive Summary - Chart on Global Market Characteristics
Executive Summary - Chart on Market by Geography
Executive Summary - Chart on Market Segmentation by End-user
Executive Summary - Chart on Market Segmentation by Type
Executive Summary - Chart on Market Segmentation by Product Type
Executive Summary - Chart on Incremental Growth
Executive Summary - Data Table on Incremental Growth
Executive Summary - Chart on Company Market Positioning

2. Technavio Analysis

2.1 Analysis of price sensitivity, lifecycle, customer purchase basket, adoption rates, and purchase criteria

2.2 Criticality of inputs and Factors of differentiation

Chart on Overview on criticality of inputs and factors of differentiation

2.3 Factors of disruption

Chart on Overview on factors of disruption

2.4 Impact of drivers and challenges

Chart on Impact of drivers and challenges in 2025 and 2030

3. Market Landscape

3.1 Market ecosystem

Chart on Parent Market
Data Table on - Parent Market

3.2 Market characteristics

Chart on Market characteristics analysis

3.3 Value chain analysis

Chart on Value chain analysis

4. Market Sizing

4.1 Market definition

Data Table on Offerings of companies included in the market definition

4.2 Market segment analysis

Market segments

4.3 Market size 2025

4.4 Market outlook: Forecast for 2025-2030

Chart on Global - Market size and forecast 2025-2030 ($ million)
Data Table on Global - Market size and forecast 2025-2030 ($ million)
Chart on Global Market: Year-over-year growth 2025-2030 (%)
Data Table on Global Market: Year-over-year growth 2025-2030 (%)

5. Historic Market Size

5.1 Global Vibrating Conveyors Market 2020 - 2024

Historic Market Size - Data Table on Global Vibrating Conveyors Market 2020 - 2024 ($ million)

5.2 End-user segment analysis 2020 - 2024

Historic Market Size - End-user Segment 2020 - 2024 ($ million)

5.3 Type segment analysis 2020 - 2024

Historic Market Size - Type Segment 2020 - 2024 ($ million)

5.4 Product Type segment analysis 2020 - 2024

Historic Market Size - Product Type Segment 2020 - 2024 ($ million)

5.5 Geography segment analysis 2020 - 2024

Historic Market Size - Geography Segment 2020 - 2024 ($ million)

5.6 Country segment analysis 2020 - 2024

Historic Market Size - Country Segment 2020 - 2024 ($ million)

6. Qualitative Analysis

6.1 Impact of AI in the Global Vibrating Conveyors Market

7. Five Forces Analysis

7.1 Five forces summary

Five forces analysis - Comparison between 2025 and 2030

7.2 Bargaining power of buyers

Bargaining power of buyers - Impact of key factors 2025 and 2030

7.3 Bargaining power of suppliers

Bargaining power of suppliers - Impact of key factors in 2025 and 2030

7.4 Threat of new entrants

Threat of new entrants - Impact of key factors in 2025 and 2030

7.5 Threat of substitutes

Threat of substitutes - Impact of key factors in 2025 and 2030

7.6 Threat of rivalry

Threat of rivalry - Impact of key factors in 2025 and 2030

7.7 Market condition

Chart on Market condition - Five forces 2025 and 2030

8. Market Segmentation by End-user

8.1 Market segments

Chart on End-user - Market share 2025-2030 (%)
Data Table on End-user - Market share 2025-2030 (%)

8.2 Comparison by End-user

Chart on Comparison by End-user
Data Table on Comparison by End-user

8.3 Pharmaceuticals - Market size and forecast 2025-2030

Chart on Pharmaceuticals - Market size and forecast 2025-2030 ($ million)
Data Table on Pharmaceuticals - Market size and forecast 2025-2030 ($ million)
Chart on Pharmaceuticals - Year-over-year growth 2025-2030 (%)
Data Table on Pharmaceuticals - Year-over-year growth 2025-2030 (%)

8.4 Mineral processing - Market size and forecast 2025-2030

Chart on Mineral processing - Market size and forecast 2025-2030 ($ million)
Data Table on Mineral processing - Market size and forecast 2025-2030 ($ million)
Chart on Mineral processing - Year-over-year growth 2025-2030 (%)
Data Table on Mineral processing - Year-over-year growth 2025-2030 (%)

8.5 Chemical - Market size and forecast 2025-2030

Chart on Chemical - Market size and forecast 2025-2030 ($ million)
Data Table on Chemical - Market size and forecast 2025-2030 ($ million)
Chart on Chemical - Year-over-year growth 2025-2030 (%)
Data Table on Chemical - Year-over-year growth 2025-2030 (%)

8.6 Food and beverage - Market size and forecast 2025-2030

Chart on Food and beverage - Market size and forecast 2025-2030 ($ million)
Data Table on Food and beverage - Market size and forecast 2025-2030 ($ million)
Chart on Food and beverage - Year-over-year growth 2025-2030 (%)
Data Table on Food and beverage - Year-over-year growth 2025-2030 (%)

8.7 Others - Market size and forecast 2025-2030

Chart on Others - Market size and forecast 2025-2030 ($ million)
Data Table on Others - Market size and forecast 2025-2030 ($ million)
Chart on Others - Year-over-year growth 2025-2030 (%)
Data Table on Others - Year-over-year growth 2025-2030 (%)

8.8 Market opportunity by End-user

Market opportunity by End-user ($ million)
Data Table on Market opportunity by End-user ($ million)

9. Market Segmentation by Type

9.1 Market segments

Chart on Type - Market share 2025-2030 (%)
Data Table on Type - Market share 2025-2030 (%)

9.2 Comparison by Type

Chart on Comparison by Type
Data Table on Comparison by Type

9.3 Mechanical - Market size and forecast 2025-2030

Chart on Mechanical - Market size and forecast 2025-2030 ($ million)
Data Table on Mechanical - Market size and forecast 2025-2030 ($ million)
Chart on Mechanical - Year-over-year growth 2025-2030 (%)
Data Table on Mechanical - Year-over-year growth 2025-2030 (%)

9.4 Electromagnetic - Market size and forecast 2025-2030

Chart on Electromagnetic - Market size and forecast 2025-2030 ($ million)
Data Table on Electromagnetic - Market size and forecast 2025-2030 ($ million)
Chart on Electromagnetic - Year-over-year growth 2025-2030 (%)
Data Table on Electromagnetic - Year-over-year growth 2025-2030 (%)

9.5 Market opportunity by Type

Market opportunity by Type ($ million)
Data Table on Market opportunity by Type ($ million)

10. Market Segmentation by Product Type

10.1 Market segments

Chart on Product Type - Market share 2025-2030 (%)
Data Table on Product Type - Market share 2025-2030 (%)

10.2 Comparison by Product Type

Chart on Comparison by Product Type
Data Table on Comparison by Product Type

10.3 Light or medium duty - Market size and forecast 2025-2030

Chart on Light or medium duty - Market size and forecast 2025-2030 ($ million)
Data Table on Light or medium duty - Market size and forecast 2025-2030 ($ million)
Chart on Light or medium duty - Year-over-year growth 2025-2030 (%)
Data Table on Light or medium duty - Year-over-year growth 2025-2030 (%)

10.4 Heavy duty - Market size and forecast 2025-2030

Chart on Heavy duty - Market size and forecast 2025-2030 ($ million)
Data Table on Heavy duty - Market size and forecast 2025-2030 ($ million)
Chart on Heavy duty - Year-over-year growth 2025-2030 (%)
Data Table on Heavy duty - Year-over-year growth 2025-2030 (%)

10.5 Market opportunity by Product Type

Market opportunity by Product Type ($ million)
Data Table on Market opportunity by Product Type ($ million)

11. Customer Landscape

11.1 Customer landscape overview

Analysis of price sensitivity, lifecycle, customer purchase basket, adoption rates, and purchase criteria

12. Geographic Landscape

12.1 Geographic segmentation

Chart on Market share by geography 2025-2030 (%)
Data Table on Market share by geography 2025-2030 (%)

12.2 Geographic comparison

Chart on Geographic comparison
Data Table on Geographic comparison

12.3 APAC - Market size and forecast 2025-2030

Chart on APAC - Market size and forecast 2025-2030 ($ million)
Data Table on APAC - Market size and forecast 2025-2030 ($ million)
Chart on APAC - Year-over-year growth 2025-2030 (%)
Data Table on APAC - Year-over-year growth 2025-2030 (%)
Chart on Regional Comparison - APAC
Data Table on Regional Comparison - APAC

12.3.1 China - Market size and forecast 2025-2030

Chart on China - Market size and forecast 2025-2030 ($ million)
Data Table on China - Market size and forecast 2025-2030 ($ million)
Chart on China - Year-over-year growth 2025-2030 (%)
Data Table on China - Year-over-year growth 2025-2030 (%)

12.3.2 India - Market size and forecast 2025-2030

Chart on India - Market size and forecast 2025-2030 ($ million)
Data Table on India - Market size and forecast 2025-2030 ($ million)
Chart on India - Year-over-year growth 2025-2030 (%)
Data Table on India - Year-over-year growth 2025-2030 (%)

12.3.3 Japan - Market size and forecast 2025-2030

Chart on Japan - Market size and forecast 2025-2030 ($ million)
Data Table on Japan - Market size and forecast 2025-2030 ($ million)
Chart on Japan - Year-over-year growth 2025-2030 (%)
Data Table on Japan - Year-over-year growth 2025-2030 (%)

12.3.4 South Korea - Market size and forecast 2025-2030

Chart on South Korea - Market size and forecast 2025-2030 ($ million)
Data Table on South Korea - Market size and forecast 2025-2030 ($ million)
Chart on South Korea - Year-over-year growth 2025-2030 (%)
Data Table on South Korea - Year-over-year growth 2025-2030 (%)

12.3.5 Australia - Market size and forecast 2025-2030

Chart on Australia - Market size and forecast 2025-2030 ($ million)
Data Table on Australia - Market size and forecast 2025-2030 ($ million)
Chart on Australia - Year-over-year growth 2025-2030 (%)
Data Table on Australia - Year-over-year growth 2025-2030 (%)

12.3.6 Indonesia - Market size and forecast 2025-2030

Chart on Indonesia - Market size and forecast 2025-2030 ($ million)
Data Table on Indonesia - Market size and forecast 2025-2030 ($ million)
Chart on Indonesia - Year-over-year growth 2025-2030 (%)
Data Table on Indonesia - Year-over-year growth 2025-2030 (%)

12.4 Europe - Market size and forecast 2025-2030

Chart on Europe - Market size and forecast 2025-2030 ($ million)
Data Table on Europe - Market size and forecast 2025-2030 ($ million)
Chart on Europe - Year-over-year growth 2025-2030 (%)
Data Table on Europe - Year-over-year growth 2025-2030 (%)
Chart on Regional Comparison - Europe
Data Table on Regional Comparison - Europe

12.4.1 Germany - Market size and forecast 2025-2030

Chart on Germany - Market size and forecast 2025-2030 ($ million)
Data Table on Germany - Market size and forecast 2025-2030 ($ million)
Chart on Germany - Year-over-year growth 2025-2030 (%)
Data Table on Germany - Year-over-year growth 2025-2030 (%)

12.4.2 UK - Market size and forecast 2025-2030

Chart on UK - Market size and forecast 2025-2030 ($ million)
Data Table on UK - Market size and forecast 2025-2030 ($ million)
Chart on UK - Year-over-year growth 2025-2030 (%)
Data Table on UK - Year-over-year growth 2025-2030 (%)

12.4.3 France - Market size and forecast 2025-2030

Chart on France - Market size and forecast 2025-2030 ($ million)
Data Table on France - Market size and forecast 2025-2030 ($ million)
Chart on France - Year-over-year growth 2025-2030 (%)
Data Table on France - Year-over-year growth 2025-2030 (%)

12.4.4 Italy - Market size and forecast 2025-2030

Chart on Italy - Market size and forecast 2025-2030 ($ million)
Data Table on Italy - Market size and forecast 2025-2030 ($ million)
Chart on Italy - Year-over-year growth 2025-2030 (%)
Data Table on Italy - Year-over-year growth 2025-2030 (%)

12.4.5 Spain - Market size and forecast 2025-2030

Chart on Spain - Market size and forecast 2025-2030 ($ million)
Data Table on Spain - Market size and forecast 2025-2030 ($ million)
Chart on Spain - Year-over-year growth 2025-2030 (%)
Data Table on Spain - Year-over-year growth 2025-2030 (%)

12.4.6 The Netherlands - Market size and forecast 2025-2030

Chart on The Netherlands - Market size and forecast 2025-2030 ($ million)
Data Table on The Netherlands - Market size and forecast 2025-2030 ($ million)
Chart on The Netherlands - Year-over-year growth 2025-2030 (%)
Data Table on The Netherlands - Year-over-year growth 2025-2030 (%)

12.5 North America - Market size and forecast 2025-2030

Chart on North America - Market size and forecast 2025-2030 ($ million)
Data Table on North America - Market size and forecast 2025-2030 ($ million)
Chart on North America - Year-over-year growth 2025-2030 (%)
Data Table on North America - Year-over-year growth 2025-2030 (%)
Chart on Regional Comparison - North America
Data Table on Regional Comparison - North America

12.5.1 US - Market size and forecast 2025-2030

Chart on US - Market size and forecast 2025-2030 ($ million)
Data Table on US - Market size and forecast 2025-2030 ($ million)
Chart on US - Year-over-year growth 2025-2030 (%)
Data Table on US - Year-over-year growth 2025-2030 (%)

12.5.2 Canada - Market size and forecast 2025-2030

Chart on Canada - Market size and forecast 2025-2030 ($ million)
Data Table on Canada - Market size and forecast 2025-2030 ($ million)
Chart on Canada - Year-over-year growth 2025-2030 (%)
Data Table on Canada - Year-over-year growth 2025-2030 (%)

12.5.3 Mexico - Market size and forecast 2025-2030

Chart on Mexico - Market size and forecast 2025-2030 ($ million)
Data Table on Mexico - Market size and forecast 2025-2030 ($ million)
Chart on Mexico - Year-over-year growth 2025-2030 (%)
Data Table on Mexico - Year-over-year growth 2025-2030 (%)

12.6 South America - Market size and forecast 2025-2030

Chart on South America - Market size and forecast 2025-2030 ($ million)
Data Table on South America - Market size and forecast 2025-2030 ($ million)
Chart on South America - Year-over-year growth 2025-2030 (%)
Data Table on South America - Year-over-year growth 2025-2030 (%)
Chart on Regional Comparison - South America
Data Table on Regional Comparison - South America

12.6.1 Brazil - Market size and forecast 2025-2030

Chart on Brazil - Market size and forecast 2025-2030 ($ million)
Data Table on Brazil - Market size and forecast 2025-2030 ($ million)
Chart on Brazil - Year-over-year growth 2025-2030 (%)
Data Table on Brazil - Year-over-year growth 2025-2030 (%)

12.6.2 Argentina - Market size and forecast 2025-2030

Chart on Argentina - Market size and forecast 2025-2030 ($ million)
Data Table on Argentina - Market size and forecast 2025-2030 ($ million)
Chart on Argentina - Year-over-year growth 2025-2030 (%)
Data Table on Argentina - Year-over-year growth 2025-2030 (%)

12.6.3 Chile - Market size and forecast 2025-2030

Chart on Chile - Market size and forecast 2025-2030 ($ million)
Data Table on Chile - Market size and forecast 2025-2030 ($ million)
Chart on Chile - Year-over-year growth 2025-2030 (%)
Data Table on Chile - Year-over-year growth 2025-2030 (%)

12.7 Middle East and Africa - Market size and forecast 2025-2030

Chart on Middle East and Africa - Market size and forecast 2025-2030 ($ million)
Data Table on Middle East and Africa - Market size and forecast 2025-2030 ($ million)
Chart on Middle East and Africa - Year-over-year growth 2025-2030 (%)
Data Table on Middle East and Africa - Year-over-year growth 2025-2030 (%)
Chart on Regional Comparison - Middle East and Africa
Data Table on Regional Comparison - Middle East and Africa

12.7.1 Saudi Arabia - Market size and forecast 2025-2030

Chart on Saudi Arabia - Market size and forecast 2025-2030 ($ million)
Data Table on Saudi Arabia - Market size and forecast 2025-2030 ($ million)
Chart on Saudi Arabia - Year-over-year growth 2025-2030 (%)
Data Table on Saudi Arabia - Year-over-year growth 2025-2030 (%)

12.7.2 South Africa - Market size and forecast 2025-2030

Chart on South Africa - Market size and forecast 2025-2030 ($ million)
Data Table on South Africa - Market size and forecast 2025-2030 ($ million)
Chart on South Africa - Year-over-year growth 2025-2030 (%)
Data Table on South Africa - Year-over-year growth 2025-2030 (%)

12.7.3 UAE - Market size and forecast 2025-2030

Chart on UAE - Market size and forecast 2025-2030 ($ million)
Data Table on UAE - Market size and forecast 2025-2030 ($ million)
Chart on UAE - Year-over-year growth 2025-2030 (%)
Data Table on UAE - Year-over-year growth 2025-2030 (%)

12.7.4 Turkey - Market size and forecast 2025-2030

Chart on Turkey - Market size and forecast 2025-2030 ($ million)
Data Table on Turkey - Market size and forecast 2025-2030 ($ million)
Chart on Turkey - Year-over-year growth 2025-2030 (%)
Data Table on Turkey - Year-over-year growth 2025-2030 (%)

12.7.5 Egypt - Market size and forecast 2025-2030

Chart on Egypt - Market size and forecast 2025-2030 ($ million)
Data Table on Egypt - Market size and forecast 2025-2030 ($ million)
Chart on Egypt - Year-over-year growth 2025-2030 (%)
Data Table on Egypt - Year-over-year growth 2025-2030 (%)

12.8 Market opportunity by geography

Market opportunity by geography ($ million)
Data Tables on Market opportunity by geography ($ million)

13. Drivers, Challenges, and Opportunity

13.1 Market drivers

Acceleration of sanitary automation in food and pharmaceutical sectors
Imperative for energy efficiency and sustainability in mineral processing
Expansion of circular economy and recycling infrastructure

13.2 Market challenges

Stringent environmental and safety regulations
High capital costs and interest rate sensitivity
Supply chain volatility of raw material instability and trade protectionism

13.3 Impact of drivers and challenges

Impact of drivers and challenges in 2025 and 2030

13.4 Market opportunities

Integration of digital intelligence and predictive maintenance
Convergence of hygienic design and high-capacity automation
Shift toward mobile and modular recycling solutions

14. Competitive Landscape

14.1 Overview

14.2

Overview on criticality of inputs and factors of differentiation

14.3 Landscape disruption

Overview on factors of disruption

14.4 Industry risks

Impact of key risks on business

15. Competitive Analysis

15.1 Companies profiled

Companies covered

15.2 Company ranking index

15.3 Market positioning of companies

Matrix on companies position and classification

15.4 AViTEQ Vibrationstechnik GmbH

AViTEQ Vibrationstechnik GmbH - Overview
AViTEQ Vibrationstechnik GmbH - Product / Service
AViTEQ Vibrationstechnik GmbH - Key offerings
SWOT

15.5 Bruks Siwertell Group

Bruks Siwertell Group - Overview
Bruks Siwertell Group - Product / Service
Bruks Siwertell Group - Key offerings
SWOT

15.6 Carrier Vibrating Equipment Inc.

Carrier Vibrating Equipment Inc. - Overview
Carrier Vibrating Equipment Inc. - Product / Service
Carrier Vibrating Equipment Inc. - Key offerings
SWOT

15.7 Duravant LLC

Duravant LLC - Overview
Duravant LLC - Product / Service
Duravant LLC - Key news
Duravant LLC - Key offerings
SWOT

15.8 GEA Group AG

GEA Group AG - Overview
GEA Group AG - Business segments
GEA Group AG - Key offerings
GEA Group AG - Segment focus
SWOT

15.9 General Kinematics Corp.

General Kinematics Corp. - Overview
General Kinematics Corp. - Product / Service
General Kinematics Corp. - Key offerings
SWOT

15.10 JOST GmbH Co. KG

JOST GmbH Co. KG - Overview
JOST GmbH Co. KG - Product / Service
JOST GmbH Co. KG - Key offerings
SWOT

15.11 Kadant Inc.

Kadant Inc. - Overview
Kadant Inc. - Business segments
Kadant Inc. - Key offerings
Kadant Inc. - Segment focus
SWOT

15.12 Kinergy Corp.

Kinergy Corp. - Overview
Kinergy Corp. - Product / Service
Kinergy Corp. - Key offerings
SWOT

15.13 N.M. Heilig B.V.

N.M. Heilig B.V. - Overview
N.M. Heilig B.V. - Product / Service
N.M. Heilig B.V. - Key offerings
SWOT

15.14 RHEWUM GmbH

RHEWUM GmbH - Overview
RHEWUM GmbH - Product / Service
RHEWUM GmbH - Key offerings
SWOT

15.15 Schenck Process Holding GmbH

Schenck Process Holding GmbH - Overview
Schenck Process Holding GmbH - Product / Service
Schenck Process Holding GmbH - Key offerings
SWOT

15.16 Smalley Manufacturing Co.

Smalley Manufacturing Co. - Overview
Smalley Manufacturing Co. - Product / Service
Smalley Manufacturing Co. - Key offerings
SWOT

15.17 Tarnos SA

Tarnos SA - Overview
Tarnos SA - Product / Service
Tarnos SA - Key offerings
SWOT

15.18 Vibra Screw Inc.

Vibra Screw Inc. - Overview
Vibra Screw Inc. - Product / Service
Vibra Screw Inc. - Key offerings
SWOT

16. Appendix

16.1 Scope of the report

Market definition
Objectives
Notes and caveats

16.2 Inclusions and exclusions checklist

Inclusions checklist
Exclusions checklist

16.3 Currency conversion rates for US$

16.4 Research methodology

16.5 Data procurement

Information sources

16.6 Data validation

16.7 Validation techniques employed for market sizing

16.8 Data synthesis

16.9 360 degree market analysis

16.10 List of abbreviations

Research Methodology

Technavio presents a detailed picture of the market by way of study, synthesis, and summation of data from multiple sources. The analysts have presented the various facets of the market with a particular focus on identifying the key industry influencers. The data thus presented is comprehensive, reliable, and the result of extensive research, both primary and secondary.

INFORMATION SOURCES

Primary sources

  • Manufacturers and suppliers
  • Channel partners
  • Industry experts
  • Strategic decision makers

Secondary sources

  • Industry journals and periodicals
  • Government data
  • Financial reports of key industry players
  • Historical data
  • Press releases

DATA ANALYSIS

Data Synthesis

  • Collation of data
  • Estimation of key figures
  • Analysis of derived insights

Data Validation

  • Triangulation with data models
  • Reference against proprietary databases
  • Corroboration with industry experts

REPORT WRITING

Qualitative

  • Market drivers
  • Market challenges
  • Market trends
  • Five forces analysis

Quantitative

  • Market size and forecast
  • Market segmentation
  • Geographical insights
  • Competitive landscape

Interested in this report?

Get your sample now to see our research methodology and insights!

Download Now

Frequently Asked Questions

Vibrating Conveyors market growth will increase by USD 154.6 million during 2026-2030.

The Vibrating Conveyors market is expected to grow at a CAGR of 2.1% during 2026-2030.

Vibrating Conveyors market is segmented by End-user (Pharmaceuticals, Mineral processing, Chemical, Food and beverage, Others) Type (Mechanical, Electromagnetic) Product type (Light or medium duty, Heavy duty)

AViTEQ Vibrationstechnik GmbH, Bruks Siwertell Group, Carrier Vibrating Equipment Inc., Duravant LLC, GEA Group AG, General Kinematics Corp., JOST GmbH Co. KG, Kadant Inc., Kinergy Corp., N.M. Heilig B.V., RHEWUM GmbH, ROLLIVIBRA S.L., Schenck Process Holding GmbH, SINFONIA TECHNOLOGY Co. Ltd., Smalley Manufacturing Co., Tarnos SA, Vibra Screw Inc., Webster Industries Inc. are a few of the key vendors in the Vibrating Conveyors market.

APAC will register the highest growth rate of 36% among the other regions. Therefore, the Vibrating Conveyors market in APAC is expected to garner significant business opportunities for the vendors during the forecast period.

China, India, Japan, South Korea, Australia, Indonesia, Germany, UK, France, Italy, Spain, The Netherlands, US, Canada, Mexico, Brazil, Argentina, Chile, Saudi Arabia, South Africa, UAE, Turkey, Egypt

  • Acceleration of sanitary automation in food and pharmaceutical sectors is the driving factor this market.

The Vibrating Conveyors market vendors should focus on grabbing business opportunities from the End-user segment as it accounted for the largest market share in the base year.