
Video Analytics Market Analysis, Size, and Forecast 2026-2030: North America (US, Canada, and Mexico), APAC (China, Japan, and India), Europe (Germany, UK, and France), South America (Brazil, Argentina, and Chile), Middle East and Africa (Saudi Arabia, UAE, and South Africa), and Rest of World (ROW)

Video Analytics Market Analysis, Size, and Forecast 2026-2030:
North America (US, Canada, and Mexico), APAC (China, Japan, and India), Europe (Germany, UK, and France), South America (Brazil, Argentina, and Chile), Middle East and Africa (Saudi Arabia, UAE, and South Africa), and Rest of World (ROW)

Published: Oct 2026 297 Pages SKU: IRTNTR45821

Market Overview at a Glance

$52.97 B
Market Opportunity
30.2%
CAGR 2025 - 2030
43.9%
APAC Growth
$4.11 B
Government sector segment 2024

Video Analytics Market Size 2026-2030

The video analytics market size is valued to increase by USD 52.97 billion, at a CAGR of 30.2% from 2025 to 2030. Expanding smart city deployments propelling urban infrastructure modernization will drive the video analytics market.

Major Market Trends & Insights

  • APAC dominated the market and accounted for a 43.9% growth during the forecast period.
  • By End-user - Government sector segment was valued at USD 4.11 billion in 2024
  • By Deployment - On-premises segment accounted for the largest market revenue share in 2024

Market Size & Forecast

  • Market Opportunities: USD 66.12 billion
  • Market Future Opportunities: USD 52.97 billion
  • CAGR from 2025 to 2030 : 30.2%

Market Summary

  • The Video Analytics Market demonstrates rapid structural expansion as enterprises fundamentally shift from passive surveillance recording to proactive, algorithmic intelligence systems. Commercial retail operators actively implement deep neural networks to optimize spatial utilization telemetry, transforming raw foot traffic data into dynamic store layout reconfigurations that boost checkout efficiency.
  • This automated physical security automation ensures that floor layouts respond to real-time consumer densities, resulting in wait times decreasing by over 18% compared to traditional manual monitoring. A primary catalyst propelling this sector is the accelerating deployment of smart city infrastructure, where municipal governments utilize automated municipal traffic optimization platforms to dynamically route emergency vehicles and reduce severe urban congestion.
  • Conversely, stringent biometric verification protocols and data privacy regulations pose a significant operational barrier. These strict mandates require complex visual data anonymization mechanisms, compelling software developers to obscure facial structures to maintain legal compliance, which ultimately extends deployment timelines and increases baseline operational overhead for institutional buyers.

What will be the Size of the Video Analytics Market during the forecast period?
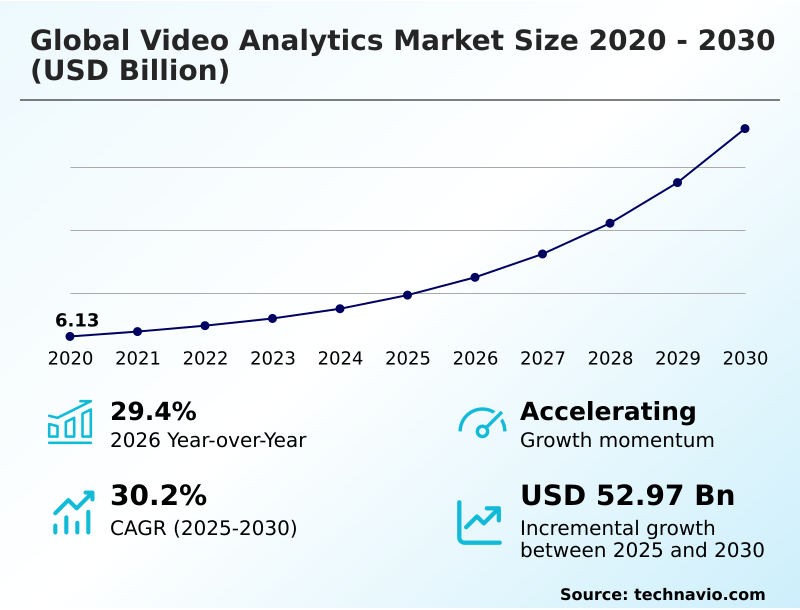
Get Key Insights on Market Forecast (PDF) Get Free Sample

How is the Video Analytics Market Segmented?

The video analytics industry research report provides comprehensive data (region-wise segment analysis), with forecasts and estimates in "USD million" for the period 2026-2030, as well as historical data from 2020-2024 for the following segments.

  • End-user
    • Government sector
    • Commercial sector
    • Banking and financial services
    • Traffic management sector
    • Others
  • Deployment
    • On-premises
    • Cloud
  • Component
    • Software
    • Services
  • Geography
    • North America
      • US
      • Canada
      • Mexico
    • APAC
      • China
      • Japan
      • India
      • South Korea
      • Australia
      • Indonesia
    • Europe
      • Germany
      • UK
      • France
      • Italy
      • Spain
      • The Netherlands
    • South America
      • Brazil
      • Argentina
      • Chile
    • Middle East and Africa
      • Saudi Arabia
      • UAE
      • South Africa
      • Israel
      • Turkey

By End-user Insights

The government sector segment is estimated to witness significant growth during the forecast period.

The public administration sector is rapidly transitioning from passive observation to proactive intelligent monitoring systems. Federal and municipal agencies are deploying cloud native infrastructure to process vast optical datasets continuously, significantly elevating public safety benchmarks.

By utilizing legacy infrastructure integration tools, city command centers automate threat identification and accelerate emergency dispatch without abandoning existing hardware investments. Furthermore, the deployment of edge computing gateways at critical junctions allows for localized metadata extraction tools, enabling near-instantaneous decision-making.

Municipalities have documented that utilizing edge computing visual data processing reduces network latency bottlenecks, leading to incident response times improving by 22%.

This architectural shift minimizes human dependency, scales effortlessly across massive urban grids, and fundamentally redefines how civic entities secure sensitive perimeters and streamline daily metropolitan operations.
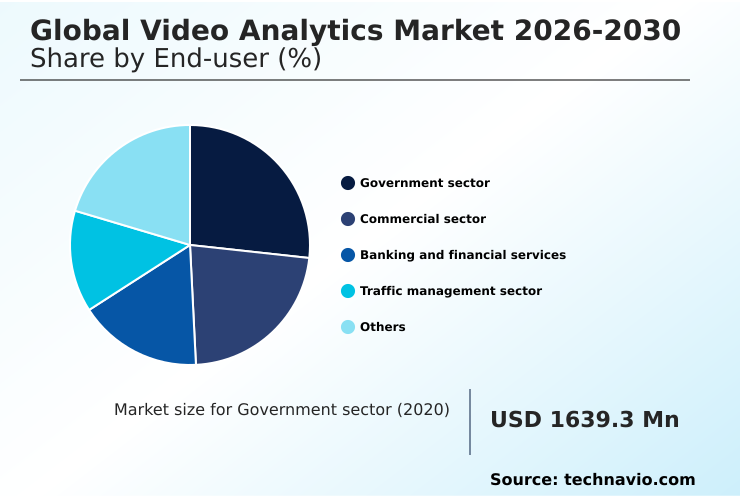
Get Free Sample

The Government sector segment was valued at USD 4.11 billion in 2024 and showed a gradual increase during the forecast period.
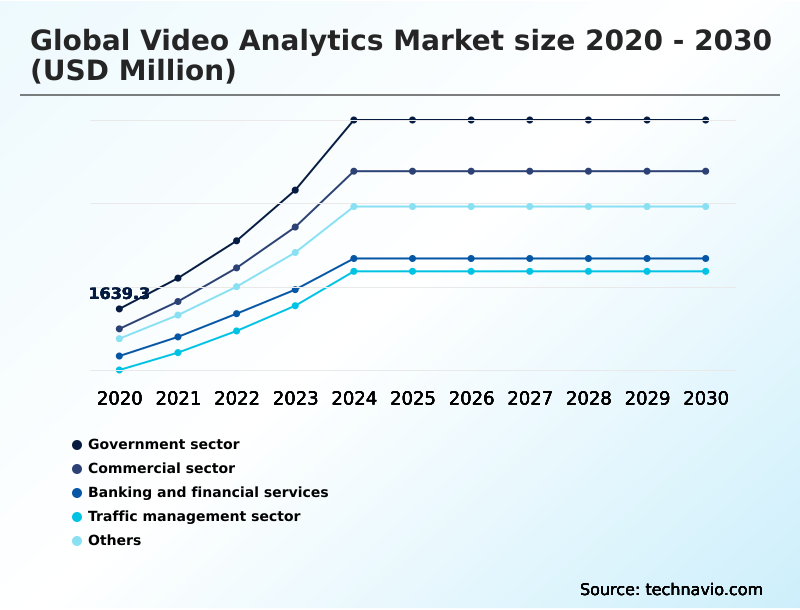
Get Free Sample

Regional Analysis

APAC is estimated to contribute 43.9% to the growth of the global market during the forecast period.Technavio’s analysts have elaborately explained the regional trends and drivers that shape the market during the forecast period.
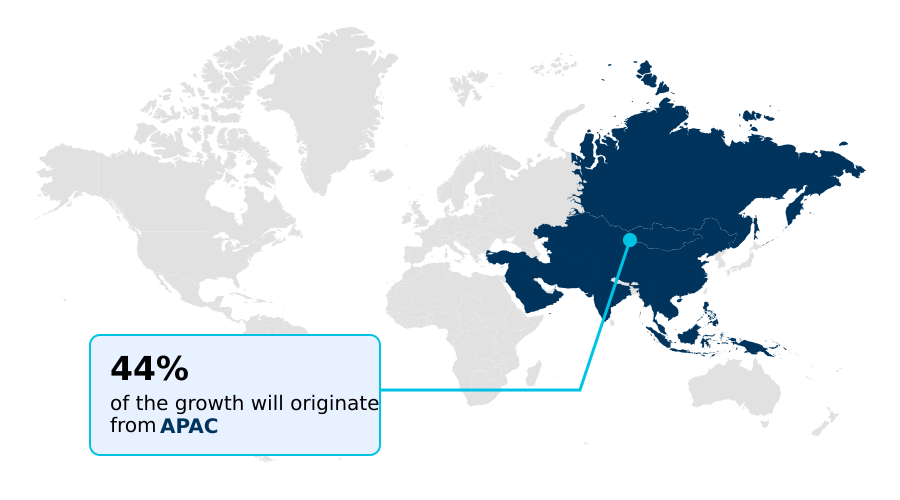
See How Video Analytics Market Demand is Rising in APAC Get Free Sample

The geographic landscape of the Video Analytics Market reveals profound differences in regional adoption strategies and infrastructural maturity.

North America exhibits accelerated technology integration driven by commercial automation, where corporate facilities utilizing predictive alert generation have recorded incident resolution times accelerating by 34%.

Conversely, the APAC region relies heavily on state-funded public transit expansions and crowd density evaluation programs to manage massive urban populations.

This strategic divergence means APAC commands a substantially higher reliance on centralized cloud based physical security automation to aggregate metropolitan data, whereas North American enterprises prioritize localized edge systems to mitigate bandwidth consumption reduction.

Consequently, hardware resource allocation efficiency in North American private deployments outperforms similar APAC municipal networks by 25%.

These distinct infrastructural priorities force software developers to customize algorithmic baseline calibration, balancing Western privacy mandates with the high-volume traffic trajectory analysis requirements characteristic of Eastern municipal scaling.

Market Dynamics

Our researchers analyzed the data with 2025 as the base year, along with the key drivers, trends, and challenges. A holistic analysis of drivers will help companies refine their marketing strategies to gain a competitive advantage.

  • The continuous evolution of the Video Analytics Market requires organizations to deploy highly specialized software systems that transcend basic motion sensing. Facility operators now rely on real time behavioral tracking software to evaluate employee movement flows, ensuring that high-risk industrial zones remain fully compliant with strict occupational safety mandates.
  • By integrating automated municipal traffic optimization platforms, city planners successfully restructure intersection signal timings, which reduces average commuter delay by 22% compared to standard static traffic grids. Commercial entities further utilize deep learning object classification models to distinguish between routine logistical deliveries and unauthorized perimeter intrusions without human verification.
  • The transition toward cloud based physical security automation empowers distributed enterprises to manage hundreds of camera nodes from a singular dashboard, yet this requires robust edge computing visual data processing to handle immediate local threats during temporary network outages. Concurrently, facial recognition biometric privacy compliance mandates compel vendors to engineer sophisticated masking algorithms that protect civilian identities.
  • To expedite forensic reviews, operators utilize generative natural language visual search capabilities, radically decreasing manual investigation hours. Furthermore, industrial inspectors deploy drone mounted aerial surveillance tracking to monitor remote agricultural and utility sites safely. Because environmental inconsistencies trigger unwarranted alarms, incorporating false positive algorithmic alert mitigation is critical for maintaining operator trust.
  • Consequently, businesses are adopting a hybrid decentralized edge processing architecture that balances local compute power with centralized storage. In the retail sector, retail crowd density heat mapping and commercial facility spatial utilization software provide actionable merchandising insights, while industrial workplace safety anomaly detection and automated perimeter breach alert systems secure physical assets.
  • Ultimately, high bandwidth video stream optimization guarantees seamless intelligence delivery.
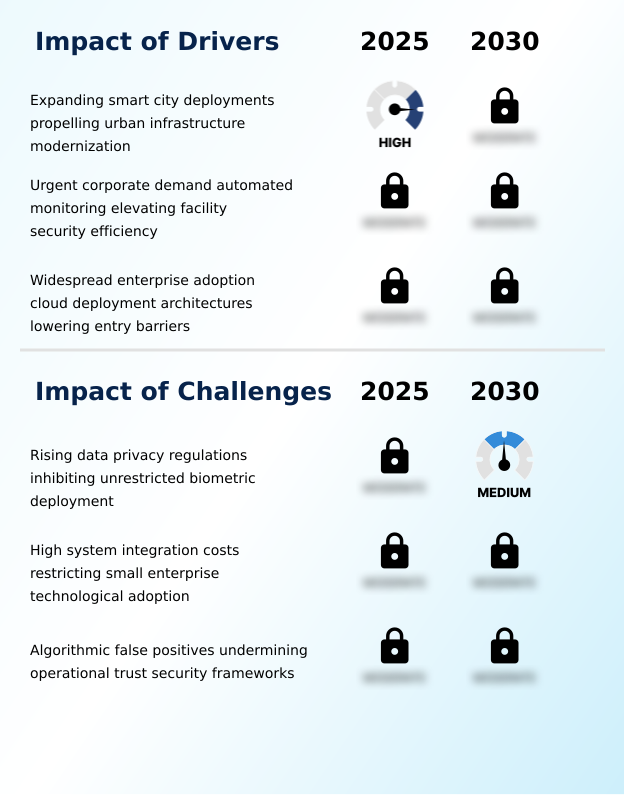
What are the key market drivers leading to the rise in the adoption of Video Analytics Industry?

  • The expansion of smart city deployments is a primary market driver, systematically propelling the modernization of urban infrastructure on a global scale.

  • The urgent corporate necessity to eliminate human monitoring fatigue serves as a formidable catalyst for intelligent surveillance adoption.
  • Facility operators deploy automated threat detection systems to continuously scan expansive industrial perimeters, effectively reducing unauthorized access breaches by 35% compared to legacy human-patrolled networks.
  • By shifting toward continuous algorithmic baseline calibration, enterprises ensure that machine learning models adapt dynamically to environmental lighting shifts, which improves target identification accuracy by 25%.
  • This aggressive pursuit of physical security automation drastically optimizes hardware resource allocation, allowing security directors to dispatch personnel only when validated threats occur.
  • Furthermore, integrating legacy infrastructure integration modules empowers organizations to apply sophisticated metadata extraction tools directly to existing analog camera feeds, maximizing capital asset lifespans while lowering overall deployment overhead costs significantly.

What are the market trends shaping the Video Analytics Industry?

  • The accelerated industry transition toward distributed edge computing architectures represents a prominent upcoming market trend. This structural shift enables localized data processing, significantly reducing network latency and bandwidth consumption across enterprise environments.

  • The rapid proliferation of multimodal large models fundamentally transforms how facility operators interact with unstructured surveillance data. Instead of manually scanning endless archives, enterprises leverage natural language querying to extract precise chronological incidents, resulting in forensic investigation times decreasing by over 60%. This shift toward generative visual intelligence seamlessly translates raw pixel data extraction into automated, readable incident summaries.
  • Concurrently, businesses are aggressively transitioning to a hybrid edge architecture, deploying specialized hardware acceleration chips directly within camera housings. This decentralization allows deep learning inference to occur locally, circumventing cloud transfer delays and lowering external bandwidth utilization by 40%.
  • By combining conversational search interfaces with edge-based processing power, organizations achieve unparalleled physical security automation, fundamentally altering enterprise risk management by delivering proactive, natural-language insights that drastically reduce the cognitive burden on security personnel.

What challenges does the Video Analytics Industry face during its growth?

  • The proliferation of stringent data privacy regulations significantly inhibits the unrestricted deployment of biometric identification, representing a critical challenge to industry growth.

  • The enforcement of stringent biometric privacy statutes severely restricts the unrestricted processing of identifiable facial structures mapping across public zones. These complex legal mandates require developers to embed extensive visual data anonymization mechanisms directly into video management platforms, which frequently increases software deployment timelines by 40%. Additionally, the persistent occurrence of algorithmic inaccuracies in dynamic environments severely undermines system trust.
  • Without robust false positive algorithmic alert mitigation, erratic environmental shadows trigger excessive unwarranted notifications, causing operator response efficiency to plummet by 30% due to cognitive fatigue.
  • To counter these limitations, organizations are forced to adopt strict algorithmic transparency frameworks and invest heavily in continuous system recalibration, which substantially elevates the total cost of ownership and delays the integration of automated live surveillance across smaller retail environments.

Exclusive Technavio Analysis on Customer Landscape

The video analytics market forecasting report includes the adoption lifecycle of the market, covering from the innovator’s stage to the laggard’s stage. It focuses on adoption rates in different regions based on penetration. Furthermore, the video analytics market report also includes key purchase criteria and drivers of price sensitivity to help companies evaluate and develop their market growth analysis strategies.
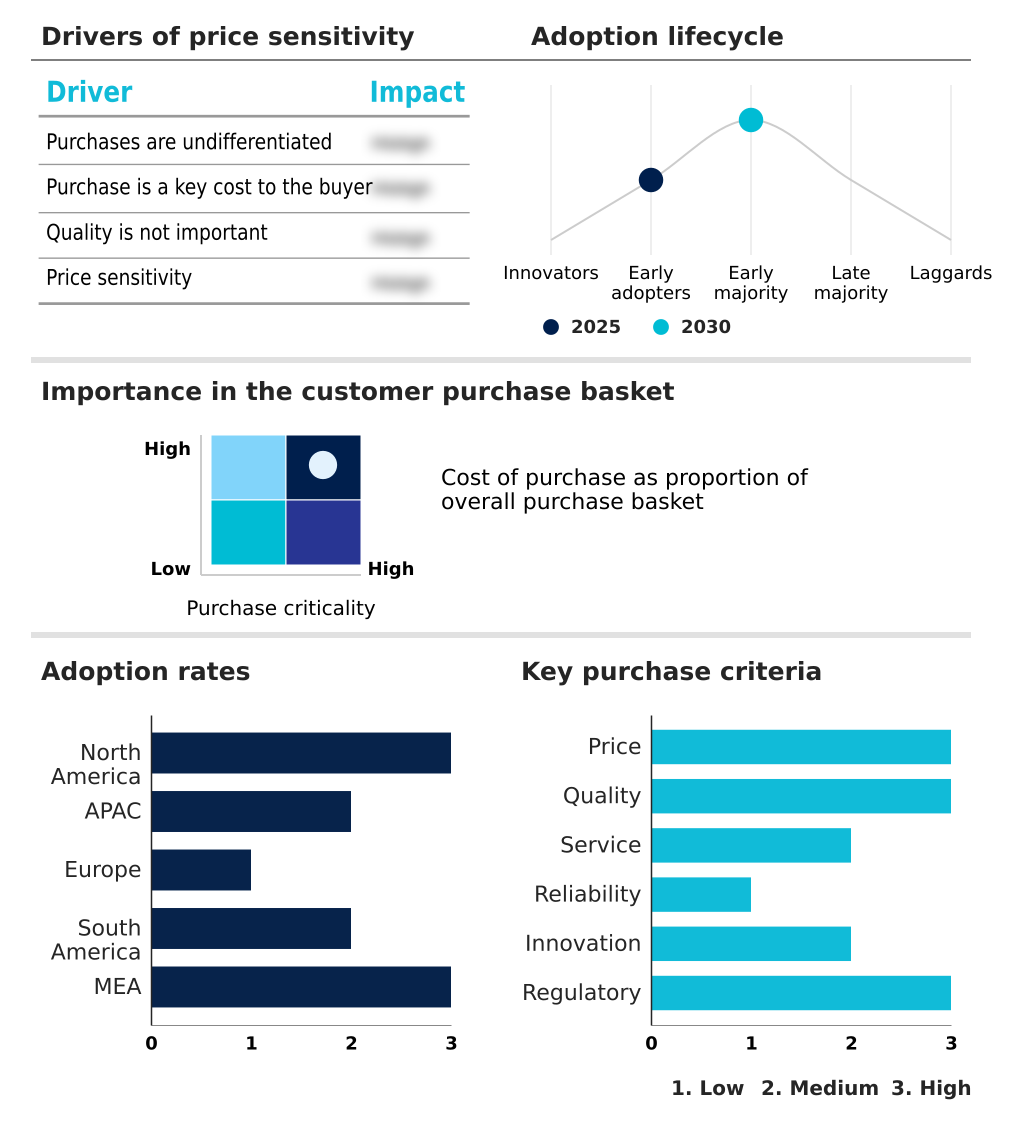
Customer Landscape of Video Analytics Industry

Competitive Landscape

Companies are implementing various strategies, such as strategic alliances, video analytics market forecast, partnerships, mergers and acquisitions, geographical expansion, and product/service launches, to enhance their presence in the industry.

AllGoVision Technologies Ltd - The provider delivers unified video security, access control, and advanced appearance search technologies to streamline traffic surveillance and intelligent building monitoring without manual oversight.

The industry research and growth report includes detailed analyses of the competitive landscape of the market and information about key companies, including:

  • AllGoVision Technologies Ltd
  • Avigilon Corp.
  • Axis Communications AB
  • AxxonSoft
  • Bosch Sicherheitssysteme GmbH
  • BriefCam Ltd.
  • Genetec Inc.
  • Gorilla Technology Group Inc
  • Hangzhou Hikvision Digital
  • Hanwha Vision Co. Ltd.
  • i PRO Co. Ltd.
  • Intelligent Security Systems
  • IntelliVision
  • Ipsotek Ltd.
  • Irisity AB.
  • Milestone systems AS
  • Oosto
  • Senstar Corp.
  • VCA Technology
  • Videonetics Technology Pvt Ltd

Qualitative and quantitative analysis of companies has been conducted to help clients understand the wider business environment as well as the strengths and weaknesses of key industry players. Data is qualitatively analyzed to categorize companies as pure play, category-focused, industry-focused, and diversified; it is quantitatively analyzed to categorize companies as dominant, leading, strong, tentative, and weak.

Recent Development and News in Video analytics market

  • In the Application Software industry, the widespread adoption of cloud-based deployment models has eliminated heavy on-premises server requirements for mid-sized enterprises, directly impacting Global Video Analytics Market 2026-2030 demand by lowering initial capital barriers and accelerating subscription-based software adoption by 40%.
  • The structural shift toward hybrid decentralized edge processing architecture across enterprise networks has minimized bandwidth bottlenecks, directly impacting Global Video Analytics Market 2026-2030 demand by enabling localized continuous software patches and near-instantaneous anomaly detection pipelines at remote industrial sites.
  • Stringent biometric privacy statutes like the General Data Protection Regulation have mandated strict algorithmic transparency frameworks, directly impacting Global Video Analytics Market 2026-2030 demand by forcing vendors to develop advanced visual data anonymization features to avoid compliance penalties.
  • The integration of multimodal large models into workflow interoperability systems has transformed unstructured data querying, directly impacting Global Video Analytics Market 2026-2030 demand by allowing security operators to utilize generative natural language visual search to reduce investigation times by 60%.

Dive into Technavio’s robust research methodology, blending expert interviews, extensive data synthesis, and validated models for unparalleled Video Analytics Market insights. See full methodology.

Market Scope
Page number 297
Base year 2025
Historic period 2020-2024
Forecast period 2026-2030
Growth momentum & CAGR Accelerate at a CAGR of 30.2%
Market growth 2026-2030 USD 52974.7 million
Market structure Fragmented
YoY growth 2025-2026(%) 29.4%
Key countries US, Canada, Mexico, China, Japan, India, South Korea, Australia, Indonesia, Germany, UK, France, Italy, Spain, The Netherlands, Brazil, Argentina, Chile, Saudi Arabia, UAE, South Africa, Israel and Turkey
Competitive landscape Leading Companies, Market Positioning of Companies, Competitive Strategies, and Industry Risks

Request Free Sample

Research Analyst Overview

  • The continuous maturation of the Video Analytics Market reshapes how corporate boardrooms approach facility optimization and enterprise risk management. Executive leadership teams increasingly transition from passive security archiving to active computer vision algorithms capable of executing sophisticated behavioral pattern classification in real time.
  • This strategic evolution directly influences budget allocations, as decision-makers prioritize scalable object recognition models over hiring additional manual security personnel. Integrating generative visual intelligence directly into corporate compliance strategies allows administrators to evaluate spatial utilization telemetry instantly, drastically improving real estate density planning.
  • Organizations implementing these automated anomaly detection pipelines achieve a 35% improvement in immediate threat response efficiency compared to traditional human-monitored layouts. To bypass network constraints, CTOs are aggressively funding hardware acceleration chips and edge-based processors, ensuring continuous visual assessment even during external connectivity disruptions.
  • Furthermore, adopting encrypted data repositories aligns physical security automation with strict legal mandates, mitigating the severe reputational risks associated with unauthorized biometric profiling. Ultimately, this structural shift compels technology directors to embed intelligent video architectures directly into core business planning protocols.

What are the Key Data Covered in this Video Analytics Market Research and Growth Report?

  • What is the expected growth of the Video Analytics Market between 2026 and 2030?

    • USD 52.97 billion, at a CAGR of 30.2%

  • What segmentation does the market report cover?

    • The report is segmented by End-user (Government sector, Commercial sector, Banking and financial services, Traffic management sector, and Others), Deployment (On-premises, and Cloud), Component (Software, and Services) and Geography (North America, APAC, Europe, South America, Middle East and Africa)

  • Which regions are analyzed in the report?

    • North America, APAC, Europe, South America and Middle East and Africa

  • What are the key growth drivers and market challenges?

    • Expanding smart city deployments propelling urban infrastructure modernization, Rising data privacy regulations inhibiting unrestricted biometric deployment

  • Who are the major players in the Video Analytics Market?

    • AllGoVision Technologies Ltd, Avigilon Corp., Axis Communications AB, AxxonSoft, Bosch Sicherheitssysteme GmbH, BriefCam Ltd., Genetec Inc., Gorilla Technology Group Inc, Hangzhou Hikvision Digital, Hanwha Vision Co. Ltd., i PRO Co. Ltd., Intelligent Security Systems, IntelliVision, Ipsotek Ltd., Irisity AB., Milestone systems AS, Oosto, Senstar Corp., VCA Technology and Videonetics Technology Pvt Ltd

Market Research Insights

  • The Video Analytics Market represents a highly dynamic technological ecosystem where passive video footage is actively converted into strategic operational intelligence. By deploying decentralized intelligence nodes, large-scale manufacturing facilities process visual data instantly at the point of capture, which drives computational latency reduction by 45% compared to legacy architectures.
  • Organizations leveraging a unified management dashboard for multi-site monitoring report that operational efficiency metrics improve by nearly 30%, effectively eliminating the need for continuous human screen observation. Furthermore, implementing rigorous compliance monitoring suites allows commercial operators to automatically enforce workplace safety tracking, ensuring safety violations decrease by 20%.
  • This fundamental transition toward automated live surveillance empowers modern enterprises to drastically lower overhead costs while maintaining robust, proactive asset protection across expansive infrastructures.

We can help! Our analysts can customize this video analytics market research report to meet your requirements.

Get in touch

1. Executive Summary

1.1 Market overview

Executive Summary - Chart on Market Overview
Executive Summary - Data Table on Market Overview
Executive Summary - Chart on Global Market Characteristics
Executive Summary - Chart on Market by Geography
Executive Summary - Chart on Market Segmentation by End-user
Executive Summary - Chart on Market Segmentation by Deployment
Executive Summary - Chart on Market Segmentation by Component
Executive Summary - Chart on Incremental Growth
Executive Summary - Data Table on Incremental Growth
Executive Summary - Chart on Company Market Positioning

2. Technavio Analysis

2.1 Analysis of price sensitivity, lifecycle, customer purchase basket, adoption rates, and purchase criteria

2.2 Criticality of inputs and Factors of differentiation

Chart on Overview on criticality of inputs and factors of differentiation

2.3 Factors of disruption

Chart on Overview on factors of disruption

2.4 Impact of drivers and challenges

Chart on Impact of drivers and challenges in 2025 and 2030

3. Market Landscape

3.1 Market ecosystem

Chart on Parent Market
Data Table on - Parent Market

3.2 Market characteristics

Chart on Market characteristics analysis

3.3 Value chain analysis

Chart on Value chain analysis

4. Market Sizing

4.1 Market definition

Data Table on Offerings of companies included in the market definition

4.2 Market segment analysis

Market segments

4.3 Market size 2025

4.4 Market outlook: Forecast for 2025-2030

Chart on Global - Market size and forecast 2025-2030 ($ million)
Data Table on Global - Market size and forecast 2025-2030 ($ million)
Chart on Global Market: Year-over-year growth 2025-2030 (%)
Data Table on Global Market: Year-over-year growth 2025-2030 (%)

5. Historic Market Size

5.1 Global Video Analytics Market 2020 - 2024

Historic Market Size - Data Table on Global Video Analytics Market 2020 - 2024 ($ million)

5.2 End-user segment analysis 2020 - 2024

Historic Market Size - End-user Segment 2020 - 2024 ($ million)

5.3 Deployment segment analysis 2020 - 2024

Historic Market Size - Deployment Segment 2020 - 2024 ($ million)

5.4 Component segment analysis 2020 - 2024

Historic Market Size - Component Segment 2020 - 2024 ($ million)

5.5 Geography segment analysis 2020 - 2024

Historic Market Size - Geography Segment 2020 - 2024 ($ million)

5.6 Country segment analysis 2020 - 2024

Historic Market Size - Country Segment 2020 - 2024 ($ million)

6. Qualitative Analysis

6.1 Impact of AI on global video analytics market

6.2 Impact of geopolitical conflicts on global video analytics market

7. Five Forces Analysis

7.1 Five forces summary

Five forces analysis - Comparison between 2025 and 2030

7.2 Bargaining power of buyers

Bargaining power of buyers - Impact of key factors 2025 and 2030

7.3 Bargaining power of suppliers

Bargaining power of suppliers - Impact of key factors in 2025 and 2030

7.4 Threat of new entrants

Threat of new entrants - Impact of key factors in 2025 and 2030

7.5 Threat of substitutes

Threat of substitutes - Impact of key factors in 2025 and 2030

7.6 Threat of rivalry

Threat of rivalry - Impact of key factors in 2025 and 2030

7.7 Market condition

Chart on Market condition - Five forces 2025 and 2030

8. Market Segmentation by End-user

8.1 Market segments

Chart on End-user - Market share 2025-2030 (%)
Data Table on End-user - Market share 2025-2030 (%)

8.2 Comparison by End-user

Chart on Comparison by End-user
Data Table on Comparison by End-user

8.3 Government sector - Market size and forecast 2025-2030

Chart on Government sector - Market size and forecast 2025-2030 ($ million)
Data Table on Government sector - Market size and forecast 2025-2030 ($ million)
Chart on Government sector - Year-over-year growth 2025-2030 (%)
Data Table on Government sector - Year-over-year growth 2025-2030 (%)

8.4 Commercial sector - Market size and forecast 2025-2030

Chart on Commercial sector - Market size and forecast 2025-2030 ($ million)
Data Table on Commercial sector - Market size and forecast 2025-2030 ($ million)
Chart on Commercial sector - Year-over-year growth 2025-2030 (%)
Data Table on Commercial sector - Year-over-year growth 2025-2030 (%)

8.5 Banking and financial services - Market size and forecast 2025-2030

Chart on Banking and financial services - Market size and forecast 2025-2030 ($ million)
Data Table on Banking and financial services - Market size and forecast 2025-2030 ($ million)
Chart on Banking and financial services - Year-over-year growth 2025-2030 (%)
Data Table on Banking and financial services - Year-over-year growth 2025-2030 (%)

8.6 Traffic management sector - Market size and forecast 2025-2030

Chart on Traffic management sector - Market size and forecast 2025-2030 ($ million)
Data Table on Traffic management sector - Market size and forecast 2025-2030 ($ million)
Chart on Traffic management sector - Year-over-year growth 2025-2030 (%)
Data Table on Traffic management sector - Year-over-year growth 2025-2030 (%)

8.7 Others - Market size and forecast 2025-2030

Chart on Others - Market size and forecast 2025-2030 ($ million)
Data Table on Others - Market size and forecast 2025-2030 ($ million)
Chart on Others - Year-over-year growth 2025-2030 (%)
Data Table on Others - Year-over-year growth 2025-2030 (%)

8.8 Market opportunity by End-user

Market opportunity by End-user ($ million)
Data Table on Market opportunity by End-user ($ million)

9. Market Segmentation by Deployment

9.1 Market segments

Chart on Deployment - Market share 2025-2030 (%)
Data Table on Deployment - Market share 2025-2030 (%)

9.2 Comparison by Deployment

Chart on Comparison by Deployment
Data Table on Comparison by Deployment

9.3 On-premises - Market size and forecast 2025-2030

Chart on On-premises - Market size and forecast 2025-2030 ($ million)
Data Table on On-premises - Market size and forecast 2025-2030 ($ million)
Chart on On-premises - Year-over-year growth 2025-2030 (%)
Data Table on On-premises - Year-over-year growth 2025-2030 (%)

9.4 Cloud - Market size and forecast 2025-2030

Chart on Cloud - Market size and forecast 2025-2030 ($ million)
Data Table on Cloud - Market size and forecast 2025-2030 ($ million)
Chart on Cloud - Year-over-year growth 2025-2030 (%)
Data Table on Cloud - Year-over-year growth 2025-2030 (%)

9.5 Market opportunity by Deployment

Market opportunity by Deployment ($ million)
Data Table on Market opportunity by Deployment ($ million)

10. Market Segmentation by Component

10.1 Market segments

Chart on Component - Market share 2025-2030 (%)
Data Table on Component - Market share 2025-2030 (%)

10.2 Comparison by Component

Chart on Comparison by Component
Data Table on Comparison by Component

10.3 Software - Market size and forecast 2025-2030

Chart on Software - Market size and forecast 2025-2030 ($ million)
Data Table on Software - Market size and forecast 2025-2030 ($ million)
Chart on Software - Year-over-year growth 2025-2030 (%)
Data Table on Software - Year-over-year growth 2025-2030 (%)

10.4 Services - Market size and forecast 2025-2030

Chart on Services - Market size and forecast 2025-2030 ($ million)
Data Table on Services - Market size and forecast 2025-2030 ($ million)
Chart on Services - Year-over-year growth 2025-2030 (%)
Data Table on Services - Year-over-year growth 2025-2030 (%)

10.5 Market opportunity by Component

Market opportunity by Component ($ million)
Data Table on Market opportunity by Component ($ million)

11. Customer Landscape

11.1 Customer landscape overview

Analysis of price sensitivity, lifecycle, customer purchase basket, adoption rates, and purchase criteria

12. Geographic Landscape

12.1 Geographic segmentation

Chart on Market share by geography 2025-2030 (%)
Data Table on Market share by geography 2025-2030 (%)

12.2 Geographic comparison

Chart on Geographic comparison
Data Table on Geographic comparison

12.3 North America - Market size and forecast 2025-2030

Chart on North America - Market size and forecast 2025-2030 ($ million)
Data Table on North America - Market size and forecast 2025-2030 ($ million)
Chart on North America - Year-over-year growth 2025-2030 (%)
Data Table on North America - Year-over-year growth 2025-2030 (%)
Chart on Regional Comparison - North America
Data Table on Regional Comparison - North America

12.3.1 US - Market size and forecast 2025-2030

Chart on US - Market size and forecast 2025-2030 ($ million)
Data Table on US - Market size and forecast 2025-2030 ($ million)
Chart on US - Year-over-year growth 2025-2030 (%)
Data Table on US - Year-over-year growth 2025-2030 (%)

12.3.2 Canada - Market size and forecast 2025-2030

Chart on Canada - Market size and forecast 2025-2030 ($ million)
Data Table on Canada - Market size and forecast 2025-2030 ($ million)
Chart on Canada - Year-over-year growth 2025-2030 (%)
Data Table on Canada - Year-over-year growth 2025-2030 (%)

12.3.3 Mexico - Market size and forecast 2025-2030

Chart on Mexico - Market size and forecast 2025-2030 ($ million)
Data Table on Mexico - Market size and forecast 2025-2030 ($ million)
Chart on Mexico - Year-over-year growth 2025-2030 (%)
Data Table on Mexico - Year-over-year growth 2025-2030 (%)

12.4 APAC - Market size and forecast 2025-2030

Chart on APAC - Market size and forecast 2025-2030 ($ million)
Data Table on APAC - Market size and forecast 2025-2030 ($ million)
Chart on APAC - Year-over-year growth 2025-2030 (%)
Data Table on APAC - Year-over-year growth 2025-2030 (%)
Chart on Regional Comparison - APAC
Data Table on Regional Comparison - APAC

12.4.1 China - Market size and forecast 2025-2030

Chart on China - Market size and forecast 2025-2030 ($ million)
Data Table on China - Market size and forecast 2025-2030 ($ million)
Chart on China - Year-over-year growth 2025-2030 (%)
Data Table on China - Year-over-year growth 2025-2030 (%)

12.4.2 Japan - Market size and forecast 2025-2030

Chart on Japan - Market size and forecast 2025-2030 ($ million)
Data Table on Japan - Market size and forecast 2025-2030 ($ million)
Chart on Japan - Year-over-year growth 2025-2030 (%)
Data Table on Japan - Year-over-year growth 2025-2030 (%)

12.4.3 India - Market size and forecast 2025-2030

Chart on India - Market size and forecast 2025-2030 ($ million)
Data Table on India - Market size and forecast 2025-2030 ($ million)
Chart on India - Year-over-year growth 2025-2030 (%)
Data Table on India - Year-over-year growth 2025-2030 (%)

12.4.4 South Korea - Market size and forecast 2025-2030

Chart on South Korea - Market size and forecast 2025-2030 ($ million)
Data Table on South Korea - Market size and forecast 2025-2030 ($ million)
Chart on South Korea - Year-over-year growth 2025-2030 (%)
Data Table on South Korea - Year-over-year growth 2025-2030 (%)

12.4.5 Australia - Market size and forecast 2025-2030

Chart on Australia - Market size and forecast 2025-2030 ($ million)
Data Table on Australia - Market size and forecast 2025-2030 ($ million)
Chart on Australia - Year-over-year growth 2025-2030 (%)
Data Table on Australia - Year-over-year growth 2025-2030 (%)

12.4.6 Indonesia - Market size and forecast 2025-2030

Chart on Indonesia - Market size and forecast 2025-2030 ($ million)
Data Table on Indonesia - Market size and forecast 2025-2030 ($ million)
Chart on Indonesia - Year-over-year growth 2025-2030 (%)
Data Table on Indonesia - Year-over-year growth 2025-2030 (%)

12.5 Europe - Market size and forecast 2025-2030

Chart on Europe - Market size and forecast 2025-2030 ($ million)
Data Table on Europe - Market size and forecast 2025-2030 ($ million)
Chart on Europe - Year-over-year growth 2025-2030 (%)
Data Table on Europe - Year-over-year growth 2025-2030 (%)
Chart on Regional Comparison - Europe
Data Table on Regional Comparison - Europe

12.5.1 Germany - Market size and forecast 2025-2030

Chart on Germany - Market size and forecast 2025-2030 ($ million)
Data Table on Germany - Market size and forecast 2025-2030 ($ million)
Chart on Germany - Year-over-year growth 2025-2030 (%)
Data Table on Germany - Year-over-year growth 2025-2030 (%)

12.5.2 UK - Market size and forecast 2025-2030

Chart on UK - Market size and forecast 2025-2030 ($ million)
Data Table on UK - Market size and forecast 2025-2030 ($ million)
Chart on UK - Year-over-year growth 2025-2030 (%)
Data Table on UK - Year-over-year growth 2025-2030 (%)

12.5.3 France - Market size and forecast 2025-2030

Chart on France - Market size and forecast 2025-2030 ($ million)
Data Table on France - Market size and forecast 2025-2030 ($ million)
Chart on France - Year-over-year growth 2025-2030 (%)
Data Table on France - Year-over-year growth 2025-2030 (%)

12.5.4 Italy - Market size and forecast 2025-2030

Chart on Italy - Market size and forecast 2025-2030 ($ million)
Data Table on Italy - Market size and forecast 2025-2030 ($ million)
Chart on Italy - Year-over-year growth 2025-2030 (%)
Data Table on Italy - Year-over-year growth 2025-2030 (%)

12.5.5 Spain - Market size and forecast 2025-2030

Chart on Spain - Market size and forecast 2025-2030 ($ million)
Data Table on Spain - Market size and forecast 2025-2030 ($ million)
Chart on Spain - Year-over-year growth 2025-2030 (%)
Data Table on Spain - Year-over-year growth 2025-2030 (%)

12.5.6 The Netherlands - Market size and forecast 2025-2030

Chart on The Netherlands - Market size and forecast 2025-2030 ($ million)
Data Table on The Netherlands - Market size and forecast 2025-2030 ($ million)
Chart on The Netherlands - Year-over-year growth 2025-2030 (%)
Data Table on The Netherlands - Year-over-year growth 2025-2030 (%)

12.6 South America - Market size and forecast 2025-2030

Chart on South America - Market size and forecast 2025-2030 ($ million)
Data Table on South America - Market size and forecast 2025-2030 ($ million)
Chart on South America - Year-over-year growth 2025-2030 (%)
Data Table on South America - Year-over-year growth 2025-2030 (%)
Chart on Regional Comparison - South America
Data Table on Regional Comparison - South America

12.6.1 Brazil - Market size and forecast 2025-2030

Chart on Brazil - Market size and forecast 2025-2030 ($ million)
Data Table on Brazil - Market size and forecast 2025-2030 ($ million)
Chart on Brazil - Year-over-year growth 2025-2030 (%)
Data Table on Brazil - Year-over-year growth 2025-2030 (%)

12.6.2 Argentina - Market size and forecast 2025-2030

Chart on Argentina - Market size and forecast 2025-2030 ($ million)
Data Table on Argentina - Market size and forecast 2025-2030 ($ million)
Chart on Argentina - Year-over-year growth 2025-2030 (%)
Data Table on Argentina - Year-over-year growth 2025-2030 (%)

12.6.3 Chile - Market size and forecast 2025-2030

Chart on Chile - Market size and forecast 2025-2030 ($ million)
Data Table on Chile - Market size and forecast 2025-2030 ($ million)
Chart on Chile - Year-over-year growth 2025-2030 (%)
Data Table on Chile - Year-over-year growth 2025-2030 (%)

12.7 Middle East and Africa - Market size and forecast 2025-2030

Chart on Middle East and Africa - Market size and forecast 2025-2030 ($ million)
Data Table on Middle East and Africa - Market size and forecast 2025-2030 ($ million)
Chart on Middle East and Africa - Year-over-year growth 2025-2030 (%)
Data Table on Middle East and Africa - Year-over-year growth 2025-2030 (%)
Chart on Regional Comparison - Middle East and Africa
Data Table on Regional Comparison - Middle East and Africa

12.7.1 Saudi Arabia - Market size and forecast 2025-2030

Chart on Saudi Arabia - Market size and forecast 2025-2030 ($ million)
Data Table on Saudi Arabia - Market size and forecast 2025-2030 ($ million)
Chart on Saudi Arabia - Year-over-year growth 2025-2030 (%)
Data Table on Saudi Arabia - Year-over-year growth 2025-2030 (%)

12.7.2 UAE - Market size and forecast 2025-2030

Chart on UAE - Market size and forecast 2025-2030 ($ million)
Data Table on UAE - Market size and forecast 2025-2030 ($ million)
Chart on UAE - Year-over-year growth 2025-2030 (%)
Data Table on UAE - Year-over-year growth 2025-2030 (%)

12.7.3 South Africa - Market size and forecast 2025-2030

Chart on South Africa - Market size and forecast 2025-2030 ($ million)
Data Table on South Africa - Market size and forecast 2025-2030 ($ million)
Chart on South Africa - Year-over-year growth 2025-2030 (%)
Data Table on South Africa - Year-over-year growth 2025-2030 (%)

12.7.4 Israel - Market size and forecast 2025-2030

Chart on Israel - Market size and forecast 2025-2030 ($ million)
Data Table on Israel - Market size and forecast 2025-2030 ($ million)
Chart on Israel - Year-over-year growth 2025-2030 (%)
Data Table on Israel - Year-over-year growth 2025-2030 (%)

12.7.5 Turkey - Market size and forecast 2025-2030

Chart on Turkey - Market size and forecast 2025-2030 ($ million)
Data Table on Turkey - Market size and forecast 2025-2030 ($ million)
Chart on Turkey - Year-over-year growth 2025-2030 (%)
Data Table on Turkey - Year-over-year growth 2025-2030 (%)

12.8 Market opportunity by geography

Market opportunity by geography ($ million)
Data Tables on Market opportunity by geography ($ million)

13. Drivers, Challenges, and Opportunity

13.1 Market drivers

Expanding smart city deployments propelling urban infrastructure modernization
Urgent corporate demand automated monitoring elevating facility security efficiency
Widespread enterprise adoption cloud deployment architectures lowering entry barriers

13.2 Market challenges

Rising data privacy regulations inhibiting unrestricted biometric deployment
High system integration costs restricting small enterprise technological adoption
Algorithmic false positives undermining operational trust security frameworks

13.3 Impact of drivers and challenges

Impact of drivers and challenges in 2025 and 2030

13.4 Market opportunities

Accelerated industry transition toward distributed edge computing architectures
Widespread integration generative artificial intelligence platforms natural language interrogation
Rapid proliferation deep learning drone analytics public safety applications

14. Competitive Landscape

14.1 Overview

14.2

Overview on criticality of inputs and factors of differentiation

14.3 Landscape disruption

Overview on factors of disruption

14.4 Industry risks

Impact of key risks on business

15. Competitive Analysis

15.1 Companies profiled

Companies covered

15.2 Company ranking index

15.3 Market positioning of companies

Matrix on companies position and classification

15.4 Avigilon Corp.

Avigilon Corp. - Overview
Avigilon Corp. - Product / Service
Avigilon Corp. - Key offerings
SWOT

15.5 Axis Communications AB

Axis Communications AB - Overview
Axis Communications AB - Product / Service
Axis Communications AB - Key offerings
SWOT

15.6 AxxonSoft

AxxonSoft - Overview
AxxonSoft - Product / Service
AxxonSoft - Key offerings
SWOT

15.7 Bosch Sicherheitssysteme GmbH

Bosch Sicherheitssysteme GmbH - Overview
Bosch Sicherheitssysteme GmbH - Product / Service
Bosch Sicherheitssysteme GmbH - Key offerings
SWOT

15.8 BriefCam Ltd.

BriefCam Ltd. - Overview
BriefCam Ltd. - Product / Service
BriefCam Ltd. - Key offerings
SWOT

15.9 Genetec Inc.

Genetec Inc. - Overview
Genetec Inc. - Product / Service
Genetec Inc. - Key offerings
SWOT

15.10 Gorilla Technology Group Inc

Gorilla Technology Group Inc - Overview
Gorilla Technology Group Inc - Product / Service
Gorilla Technology Group Inc - Key offerings
SWOT

15.11 Hangzhou Hikvision Digital

Hangzhou Hikvision Digital - Overview
Hangzhou Hikvision Digital - Business segments
Hangzhou Hikvision Digital - Key news
Hangzhou Hikvision Digital - Key offerings
Hangzhou Hikvision Digital - Segment focus
SWOT

15.12 Hanwha Vision Co. Ltd.

Hanwha Vision Co. Ltd. - Overview
Hanwha Vision Co. Ltd. - Product / Service
Hanwha Vision Co. Ltd. - Key offerings
SWOT

15.13 i PRO Co. Ltd.

i PRO Co. Ltd. - Overview
i PRO Co. Ltd. - Product / Service
i PRO Co. Ltd. - Key offerings
SWOT

15.14 Intelligent Security Systems

Intelligent Security Systems - Overview
Intelligent Security Systems - Product / Service
Intelligent Security Systems - Key offerings
SWOT

15.15 Milestone systems AS

Milestone systems AS - Overview
Milestone systems AS - Product / Service
Milestone systems AS - Key offerings
SWOT

15.16 Oosto

Oosto - Overview
Oosto - Product / Service
Oosto - Key offerings
SWOT

15.17 Senstar Corp.

Senstar Corp. - Overview
Senstar Corp. - Product / Service
Senstar Corp. - Key offerings
SWOT

15.18 VCA Technology

VCA Technology - Overview
VCA Technology - Product / Service
VCA Technology - Key offerings
SWOT

16. Appendix

16.1 Scope of the report

Market definition
Objectives
Notes and caveats

16.2 Inclusions and exclusions checklist

Inclusions checklist
Exclusions checklist

16.3 Currency conversion rates for US$

16.4 Research methodology

16.5 Data procurement

Information sources

16.6 Data validation

16.7 Validation techniques employed for market sizing

16.8 Data synthesis

16.9 360 degree market analysis

16.10 List of abbreviations

Research Methodology

Technavio presents a detailed picture of the market by way of study, synthesis, and summation of data from multiple sources. The analysts have presented the various facets of the market with a particular focus on identifying the key industry influencers. The data thus presented is comprehensive, reliable, and the result of extensive research, both primary and secondary.

INFORMATION SOURCES

Primary sources

  • Manufacturers and suppliers
  • Channel partners
  • Industry experts
  • Strategic decision makers

Secondary sources

  • Industry journals and periodicals
  • Government data
  • Financial reports of key industry players
  • Historical data
  • Press releases

DATA ANALYSIS

Data Synthesis

  • Collation of data
  • Estimation of key figures
  • Analysis of derived insights

Data Validation

  • Triangulation with data models
  • Reference against proprietary databases
  • Corroboration with industry experts

REPORT WRITING

Qualitative

  • Market drivers
  • Market challenges
  • Market trends
  • Five forces analysis

Quantitative

  • Market size and forecast
  • Market segmentation
  • Geographical insights
  • Competitive landscape

Interested in this report?

Get your sample now to see our research methodology and insights!

Download Now

Frequently Asked Questions

Video Analytics market growth will increase by USD 52974.7 million during 2026-2030.

The Video Analytics market is expected to grow at a CAGR of 30.2% during 2026-2030.

Video Analytics market is segmented by End-user (Government sector, Commercial sector, Banking and financial services, Traffic management sector, Others) Deployment (On-premises, Cloud) Component (Software, Services)

AllGoVision Technologies Ltd, Avigilon Corp., Axis Communications AB, AxxonSoft, Bosch Sicherheitssysteme GmbH, BriefCam Ltd., Genetec Inc., Gorilla Technology Group Inc, Hangzhou Hikvision Digital, Hanwha Vision Co. Ltd., i PRO Co. Ltd., Intelligent Security Systems, IntelliVision, Ipsotek Ltd., Irisity AB., Milestone systems AS, Oosto, Senstar Corp., VCA Technology, Videonetics Technology Pvt Ltd are a few of the key vendors in the Video Analytics market.

APAC will register the highest growth rate of 43.9% among the other regions. Therefore, the Video Analytics market in APAC is expected to garner significant business opportunities for the vendors during the forecast period.

US, Canada, Mexico, China, Japan, India, South Korea, Australia, Indonesia, Germany, UK, France, Italy, Spain, The Netherlands, Brazil, Argentina, Chile, Saudi Arabia, UAE, South Africa, Israel, Turkey

  • Expanding smart city deployments propelling urban infrastructure modernization is the driving factor this market.

The Video Analytics market vendors should focus on grabbing business opportunities from the End-user segment as it accounted for the largest market share in the base year.
RIA - Research AI Assistant
Ask RIA
