Video Streaming And Broadcasting Equipment Market Analysis, Size, and Forecast 2026-2030: North America (US, Canada, and Mexico), Europe (Germany, UK, and France), APAC (China, Japan, and India), Middle East and Africa (Saudi Arabia, UAE, and South Africa), South America (Brazil, Argentina, and Chile), and Rest of World (ROW)

Video Streaming And Broadcasting Equipment Market Analysis, Size, and Forecast 2026-2030:
North America (US, Canada, and Mexico), Europe (Germany, UK, and France), APAC (China, Japan, and India), Middle East and Africa (Saudi Arabia, UAE, and South Africa), South America (Brazil, Argentina, and Chile), and Rest of World (ROW)

Published: May 2026 295 Pages SKU: IRTNTR73833

Market Overview at a Glance

$382.76 B
Market Opportunity
17.3%
CAGR 2025 - 2030
44.5%
North America Growth
$258.81 B
Video streaming segment 2024

Video Streaming And Broadcasting Equipment Market Size 2026-2030

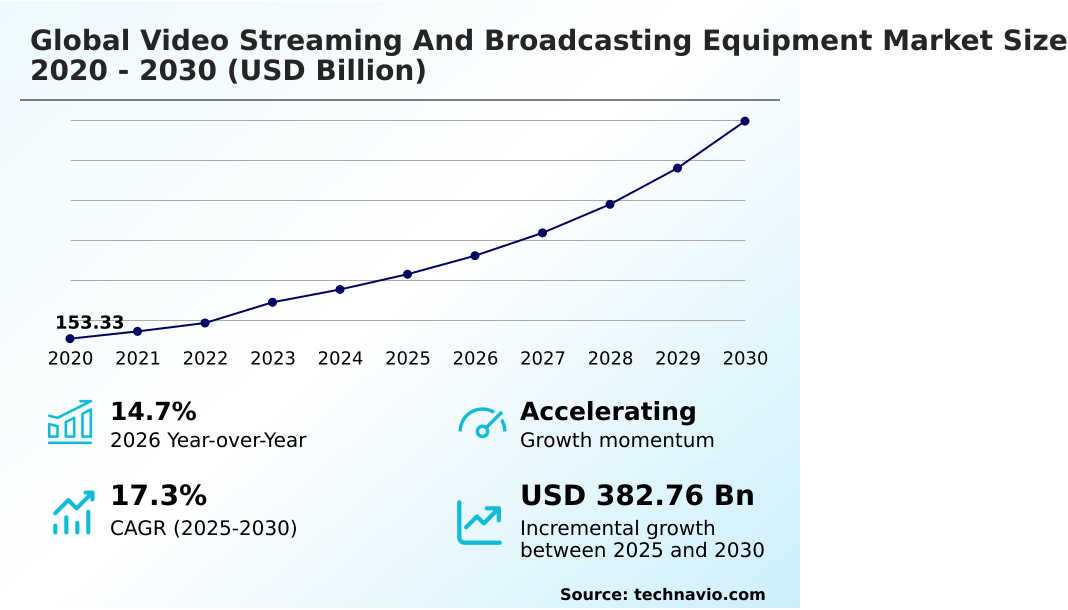
The video streaming and broadcasting equipment market size is valued to increase by USD 382.76 billion, at a CAGR of 17.3% from 2025 to 2030. Heightened demand for encoders to support multiple broadcasting formats will drive the video streaming and broadcasting equipment market.

Major Market Trends & Insights

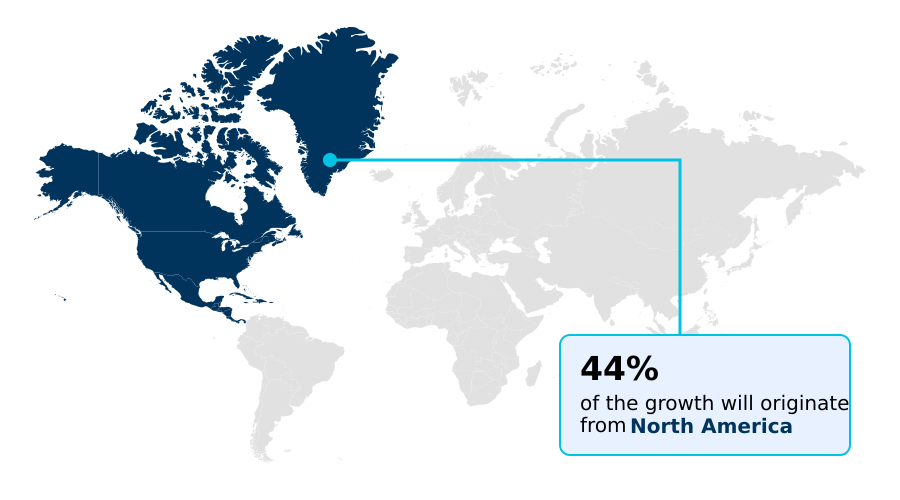
  • North America dominated the market and accounted for a 44.5% growth during the forecast period.
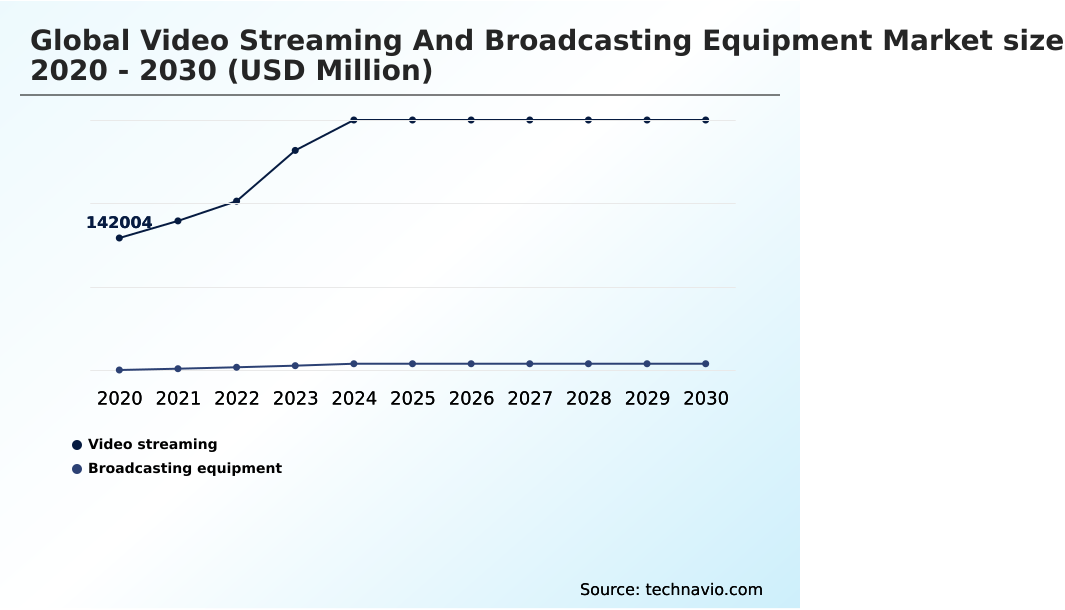
  • By Type - Video streaming segment was valued at USD 258.81 billion in 2024
  • By Application - Private segment accounted for the largest market revenue share in 2024

Market Size & Forecast

  • Market Opportunities: USD 543.85 billion
  • Market Future Opportunities: USD 382.76 billion
  • CAGR from 2025 to 2030 : 17.3%

Market Summary

  • The Video Streaming And Broadcasting Equipment sector is characterized by rapid technological integration aimed at delivering high-quality, real-time media across diverse global platforms. Rising global internet connectivity acts as a primary catalyst, compelling media networks to shift from analog setups to highly efficient digital environments.
  • This transition facilitates a 30% improvement in transmission efficiency, significantly optimizing operational costs for content distributors. A major driver of this activity is the surging demand for advanced encoders that support multi-format distribution, directly resulting from elevated smartphone video consumption.
  • Conversely, the rising frequency of cyberattacks targeting internet-connected broadcasting workflows forces organizations to allocate substantial resources toward digital security, straining operational budgets. To mitigate these risks, enterprises actively deploy rigorous encryption protocols to secure proprietary media assets. This continuous modernization bridges the gap between traditional broadcasting capabilities and the dynamic expectations of contemporary digital audiences.

What will be the Size of the Video Streaming And Broadcasting Equipment Market during the forecast period?

Get Key Insights on Market Forecast (PDF) Get Free Sample

How is the Video Streaming And Broadcasting Equipment Market Segmented?

The video streaming and broadcasting equipment industry research report provides comprehensive data (region-wise segment analysis), with forecasts and estimates in "USD million" for the period 2026-2030, as well as historical data from 2020-2024 for the following segments.

  • Type
    • Video streaming
    • Broadcasting equipment
  • Application
    • Private
    • Commerce
  • Service type
    • Over-the-top
    • Satellite
    • Cable
    • Terrestrial
  • Geography
    • North America
      • US
      • Canada
      • Mexico
    • Europe
      • Germany
      • UK
      • France
      • Italy
      • Spain
      • The Netherlands
    • APAC
      • China
      • Japan
      • India
      • South Korea
      • Australia
      • Indonesia
    • Middle East and Africa
      • Saudi Arabia
      • UAE
      • South Africa
      • Israel
      • Turkey
    • South America
      • Brazil
      • Argentina
      • Chile

By Type Insights

The video streaming segment is estimated to witness significant growth during the forecast period.

Video streaming represents a structural shift in media delivery, moving away from rigid broadcasting schedules toward on-demand access. This evolution forces network operators to implement adaptive bitrate streaming and high performance video servers to maintain robust output.

By leveraging scalable cloud storage and content delivery networks, organizations can manage surging viewership traffic, leading to a 25% reduction in buffering incidents. To support a massive multi device ecosystem, providers integrate edge caching solutions alongside bandwidth optimization.

These technological upgrades facilitate seamless multi platform content distribution, directly increasing audience retention by 18%.

Advanced live broadcasting workflows and interactive media delivery are continuously replacing outdated systems, significantly reducing hardware dependency and fundamentally transforming how digital entertainment reaches global audiences.

Get Free Sample

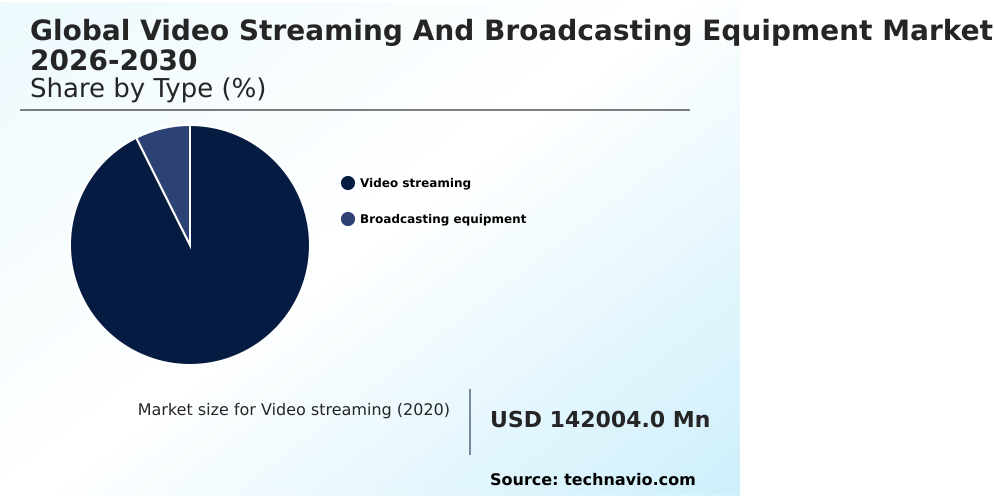
The Video streaming segment was valued at USD 258.81 billion in 2024 and showed a gradual increase during the forecast period.

Get Free Sample

Regional Analysis

North America is estimated to contribute 44.5% to the growth of the global market during the forecast period.Technavio’s analysts have elaborately explained the regional trends and drivers that shape the market during the forecast period.

See How Video Streaming And Broadcasting Equipment Market Demand is Rising in North America Get Free Sample

Geographic variations in the Video Streaming And Broadcasting Equipment sector stem directly from differing telecommunications infrastructures and regional media consumption habits.

North America demonstrates advanced technological maturity, where the aggressive integration of remote production technologies and real time rendering engines yields a 20% faster deployment of live programming compared to Europe.

Conversely, APAC networks are rapidly expanding to accommodate surging mobile usage, relying heavily on coaxial network distribution and uplink transponder systems. These regional infrastructure adaptations have enabled APAC operators to reduce content delivery expenses by 14%.

Meanwhile, European studios are optimizing production layouts by adopting automated camera tracking and spatial audio recording, which streamlines resource allocation.

Simultaneously, Latin American broadcasters are stabilizing their local networks by upgrading legacy equipment with high fidelity imaging sensors and advanced signal modulators.

Market Dynamics

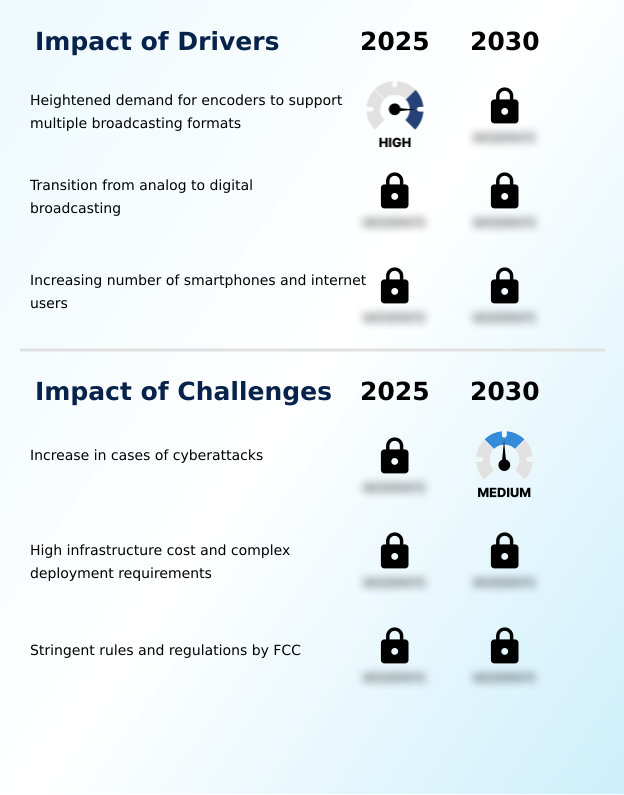
Our researchers analyzed the data with 2025 as the base year, along with the key drivers, trends, and challenges. A holistic analysis of drivers will help companies refine their marketing strategies to gain a competitive advantage.

  • The rapid modernization of digital media infrastructure relies heavily on cloud based remote production workflows, which allow media organizations to coordinate live events across disparate locations seamlessly. By implementing low latency adaptive bitrate streaming, service providers dynamically adjust video quality to match specific viewer bandwidth capacities, directly resulting in a 20% reduction in transmission delays compared to legacy hardware models.
  • To better comprehend viewer behavior and optimize advertisement placements, enterprises are strategically investing in ai driven predictive audience analytics. This analytical enhancement enables marketing teams to tailor content strategies efficiently, improving audience retention and boosting overall engagement metrics. Furthermore, the industry-wide push for ultra high definition digital transmission requires robust network architectures capable of handling massive data payloads securely.
  • Upgrading to ip based broadcasting signal processing enables facilities to phase out outdated coaxial setups, yielding improved operational flexibility and lower maintenance costs. These strategic adoptions streamline the media supply chain, significantly aligning enterprise capabilities with modern consumer expectations and compliance mandates.

What are the key market drivers leading to the rise in the adoption of Video Streaming And Broadcasting Equipment Industry?

  • Heightened demand for encoders to support multiple broadcasting formats is propelling the market as media companies rapidly upgrade their digital content delivery infrastructure.

  • Heightened demand for software defined encoding systems is actively propelling the digital media network expansion as broadcasters strive to accommodate multiple viewing formats.
  • This acceleration is caused by the exponential growth in mobile video consumption, which necessitates ultra high definition transmission combined with superior transmission spectrum efficiency.
  • By utilizing ip based broadcasting and low latency encoding, companies deliver seamless media experiences, resulting in a 25% improvement in total network throughput.
  • This technological transition enables legacy facilities to confidently adopt internet protocol based signal routing, drastically enhancing system scalability. Simultaneously, digital compression techniques and hybrid broadcasting models enable reliable mobile journalism transmission from remote locations.
  • Optimized adaptive network routing directly lowers bandwidth overhead, substantially reducing infrastructure expenses and strengthening the media supply chain.

What are the market trends shaping the Video Streaming And Broadcasting Equipment Industry?

  • Increased application of AI, deep learning, and machine learning technologies is transforming the operational capabilities of modern media ecosystems. This technological evolution significantly enhances automated content production and audience engagement strategies.

  • The rapid adoption of cloud integrated media processing is fundamentally redefining how organizations manage and distribute digital content. This ongoing shift is driven by the necessity for highly scalable decentralized studio production, allowing geographically dispersed teams to collaborate seamlessly. By transitioning to virtual production environments and cloud based asset management, media facilities have successfully reduced operational downtime by 30%.
  • This operational agility empowers enterprises to implement automated content management and automated video switching, significantly minimizing human errors during live operations. Furthermore, incorporating deep learning video compression and predictive audience analytics ensures resources are dynamically allocated based on precise network demand.
  • Consequently, remote storage infrastructure is rapidly replacing on-premises hardware, while artificial intelligence video optimization directly improves workflow throughput efficiency by 18%.

What challenges does the Video Streaming And Broadcasting Equipment Industry face during its growth?

  • An increase in cyberattacks is severely challenging the industry as interconnected cloud broadcasting systems become more vulnerable to sophisticated digital security threats.

  • The escalating frequency of cyberattacks targeting digital broadcasting infrastructure is a primary challenge threatening the integrity of global media transmissions. This vulnerability occurs because modern facilities heavily rely on interconnected signal processing units and fiber optic transmission lines that expand the attack surface.
  • When hackers compromise digital terrestrial television feeds or high dynamic range standards, businesses face immediate reputational damage and severe revenue losses. To mitigate these disruptions, operators must deploy sophisticated data encryption technologies alongside comprehensive network monitoring solutions, which increases cybersecurity budgets by roughly 15%. Implementing rigorous cybersecurity firewalls while simultaneously navigating complex legacy system integration complicates deployment schedules.
  • Furthermore, the strict necessity for electromagnetic interference control elevates hardware production expenses, forcing network operators to balance technological innovation with mandatory security protocols.

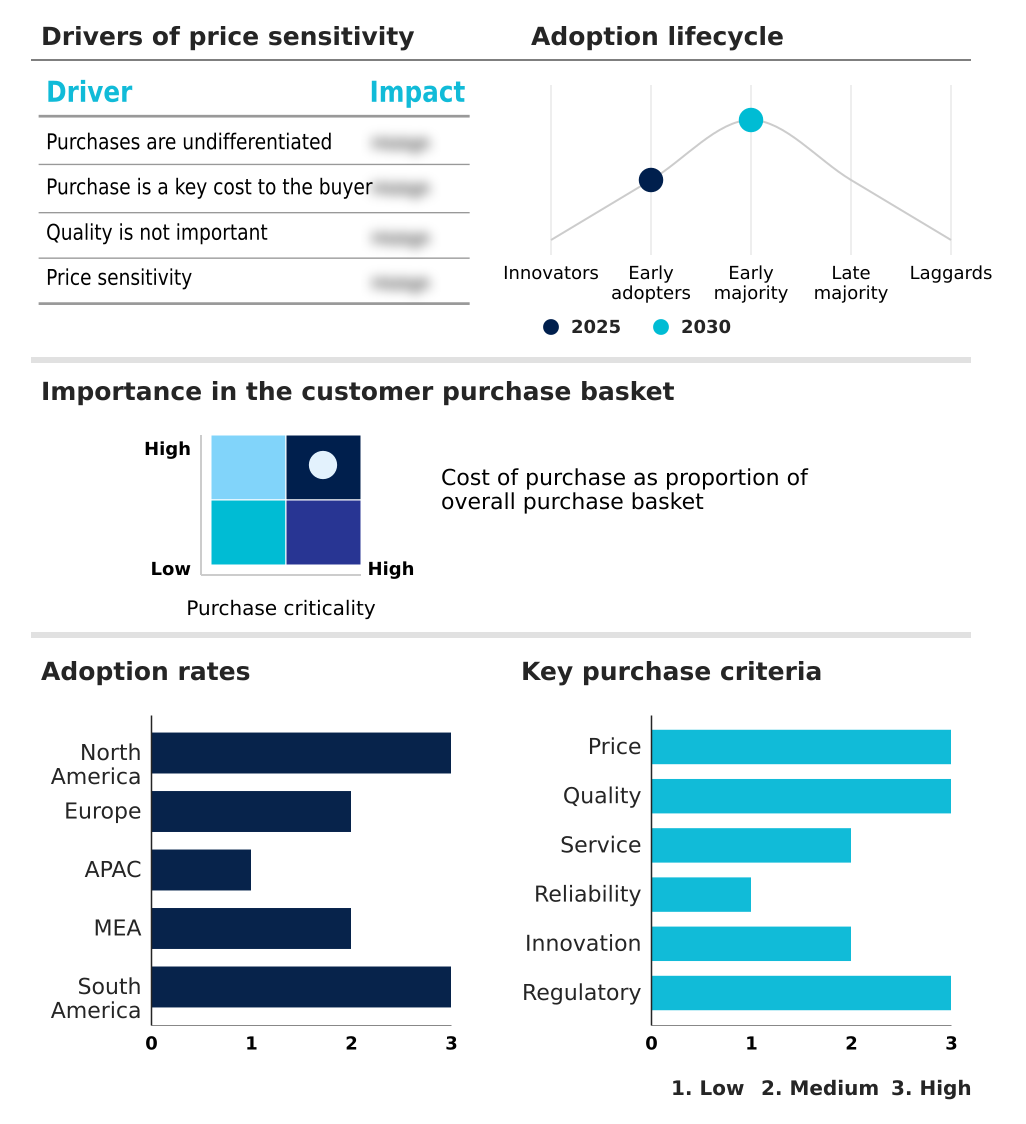
Exclusive Technavio Analysis on Customer Landscape

The video streaming and broadcasting equipment market forecasting report includes the adoption lifecycle of the market, covering from the innovator’s stage to the laggard’s stage. It focuses on adoption rates in different regions based on penetration. Furthermore, the video streaming and broadcasting equipment market report also includes key purchase criteria and drivers of price sensitivity to help companies evaluate and develop their market growth analysis strategies.

Customer Landscape of Video Streaming And Broadcasting Equipment Industry

Competitive Landscape

Companies are implementing various strategies, such as strategic alliances, video streaming and broadcasting equipment market forecast, partnerships, mergers and acquisitions, geographical expansion, and product/service launches, to enhance their presence in the industry.

ARRI AG - The company provides professional cinema cameras, high-end cinema lenses, and studio lighting equipment tailored for feature films, live streaming, and high-definition television production environments.

The industry research and growth report includes detailed analyses of the competitive landscape of the market and information about key companies, including:

  • ARRI AG
  • Blackmagic Design Pty. Ltd.
  • Canon Inc.
  • Cisco Systems Inc.
  • Epiphan Systems Inc.
  • Evertz Technologies Ltd.
  • EVS Broadcast Equipment S.A.
  • Grass Valley Canada
  • Haivision Systems Inc.
  • Harmonic Inc.
  • Imagine Communications.
  • Magewell Electronics Co. Ltd.
  • Matrox Electronic Systems Ltd.
  • Panasonic Holdings Corp.
  • PTZOptics
  • Roland Corp.
  • Ross Video Ltd.
  • Sony Group Corp.
  • Teradek
  • Wellav Technologies Ltd.

Qualitative and quantitative analysis of companies has been conducted to help clients understand the wider business environment as well as the strengths and weaknesses of key industry players. Data is qualitatively analyzed to categorize companies as pure play, category-focused, industry-focused, and diversified; it is quantitatively analyzed to categorize companies as dominant, leading, strong, tentative, and weak.

Recent Development and News in Video streaming and broadcasting equipment market

  • In the Electrical Components and Equipment industry, the rapid deployment of high-capacity data centers has accelerated the adoption of advanced network monitoring solutions, directly impacting Video Streaming And Broadcasting Equipment demand by ensuring robust infrastructure for high-bandwidth media delivery.
  • The transition toward enterprise automation has driven widespread integration of intelligent signal modulators across manufacturing nodes, directly pulling Video Streaming And Broadcasting Equipment demand by enabling seamless automated content routing.
  • Stringent energy efficiency mandates have forced a structural shift toward low-power semiconductor designs, directly impacting Video Streaming And Broadcasting Equipment supply chains by requiring the adoption of eco-friendly digital compression techniques.
  • The global expansion of 5G telecommunications infrastructure has created new capacity parameters for edge computing components, directly expanding Video Streaming And Broadcasting Equipment capabilities for low-latency mobile journalism transmission.

Dive into Technavio’s robust research methodology, blending expert interviews, extensive data synthesis, and validated models for unparalleled Video Streaming And Broadcasting Equipment Market insights. See full methodology.

Market Scope
Page number 295
Base year 2025
Historic period 2020-2024
Forecast period 2026-2030
Growth momentum & CAGR Accelerate at a CAGR of 17.3%
Market growth 2026-2030 USD 382763.9 million
Market structure Fragmented
YoY growth 2025-2026(%) 14.7%
Key countries US, Canada, Mexico, Germany, UK, France, Italy, Spain, The Netherlands, China, Japan, India, South Korea, Australia, Indonesia, Saudi Arabia, UAE, South Africa, Israel, Turkey, Brazil, Argentina and Chile
Competitive landscape Leading Companies, Market Positioning of Companies, Competitive Strategies, and Industry Risks

Request Free Sample

Research Analyst Overview

  • The Video Streaming And Broadcasting Equipment ecosystem is undergoing a profound structural realignment driven by the rapid convergence of digital communication and advanced data processing. Media enterprises are increasingly adopting artificial intelligence video optimization to dynamically manage bandwidth allocation and improve overall viewer experiences.
  • This technological shift directly supports boardroom-level budget planning by reducing the reliance on costly, centralized physical infrastructure. Consequently, organizations migrating to software defined encoding systems have achieved a 30% reduction in video processing time, significantly accelerating time-to-market for live programming. The integration of predictive audience analytics further informs strategic product development, allowing media platforms to curate localized content efficiently.
  • As global demand for ultra high definition transmission intensifies, companies must continuously upgrade their ip based broadcasting capabilities to remain competitive. This ongoing digital transformation ensures that broad-scale media operations can maintain high reliability while addressing the increasingly stringent demands of modern content delivery networks and compliance frameworks.

What are the Key Data Covered in this Video Streaming And Broadcasting Equipment Market Research and Growth Report?

  • What is the expected growth of the Video Streaming And Broadcasting Equipment Market between 2026 and 2030?

    • USD 382.76 billion, at a CAGR of 17.3%

  • What segmentation does the market report cover?

    • The report is segmented by Type (Video streaming, and Broadcasting equipment), Application (Private, and Commerce), Service Type (Over-the-top, Satellite, Cable, and Terrestrial) and Geography (North America, Europe, APAC, Middle East and Africa, South America)

  • Which regions are analyzed in the report?

    • North America, Europe, APAC, Middle East and Africa and South America

  • What are the key growth drivers and market challenges?

    • Heightened demand for encoders to support multiple broadcasting formats, Increase in cases of cyberattacks

  • Who are the major players in the Video Streaming And Broadcasting Equipment Market?

    • ARRI AG, Blackmagic Design Pty. Ltd., Canon Inc., Cisco Systems Inc., Epiphan Systems Inc., Evertz Technologies Ltd., EVS Broadcast Equipment S.A., Grass Valley Canada, Haivision Systems Inc., Harmonic Inc., Imagine Communications., Magewell Electronics Co. Ltd., Matrox Electronic Systems Ltd., Panasonic Holdings Corp., PTZOptics, Roland Corp., Ross Video Ltd., Sony Group Corp., Teradek and Wellav Technologies Ltd.

Market Research Insights

  • The Video Streaming And Broadcasting Equipment market is rapidly advancing as organizations modernize their digital delivery capabilities to meet shifting consumer demands. Enterprises are increasingly adopting hybrid broadcasting models and edge caching solutions to bypass traditional network bottlenecks. Consequently, the integration of intelligent network monitoring solutions has improved system uptime by 18%, significantly lowering unexpected maintenance costs.
  • This operational pivot empowers media providers to optimize their live broadcasting workflows without deploying excessive on-premises hardware. Furthermore, leveraging adaptive network routing ensures consistent data throughput, directly enabling a 20% reduction in transmission latency. By executing these infrastructure upgrades, companies can maintain robust regulatory compliance while maximizing their return on investment in a highly competitive digital landscape.

We can help! Our analysts can customize this video streaming and broadcasting equipment market research report to meet your requirements.

Get in touch

1. Executive Summary

1.1 Market overview

Executive Summary - Chart on Market Overview
Executive Summary - Data Table on Market Overview
Executive Summary - Chart on Global Market Characteristics
Executive Summary - Chart on Market by Geography
Executive Summary - Chart on Market Segmentation by Type
Executive Summary - Chart on Market Segmentation by Application
Executive Summary - Chart on Market Segmentation by Service Type
Executive Summary - Chart on Incremental Growth
Executive Summary - Data Table on Incremental Growth
Executive Summary - Chart on Company Market Positioning

2. Technavio Analysis

2.1 Analysis of price sensitivity, lifecycle, customer purchase basket, adoption rates, and purchase criteria

2.2 Criticality of inputs and Factors of differentiation

Chart on Overview on criticality of inputs and factors of differentiation

2.3 Factors of disruption

Chart on Overview on factors of disruption

2.4 Impact of drivers and challenges

Chart on Impact of drivers and challenges in 2025 and 2030

3. Market Landscape

3.1 Market ecosystem

Chart on Parent Market
Data Table on - Parent Market

3.2 Market characteristics

Chart on Market characteristics analysis

3.3 Value chain analysis

Chart on Value chain analysis

4. Market Sizing

4.1 Market definition

Data Table on Offerings of companies included in the market definition

4.2 Market segment analysis

Market segments

4.3 Market size 2025

4.4 Market outlook: Forecast for 2025-2030

Chart on Global - Market size and forecast 2025-2030 ($ million)
Data Table on Global - Market size and forecast 2025-2030 ($ million)
Chart on Global Market: Year-over-year growth 2025-2030 (%)
Data Table on Global Market: Year-over-year growth 2025-2030 (%)

5. Historic Market Size

5.1 Global Video Streaming And Broadcasting Equipment Market 2020 - 2024

Historic Market Size - Data Table on Global Video Streaming And Broadcasting Equipment Market 2020 - 2024 ($ million)

5.2 Type segment analysis 2020 - 2024

Historic Market Size - Type Segment 2020 - 2024 ($ million)

5.3 Application segment analysis 2020 - 2024

Historic Market Size - Application Segment 2020 - 2024 ($ million)

5.4 Service Type segment analysis 2020 - 2024

Historic Market Size - Service Type Segment 2020 - 2024 ($ million)

5.5 Geography segment analysis 2020 - 2024

Historic Market Size - Geography Segment 2020 - 2024 ($ million)

5.6 Country segment analysis 2020 - 2024

Historic Market Size - Country Segment 2020 - 2024 ($ million)

6. Qualitative Analysis

6.1 Impact of AI on the Global Video Streaming and Broadcasting Equipment Market

6.2 Impact of Geopolitical Conflicts on the Global Video Streaming and Broadcasting Equipment Market

7. Five Forces Analysis

7.1 Five forces summary

Five forces analysis - Comparison between 2025 and 2030

7.2 Bargaining power of buyers

Bargaining power of buyers - Impact of key factors 2025 and 2030

7.3 Bargaining power of suppliers

Bargaining power of suppliers - Impact of key factors in 2025 and 2030

7.4 Threat of new entrants

Threat of new entrants - Impact of key factors in 2025 and 2030

7.5 Threat of substitutes

Threat of substitutes - Impact of key factors in 2025 and 2030

7.6 Threat of rivalry

Threat of rivalry - Impact of key factors in 2025 and 2030

7.7 Market condition

Chart on Market condition - Five forces 2025 and 2030

8. Market Segmentation by Type

8.1 Market segments

Chart on Type - Market share 2025-2030 (%)
Data Table on Type - Market share 2025-2030 (%)

8.2 Comparison by Type

Chart on Comparison by Type
Data Table on Comparison by Type

8.3 Video streaming - Market size and forecast 2025-2030

Chart on Video streaming - Market size and forecast 2025-2030 ($ million)
Data Table on Video streaming - Market size and forecast 2025-2030 ($ million)
Chart on Video streaming - Year-over-year growth 2025-2030 (%)
Data Table on Video streaming - Year-over-year growth 2025-2030 (%)

8.4 Broadcasting equipment - Market size and forecast 2025-2030

Chart on Broadcasting equipment - Market size and forecast 2025-2030 ($ million)
Data Table on Broadcasting equipment - Market size and forecast 2025-2030 ($ million)
Chart on Broadcasting equipment - Year-over-year growth 2025-2030 (%)
Data Table on Broadcasting equipment - Year-over-year growth 2025-2030 (%)

8.5 Market opportunity by Type

Market opportunity by Type ($ million)
Data Table on Market opportunity by Type ($ million)

9. Market Segmentation by Application

9.1 Market segments

Chart on Application - Market share 2025-2030 (%)
Data Table on Application - Market share 2025-2030 (%)

9.2 Comparison by Application

Chart on Comparison by Application
Data Table on Comparison by Application

9.3 Private - Market size and forecast 2025-2030

Chart on Private - Market size and forecast 2025-2030 ($ million)
Data Table on Private - Market size and forecast 2025-2030 ($ million)
Chart on Private - Year-over-year growth 2025-2030 (%)
Data Table on Private - Year-over-year growth 2025-2030 (%)

9.4 Commerce - Market size and forecast 2025-2030

Chart on Commerce - Market size and forecast 2025-2030 ($ million)
Data Table on Commerce - Market size and forecast 2025-2030 ($ million)
Chart on Commerce - Year-over-year growth 2025-2030 (%)
Data Table on Commerce - Year-over-year growth 2025-2030 (%)

9.5 Market opportunity by Application

Market opportunity by Application ($ million)
Data Table on Market opportunity by Application ($ million)

10. Market Segmentation by Service Type

10.1 Market segments

Chart on Service Type - Market share 2025-2030 (%)
Data Table on Service Type - Market share 2025-2030 (%)

10.2 Comparison by Service Type

Chart on Comparison by Service Type
Data Table on Comparison by Service Type

10.3 Over-the-top - Market size and forecast 2025-2030

Chart on Over-the-top - Market size and forecast 2025-2030 ($ million)
Data Table on Over-the-top - Market size and forecast 2025-2030 ($ million)
Chart on Over-the-top - Year-over-year growth 2025-2030 (%)
Data Table on Over-the-top - Year-over-year growth 2025-2030 (%)

10.4 Satellite - Market size and forecast 2025-2030

Chart on Satellite - Market size and forecast 2025-2030 ($ million)
Data Table on Satellite - Market size and forecast 2025-2030 ($ million)
Chart on Satellite - Year-over-year growth 2025-2030 (%)
Data Table on Satellite - Year-over-year growth 2025-2030 (%)

10.5 Cable - Market size and forecast 2025-2030

Chart on Cable - Market size and forecast 2025-2030 ($ million)
Data Table on Cable - Market size and forecast 2025-2030 ($ million)
Chart on Cable - Year-over-year growth 2025-2030 (%)
Data Table on Cable - Year-over-year growth 2025-2030 (%)

10.6 Terrestrial - Market size and forecast 2025-2030

Chart on Terrestrial - Market size and forecast 2025-2030 ($ million)
Data Table on Terrestrial - Market size and forecast 2025-2030 ($ million)
Chart on Terrestrial - Year-over-year growth 2025-2030 (%)
Data Table on Terrestrial - Year-over-year growth 2025-2030 (%)

10.7 Market opportunity by Service Type

Market opportunity by Service Type ($ million)
Data Table on Market opportunity by Service Type ($ million)

11. Customer Landscape

11.1 Customer landscape overview

Analysis of price sensitivity, lifecycle, customer purchase basket, adoption rates, and purchase criteria

12. Geographic Landscape

12.1 Geographic segmentation

Chart on Market share by geography 2025-2030 (%)
Data Table on Market share by geography 2025-2030 (%)

12.2 Geographic comparison

Chart on Geographic comparison
Data Table on Geographic comparison

12.3 North America - Market size and forecast 2025-2030

Chart on North America - Market size and forecast 2025-2030 ($ million)
Data Table on North America - Market size and forecast 2025-2030 ($ million)
Chart on North America - Year-over-year growth 2025-2030 (%)
Data Table on North America - Year-over-year growth 2025-2030 (%)
Chart on Regional Comparison - North America
Data Table on Regional Comparison - North America

12.3.1 US - Market size and forecast 2025-2030

Chart on US - Market size and forecast 2025-2030 ($ million)
Data Table on US - Market size and forecast 2025-2030 ($ million)
Chart on US - Year-over-year growth 2025-2030 (%)
Data Table on US - Year-over-year growth 2025-2030 (%)

12.3.2 Canada - Market size and forecast 2025-2030

Chart on Canada - Market size and forecast 2025-2030 ($ million)
Data Table on Canada - Market size and forecast 2025-2030 ($ million)
Chart on Canada - Year-over-year growth 2025-2030 (%)
Data Table on Canada - Year-over-year growth 2025-2030 (%)

12.3.3 Mexico - Market size and forecast 2025-2030

Chart on Mexico - Market size and forecast 2025-2030 ($ million)
Data Table on Mexico - Market size and forecast 2025-2030 ($ million)
Chart on Mexico - Year-over-year growth 2025-2030 (%)
Data Table on Mexico - Year-over-year growth 2025-2030 (%)

12.4 Europe - Market size and forecast 2025-2030

Chart on Europe - Market size and forecast 2025-2030 ($ million)
Data Table on Europe - Market size and forecast 2025-2030 ($ million)
Chart on Europe - Year-over-year growth 2025-2030 (%)
Data Table on Europe - Year-over-year growth 2025-2030 (%)
Chart on Regional Comparison - Europe
Data Table on Regional Comparison - Europe

12.4.1 Germany - Market size and forecast 2025-2030

Chart on Germany - Market size and forecast 2025-2030 ($ million)
Data Table on Germany - Market size and forecast 2025-2030 ($ million)
Chart on Germany - Year-over-year growth 2025-2030 (%)
Data Table on Germany - Year-over-year growth 2025-2030 (%)

12.4.2 UK - Market size and forecast 2025-2030

Chart on UK - Market size and forecast 2025-2030 ($ million)
Data Table on UK - Market size and forecast 2025-2030 ($ million)
Chart on UK - Year-over-year growth 2025-2030 (%)
Data Table on UK - Year-over-year growth 2025-2030 (%)

12.4.3 France - Market size and forecast 2025-2030

Chart on France - Market size and forecast 2025-2030 ($ million)
Data Table on France - Market size and forecast 2025-2030 ($ million)
Chart on France - Year-over-year growth 2025-2030 (%)
Data Table on France - Year-over-year growth 2025-2030 (%)

12.4.4 Italy - Market size and forecast 2025-2030

Chart on Italy - Market size and forecast 2025-2030 ($ million)
Data Table on Italy - Market size and forecast 2025-2030 ($ million)
Chart on Italy - Year-over-year growth 2025-2030 (%)
Data Table on Italy - Year-over-year growth 2025-2030 (%)

12.4.5 Spain - Market size and forecast 2025-2030

Chart on Spain - Market size and forecast 2025-2030 ($ million)
Data Table on Spain - Market size and forecast 2025-2030 ($ million)
Chart on Spain - Year-over-year growth 2025-2030 (%)
Data Table on Spain - Year-over-year growth 2025-2030 (%)

12.4.6 The Netherlands - Market size and forecast 2025-2030

Chart on The Netherlands - Market size and forecast 2025-2030 ($ million)
Data Table on The Netherlands - Market size and forecast 2025-2030 ($ million)
Chart on The Netherlands - Year-over-year growth 2025-2030 (%)
Data Table on The Netherlands - Year-over-year growth 2025-2030 (%)

12.5 APAC - Market size and forecast 2025-2030

Chart on APAC - Market size and forecast 2025-2030 ($ million)
Data Table on APAC - Market size and forecast 2025-2030 ($ million)
Chart on APAC - Year-over-year growth 2025-2030 (%)
Data Table on APAC - Year-over-year growth 2025-2030 (%)
Chart on Regional Comparison - APAC
Data Table on Regional Comparison - APAC

12.5.1 China - Market size and forecast 2025-2030

Chart on China - Market size and forecast 2025-2030 ($ million)
Data Table on China - Market size and forecast 2025-2030 ($ million)
Chart on China - Year-over-year growth 2025-2030 (%)
Data Table on China - Year-over-year growth 2025-2030 (%)

12.5.2 Japan - Market size and forecast 2025-2030

Chart on Japan - Market size and forecast 2025-2030 ($ million)
Data Table on Japan - Market size and forecast 2025-2030 ($ million)
Chart on Japan - Year-over-year growth 2025-2030 (%)
Data Table on Japan - Year-over-year growth 2025-2030 (%)

12.5.3 India - Market size and forecast 2025-2030

Chart on India - Market size and forecast 2025-2030 ($ million)
Data Table on India - Market size and forecast 2025-2030 ($ million)
Chart on India - Year-over-year growth 2025-2030 (%)
Data Table on India - Year-over-year growth 2025-2030 (%)

12.5.4 South Korea - Market size and forecast 2025-2030

Chart on South Korea - Market size and forecast 2025-2030 ($ million)
Data Table on South Korea - Market size and forecast 2025-2030 ($ million)
Chart on South Korea - Year-over-year growth 2025-2030 (%)
Data Table on South Korea - Year-over-year growth 2025-2030 (%)

12.5.5 Australia - Market size and forecast 2025-2030

Chart on Australia - Market size and forecast 2025-2030 ($ million)
Data Table on Australia - Market size and forecast 2025-2030 ($ million)
Chart on Australia - Year-over-year growth 2025-2030 (%)
Data Table on Australia - Year-over-year growth 2025-2030 (%)

12.5.6 Indonesia - Market size and forecast 2025-2030

Chart on Indonesia - Market size and forecast 2025-2030 ($ million)
Data Table on Indonesia - Market size and forecast 2025-2030 ($ million)
Chart on Indonesia - Year-over-year growth 2025-2030 (%)
Data Table on Indonesia - Year-over-year growth 2025-2030 (%)

12.6 Middle East and Africa - Market size and forecast 2025-2030

Chart on Middle East and Africa - Market size and forecast 2025-2030 ($ million)
Data Table on Middle East and Africa - Market size and forecast 2025-2030 ($ million)
Chart on Middle East and Africa - Year-over-year growth 2025-2030 (%)
Data Table on Middle East and Africa - Year-over-year growth 2025-2030 (%)
Chart on Regional Comparison - Middle East and Africa
Data Table on Regional Comparison - Middle East and Africa

12.6.1 Saudi Arabia - Market size and forecast 2025-2030

Chart on Saudi Arabia - Market size and forecast 2025-2030 ($ million)
Data Table on Saudi Arabia - Market size and forecast 2025-2030 ($ million)
Chart on Saudi Arabia - Year-over-year growth 2025-2030 (%)
Data Table on Saudi Arabia - Year-over-year growth 2025-2030 (%)

12.6.2 UAE - Market size and forecast 2025-2030

Chart on UAE - Market size and forecast 2025-2030 ($ million)
Data Table on UAE - Market size and forecast 2025-2030 ($ million)
Chart on UAE - Year-over-year growth 2025-2030 (%)
Data Table on UAE - Year-over-year growth 2025-2030 (%)

12.6.3 South Africa - Market size and forecast 2025-2030

Chart on South Africa - Market size and forecast 2025-2030 ($ million)
Data Table on South Africa - Market size and forecast 2025-2030 ($ million)
Chart on South Africa - Year-over-year growth 2025-2030 (%)
Data Table on South Africa - Year-over-year growth 2025-2030 (%)

12.6.4 Israel - Market size and forecast 2025-2030

Chart on Israel - Market size and forecast 2025-2030 ($ million)
Data Table on Israel - Market size and forecast 2025-2030 ($ million)
Chart on Israel - Year-over-year growth 2025-2030 (%)
Data Table on Israel - Year-over-year growth 2025-2030 (%)

12.6.5 Turkey - Market size and forecast 2025-2030

Chart on Turkey - Market size and forecast 2025-2030 ($ million)
Data Table on Turkey - Market size and forecast 2025-2030 ($ million)
Chart on Turkey - Year-over-year growth 2025-2030 (%)
Data Table on Turkey - Year-over-year growth 2025-2030 (%)

12.7 South America - Market size and forecast 2025-2030

Chart on South America - Market size and forecast 2025-2030 ($ million)
Data Table on South America - Market size and forecast 2025-2030 ($ million)
Chart on South America - Year-over-year growth 2025-2030 (%)
Data Table on South America - Year-over-year growth 2025-2030 (%)
Chart on Regional Comparison - South America
Data Table on Regional Comparison - South America

12.7.1 Brazil - Market size and forecast 2025-2030

Chart on Brazil - Market size and forecast 2025-2030 ($ million)
Data Table on Brazil - Market size and forecast 2025-2030 ($ million)
Chart on Brazil - Year-over-year growth 2025-2030 (%)
Data Table on Brazil - Year-over-year growth 2025-2030 (%)

12.7.2 Argentina - Market size and forecast 2025-2030

Chart on Argentina - Market size and forecast 2025-2030 ($ million)
Data Table on Argentina - Market size and forecast 2025-2030 ($ million)
Chart on Argentina - Year-over-year growth 2025-2030 (%)
Data Table on Argentina - Year-over-year growth 2025-2030 (%)

12.7.3 Chile - Market size and forecast 2025-2030

Chart on Chile - Market size and forecast 2025-2030 ($ million)
Data Table on Chile - Market size and forecast 2025-2030 ($ million)
Chart on Chile - Year-over-year growth 2025-2030 (%)
Data Table on Chile - Year-over-year growth 2025-2030 (%)

12.8 Market opportunity by geography

Market opportunity by geography ($ million)
Data Tables on Market opportunity by geography ($ million)

13. Drivers, Challenges, and Opportunity

13.1 Market drivers

Heightened demand for encoders to support multiple broadcasting formats
Transition from analog to digital broadcasting
Increasing number of smartphones and internet users

13.2 Market challenges

Increase in cases of cyberattacks
High infrastructure cost and complex deployment requirements
Stringent rules and regulations by FCC

13.3 Impact of drivers and challenges

Impact of drivers and challenges in 2025 and 2030

13.4 Market opportunities

Increased application of AI, deep learning, and machine learning technologies
Rising adoption of cloud-based services
Growing preference for video-on-demand (VOD) services

14. Competitive Landscape

14.1 Overview

14.2

Overview on criticality of inputs and factors of differentiation

14.3 Landscape disruption

Overview on factors of disruption

14.4 Industry risks

Impact of key risks on business

15. Competitive Analysis

15.1 Companies profiled

Companies covered

15.2 Company ranking index

15.3 Market positioning of companies

Matrix on companies position and classification

15.4 ARRI AG

ARRI AG - Overview
ARRI AG - Product / Service
ARRI AG - Key offerings
SWOT

15.5 Blackmagic Design Pty. Ltd.

Blackmagic Design Pty. Ltd. - Overview
Blackmagic Design Pty. Ltd. - Product / Service
Blackmagic Design Pty. Ltd. - Key offerings
SWOT

15.6 Canon Inc.

Canon Inc. - Overview
Canon Inc. - Business segments
Canon Inc. - Key offerings
Canon Inc. - Segment focus
SWOT

15.7 Cisco Systems Inc.

Cisco Systems Inc. - Overview
Cisco Systems Inc. - Business segments
Cisco Systems Inc. - Key news
Cisco Systems Inc. - Key offerings
Cisco Systems Inc. - Segment focus
SWOT

15.8 Evertz Technologies Ltd.

Evertz Technologies Ltd. - Overview
Evertz Technologies Ltd. - Product / Service
Evertz Technologies Ltd. - Key offerings
SWOT

15.9 Grass Valley Canada

Grass Valley Canada - Overview
Grass Valley Canada - Product / Service
Grass Valley Canada - Key offerings
SWOT

15.10 Haivision Systems Inc.

Haivision Systems Inc. - Overview
Haivision Systems Inc. - Product / Service
Haivision Systems Inc. - Key offerings
SWOT

15.11 Harmonic Inc.

Harmonic Inc. - Overview
Harmonic Inc. - Business segments
Harmonic Inc. - Key offerings
Harmonic Inc. - Segment focus
SWOT

15.12 Imagine Communications.

Imagine Communications. - Overview
Imagine Communications. - Product / Service
Imagine Communications. - Key offerings
SWOT

15.13 Matrox Electronic Systems Ltd.

Matrox Electronic Systems Ltd. - Overview
Matrox Electronic Systems Ltd. - Product / Service
Matrox Electronic Systems Ltd. - Key offerings
SWOT

15.14 Panasonic Holdings Corp.

Panasonic Holdings Corp. - Overview
Panasonic Holdings Corp. - Business segments
Panasonic Holdings Corp. - Key news
Panasonic Holdings Corp. - Key offerings
Panasonic Holdings Corp. - Segment focus
SWOT

15.15 Roland Corp.

Roland Corp. - Overview
Roland Corp. - Product / Service
Roland Corp. - Key offerings
SWOT

15.16 Ross Video Ltd.

Ross Video Ltd. - Overview
Ross Video Ltd. - Product / Service
Ross Video Ltd. - Key offerings
SWOT

15.17 Sony Group Corp.

Sony Group Corp. - Overview
Sony Group Corp. - Business segments
Sony Group Corp. - Key news
Sony Group Corp. - Key offerings
Sony Group Corp. - Segment focus
SWOT

15.18 Wellav Technologies Ltd.

Wellav Technologies Ltd. - Overview
Wellav Technologies Ltd. - Product / Service
Wellav Technologies Ltd. - Key offerings
SWOT

16. Appendix

16.1 Scope of the report

Market definition
Objectives
Notes and caveats

16.2 Inclusions and exclusions checklist

Inclusions checklist
Exclusions checklist

16.3 Currency conversion rates for US$

16.4 Research methodology

16.5 Data procurement

Information sources

16.6 Data validation

16.7 Validation techniques employed for market sizing

16.8 Data synthesis

16.9 360 degree market analysis

16.10 List of abbreviations

Research Methodology

Technavio presents a detailed picture of the market by way of study, synthesis, and summation of data from multiple sources. The analysts have presented the various facets of the market with a particular focus on identifying the key industry influencers. The data thus presented is comprehensive, reliable, and the result of extensive research, both primary and secondary.

INFORMATION SOURCES

Primary sources

  • Manufacturers and suppliers
  • Channel partners
  • Industry experts
  • Strategic decision makers

Secondary sources

  • Industry journals and periodicals
  • Government data
  • Financial reports of key industry players
  • Historical data
  • Press releases

DATA ANALYSIS

Data Synthesis

  • Collation of data
  • Estimation of key figures
  • Analysis of derived insights

Data Validation

  • Triangulation with data models
  • Reference against proprietary databases
  • Corroboration with industry experts

REPORT WRITING

Qualitative

  • Market drivers
  • Market challenges
  • Market trends
  • Five forces analysis

Quantitative

  • Market size and forecast
  • Market segmentation
  • Geographical insights
  • Competitive landscape

Interested in this report?

Get your sample now to see our research methodology and insights!

Download Now

Frequently Asked Questions

Video Streaming And Broadcasting Equipment market growth will increase by USD 382763.9 million during 2026-2030.

The Video Streaming And Broadcasting Equipment market is expected to grow at a CAGR of 17.3% during 2026-2030.

Video Streaming And Broadcasting Equipment market is segmented by Type (Video streaming, Broadcasting equipment) Application (Private, Commerce) Service type (Over-the-top, Satellite, Cable, Terrestrial)

ARRI AG, Blackmagic Design Pty. Ltd., Canon Inc., Cisco Systems Inc., Epiphan Systems Inc., Evertz Technologies Ltd., EVS Broadcast Equipment S.A., Grass Valley Canada, Haivision Systems Inc., Harmonic Inc., Imagine Communications., Magewell Electronics Co. Ltd., Matrox Electronic Systems Ltd., Panasonic Holdings Corp., PTZOptics, Roland Corp., Ross Video Ltd., Sony Group Corp., Teradek, Wellav Technologies Ltd. are a few of the key vendors in the Video Streaming And Broadcasting Equipment market.

North America will register the highest growth rate of 44.5% among the other regions. Therefore, the Video Streaming And Broadcasting Equipment market in North America is expected to garner significant business opportunities for the vendors during the forecast period.

US, Canada, Mexico, Germany, UK, France, Italy, Spain, The Netherlands, China, Japan, India, South Korea, Australia, Indonesia, Saudi Arabia, UAE, South Africa, Israel, Turkey, Brazil, Argentina, Chile

  • Heightened demand for encoders to support multiple broadcasting formats is the driving factor this market.

The Video Streaming And Broadcasting Equipment market vendors should focus on grabbing business opportunities from the Type segment as it accounted for the largest market share in the base year.
RIA - Research AI Assistant
Ask RIA