
Video Streaming Market Size 2025-2029
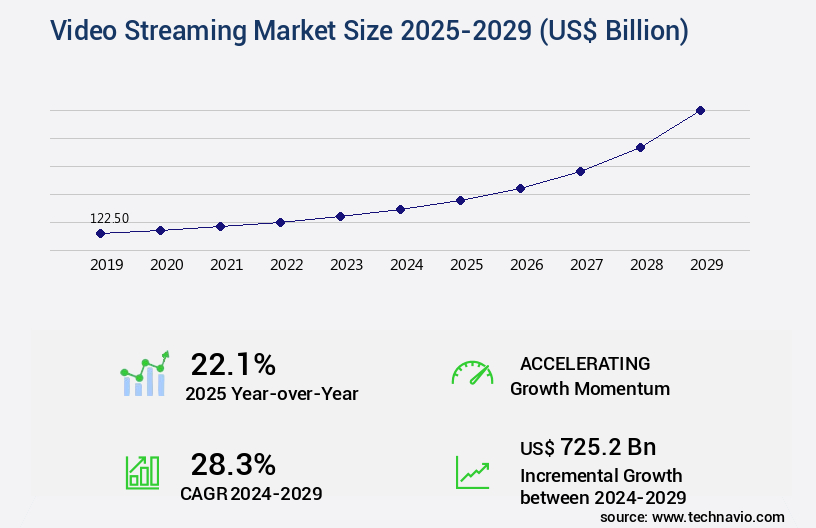
The video streaming market size is valued to increase USD 725.2 billion, at a CAGR of 28.3% from 2024 to 2029. Heightened demand for encoders to support multiple broadcasting formats will drive the video streaming market.
Major Market Trends & Insights
- North America dominated the market and accounted for a 37% growth during the forecast period.
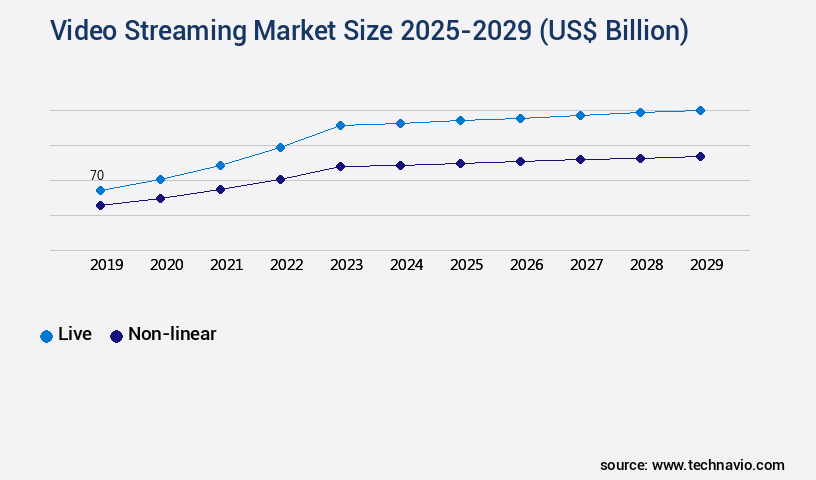
- By Type - Live segment was valued at USD 70.00 billion in 2023
- By Deployment - Cloud segment accounted for the largest market revenue share in 2023
Market Size & Forecast
- Market Opportunities: USD 731.10 billion
- Market Future Opportunities: USD 725.20 billion
- CAGR : 28.3%
- North America: Largest market in 2023
Market Summary
- The market is a dynamic and continually evolving industry, driven by advancements in core technologies and applications. With heightened demand for encoders that support multiple broadcasting formats, the market is witnessing significant growth in the adoption of technologies such as artificial intelligence (AI), deep learning (DL), and machine learning (ML). According to recent reports, the global AI in video analytics market is projected to reach a value of 13.42 billion USD by 2027, growing at a compound annual growth rate (CAGR) of 21.3% during the forecast period.
- However, this market expansion is not without challenges. Growing privacy and security concerns are becoming increasingly important, necessitating robust solutions to protect user data and prevent unauthorized access. Despite these challenges, the market presents numerous opportunities for innovation and growth, particularly in areas such as personalized content recommendations and advanced video analytics.
What will be the Size of the Video Streaming Market during the forecast period?
Get Key Insights on Market Forecast (PDF) Request Free Sample
How is the Video Streaming Market Segmented and what are the key trends of market segmentation?
The video streaming industry research report provides comprehensive data (region-wise segment analysis), with forecasts and estimates in "USD billion" for the period 2025-2029, as well as historical data from 2019-2023 for the following segments.
- Type
- Live
- Non-linear
- Deployment
- Cloud
- On-premises
- Platform
- Smartphones and tablets
- Smart TV
- Laptops and desktops
- Gaming consoles
- End-user
- Individual users
- Enterprises
- Educational institutions
- Geography
- North America
- US
- Canada
- Europe
- France
- Germany
- UK
- APAC
- China
- India
- Japan
- South Korea
- South America
- Brazil
- Rest of World (ROW)
- North America
By Type Insights
The live segment is estimated to witness significant growth during the forecast period.
The market experienced significant growth in 2024, with the live video streaming segment leading the way. This trend is driven by the rising popularity of streaming services across various sectors, including media and entertainment, esports, events, and education. High-speed internet and mobile devices have made live content more accessible, leading to increased consumer engagement. Major platforms like YouTube, Facebook, and Twitch dominate this landscape, particularly among younger audiences. Businesses have also embraced live streaming for marketing, product launches, and customer interaction, boosting brand visibility. Players in this market employ advanced technologies to ensure optimal user experience.
Network congestion control, video compression algorithms, and video encoding codecs are crucial in delivering high-quality streams. Multi-bitrate encoding and client-side ad insertion enable seamless streaming across various devices and bandwidths. Dynamic adaptive streaming and streaming media servers adapt to changing network conditions, ensuring uninterrupted playback. User experience monitoring, playback buffer management, and DRM encryption methods ensure content security and maintain viewer satisfaction. Peer-to-peer streaming and edge computing deployments improve efficiency and reduce latency. Video quality assessment and streaming analytics dashboards provide valuable insights for content providers. Digital rights management, bandwidth optimization, and video delivery infrastructure are essential components of the video streaming ecosystem.
Server-side ad insertion and content delivery networks streamline content distribution and monetization. Metadata tagging standards facilitate content discovery and organization. Live stream broadcasting and low-latency streaming cater to real-time requirements. Adaptive bitrate streaming and video streaming protocols optimize streaming based on network conditions. Media asset management, video transcoding pipelines, video player technology, and http live streaming are integral to the video streaming value chain. Major players in the market include industry leaders like Amazon and Netflix Inc., who continually innovate to meet evolving consumer demands and expectations. The market's continuous growth is fueled by advancements in technology, increasing consumer adoption, and the expanding use cases across various sectors.
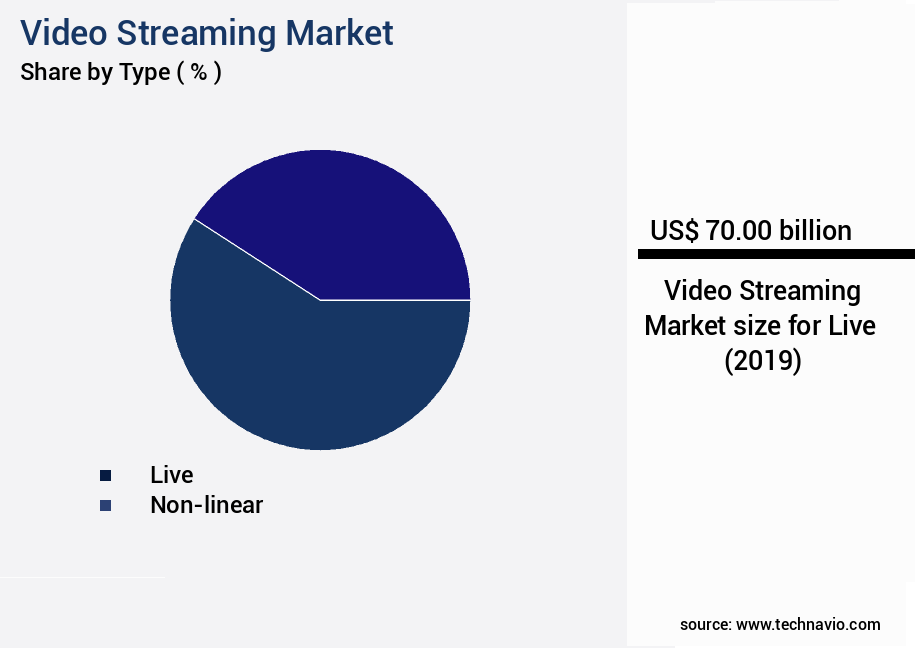
The Live segment was valued at USD 70.00 billion in 2019 and showed a gradual increase during the forecast period.
Regional Analysis
North America is estimated to contribute 37% to the growth of the global market during the forecast period.Technavio’s analysts have elaborately explained the regional trends and drivers that shape the market during the forecast period.

See How Video Streaming Market Demand is Rising in North America Request Free Sample
The market in North America has experienced substantial growth over the last decade, fueled by advancements in technology, expanding internet penetration, and evolving consumer preferences. By 2025, this region held the largest market share, primarily due to the widespread adoption of cloud-based streaming services. As of now, the industry is marked by a multitude of service providers catering to diverse market segments.
Factors such as content type, demographics, and delivery platforms influence their target audiences. For instance, in early 2025, Amazon Web Services (AWS) announced plans to invest approximately USD11 billion to enhance their infrastructure in Georgia, underscoring their commitment to the sector's ongoing growth.
Market Dynamics
Our researchers analyzed the data with 2024 as the base year, along with the key drivers, trends, and challenges. A holistic analysis of drivers will help companies refine their marketing strategies to gain a competitive advantage.
The market is experiencing robust growth, driven by advancements in technology and increasing consumer demand for high-quality, on-demand video content. HLS adaptive bitrate for live streaming and DASH manifest file generation process have revolutionized the way video is delivered to viewers, ensuring seamless playback even in dynamic environments. VP9 encoding for low-bandwidth delivery and HEVC compression for high-resolution video have become industry standards, while the implementation of the AV1 codec in video players offers further efficiency and cost savings. MSE video playback in web browsers and EME DRM integration for content protection ensure optimal user experience and security.
CDN performance tuning is crucial for delivering video content globally, with the industrial application segment accounting for a significantly larger share than the academic segment due to its vast user base and real-time requirements. Video quality metrics and their interpretation, latency measurement tools for real-time streaming, and bit rate adaptation strategies for dynamic environments are essential for maintaining optimal performance and user engagement. Buffer underrun prevention techniques and segment duration control are crucial for seamless playback, while manifest file generation and its impact on playback efficiency cannot be overlooked. Playback error handling and user experience are key differentiators for video streaming services, with a minority of players, less than 15%, dominating the market through customized video players that offer advanced branding and functionality.
Bandwidth usage patterns in video streaming applications continue to evolve, making content delivery optimization a top priority for market leaders. Secure video delivery using DRM encryption is a critical aspect of the market, with the majority of new product developments focusing on enhancing security features to meet the growing demand for protected content. As the market continues to expand, the ability to analyze user engagement using video streaming data and optimize content delivery for global reach will be essential for maintaining a competitive edge.
What are the key market drivers leading to the rise in the adoption of Video Streaming Industry?
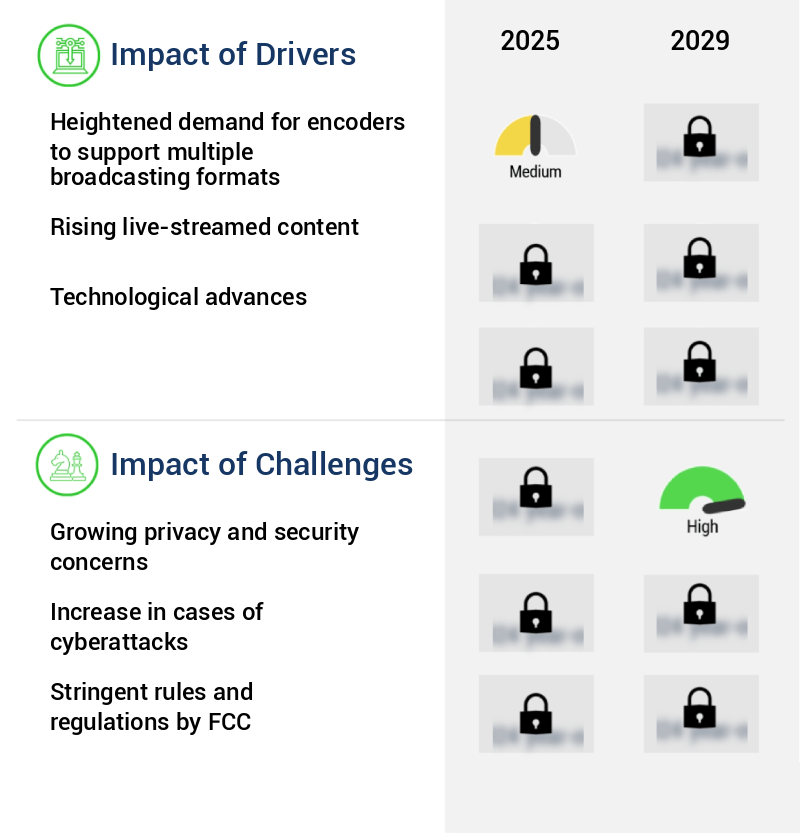
- The escalating requirement for encoders capable of handling multiple broadcasting formats is the primary market driver.
- Encoders play a pivotal role in the broadcasting industry, converting input signals into optimized coded outputs. These combinational logic circuits support various media formats, including audio, video, and images. Video streaming platforms have gained popularity, delivering content over the Internet without cable technology. To enhance subscriber experience, broadcasters employ video encoders for superior video quality. The surge in Over-The-Top (OTT) content viewership has intensified the demand for encoders in broadcasting applications.
- Encoders enable remote production, operation, and live production from the cloud for the sports, media, and entertainment industry. The continuous evolution of media consumption patterns underscores the importance of encoders in adapting to diverse formats and technologies.
What are the market trends shaping the Video Streaming Industry?
- The application of artificial intelligence (AI), deep learning (DL), and machine learning (ML) technologies is becoming increasingly prevalent in the market. This trend signifies a significant shift towards advanced automation and data analysis.
- The video streaming industry is experiencing a significant transformation through the integration of advanced technologies like artificial intelligence (AI), blockchain, deep learning, and natural language processing (NLP). AI is increasingly being utilized for various aspects of video production, including scoring, editing, cinematography, scriptwriting, and voice-overs. Several industry players are leveraging AI to improve content quality and enhance user experience. The continuous expansion of online streaming services across diverse media platforms, such as YouTube and Netflix, is projected to fuel market growth.
- For instance, Facebook and other platforms are employing AI to regulate and remove offensive content. The application of these technologies is expected to create numerous opportunities for the video streaming industry, contributing to its ongoing evolution and growth. The integration of AI in video production and content moderation underscores the industry's commitment to delivering high-quality, engaging, and safe content to users.
What challenges does the Video Streaming Industry face during its growth?
- The expansion of privacy and security concerns poses a significant challenge to the industry's growth. This issue, which is of paramount importance, necessitates robust solutions to safeguard data and protect consumer trust.
- The smartphone market is witnessing a significant shift in user expectations and regulatory requirements, particularly in the realm of video streaming applications. These apps often request extensive access to users' smartphones, including location and storage, to deliver personalized content and notifications. However, the sale of this data by some companies has raised privacy concerns, leading to stringent regulations. For instance, the European Union's General Data Protection Regulation (GDPR) and the California Consumer Privacy Act (CCPA) empower users to monitor and control their personal information and set guidelines for its collection and usage.
- This evolving regulatory landscape poses challenges for video streaming companies while ensuring user privacy. Additionally, the increasing adoption of ad-free subscription models and the rise of localized content offerings are shaping the market dynamics.
Exclusive Technavio Analysis on Customer Landscape
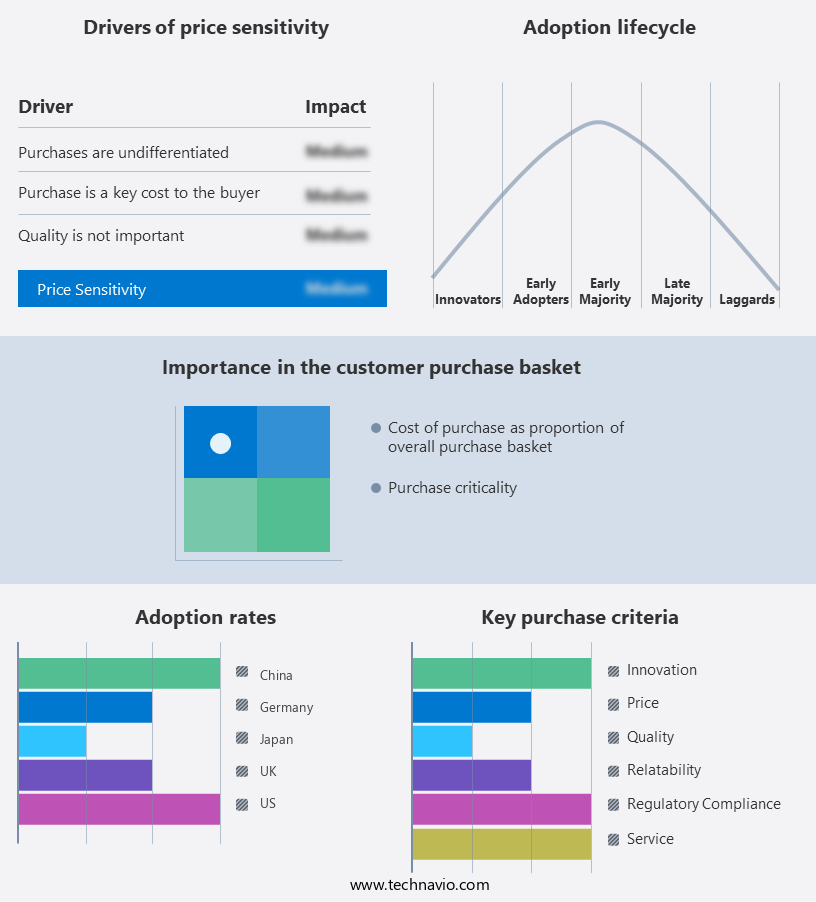
The video streaming market forecasting report includes the adoption lifecycle of the market, covering from the innovator’s stage to the laggard’s stage. It focuses on adoption rates in different regions based on penetration. Furthermore, the video streaming market report also includes key purchase criteria and drivers of price sensitivity to help companies evaluate and develop their market growth analysis strategies.
Customer Landscape of Video Streaming Industry
Competitive Landscape
Companies are implementing various strategies, such as strategic alliances, video streaming market forecast, partnerships, mergers and acquisitions, geographical expansion, and product/service launches, to enhance their presence in the industry.
AGILE CONTENT SA - This company provides comprehensive video streaming solutions through offerings such as management, delivery, and advertising tech suites. The management suite facilitates content organization and distribution, while the delivery suite ensures seamless video delivery. The advertising tech suite optimizes ad revenue through data-driven targeting and analytics.
The industry research and growth report includes detailed analyses of the competitive landscape of the market and information about key companies, including:
- AGILE CONTENT SA
- Akamai Technologies Inc.
- Amazon.com Inc.
- Apple Inc.
- Brightcove Inc.
- Cisco Systems Inc.
- Dacast Inc.
- Enghouse Systems Ltd.
- Google LLC
- Haivision Systems Inc.
- International Business Machines Corp.
- Kaltura Inc.
- MediaPlatform Inc.
- Netflix Inc.
- Panopto Inc.
- Sonic Foundry Inc.
- SproutVideo LLC
- The Walt Disney Co.
- VBrick
- Wowza Media Systems LLC
Qualitative and quantitative analysis of companies has been conducted to help clients understand the wider business environment as well as the strengths and weaknesses of key industry players. Data is qualitatively analyzed to categorize companies as pure play, category-focused, industry-focused, and diversified; it is quantitatively analyzed to categorize companies as dominant, leading, strong, tentative, and weak.
Recent Development and News in Video Streaming Market
- In January 2024, Disney+ announced the launch of its ad-supported subscription tier, making its streaming service more accessible and affordable to a broader audience (Disney Press Release). In March 2024, Amazon Prime Video and MGM Studios signed a deal to merge their content libraries, expanding Amazon's film and TV catalog significantly (Amazon Press Release). In April 2025, Netflix secured a strategic partnership with Microsoft to enhance its streaming technology using Azure AI and improve personalized recommendations (Netflix Investor Relations). In May 2025, HBO Max expanded its reach to over 60 countries, marking a significant geographic expansion for the streaming giant (WarnerMedia Press Release).
Dive into Technavio’s robust research methodology, blending expert interviews, extensive data synthesis, and validated models for unparalleled Video Streaming Market insights. See full methodology.
|
Market Scope |
|
|
Report Coverage |
Details |
|
Page number |
233 |
|
Base year |
2024 |
|
Historic period |
2019-2023 |
|
Forecast period |
2025-2029 |
|
Growth momentum & CAGR |
Accelerate at a CAGR of 28.3% |
|
Market growth 2025-2029 |
USD 725.2 billion |
|
Market structure |
Fragmented |
|
YoY growth 2024-2025(%) |
22.1 |
|
Key countries |
US, China, UK, Germany, Canada, Japan, France, India, Brazil, and South Korea |
|
Competitive landscape |
Leading Companies, Market Positioning of Companies, Competitive Strategies, and Industry Risks |
Research Analyst Overview
- In the ever-evolving world of video streaming, several key technologies and strategies have emerged to ensure optimal user experience and efficient content delivery. One such area of focus is network congestion control, which ensures that video streams maintain a consistent quality despite fluctuations in network conditions. Video compression algorithms, such as H.264 and H.265, are essential for reducing the amount of data required for video transmission. Video encoding codecs, like AVC and HEVC, further enhance compression efficiency. Multi-bitrate encoding enables adaptability to varying network conditions, while client-side ad insertion offers flexibility in monetization strategies. Dynamic adaptive streaming, a critical component of modern video delivery infrastructure, adjusts video quality based on network conditions and user preferences.
- Streaming media servers and CDN caching strategies optimize content delivery, ensuring minimal latency and improved user experience. User experience monitoring and playback buffer management are crucial for maintaining viewer engagement. DRM encryption methods secure content, while peer-to-peer streaming and edge computing deployments enhance scalability. Video quality assessment and streaming analytics dashboards provide valuable insights for content providers, enabling data-driven decision-making. Bandwidth optimization and server-side ad insertion further enhance the efficiency of video delivery, while content delivery networks and metadata tagging standards facilitate seamless content discovery and access. Live stream broadcasting and low-latency streaming cater to real-time content demands, with adaptive bitrate streaming ensuring uninterrupted playback.
- Video streaming protocols, such as RTMP and HLS, play a pivotal role in ensuring smooth video delivery, while media asset management and video transcoding pipelines facilitate content preparation and distribution. Video player technology continues to evolve, offering advanced features like HTTP live streaming and streaming protocol selection. In summary, the market is characterized by continuous innovation and adaptation to meet evolving user demands and technological advancements. From network congestion control to video encoding codecs, these technologies and strategies are essential for delivering high-quality video content to audiences across the globe.
What are the Key Data Covered in this Video Streaming Market Research and Growth Report?
-
What is the expected growth of the Video Streaming Market between 2025 and 2029?
-
USD 725.2 billion, at a CAGR of 28.3%
-
-
What segmentation does the market report cover?
-
The report segmented by Type (Live and Non-linear), Deployment (Cloud and On-premises), Platform (Smartphones and tablets, Smart TV, Laptops and desktops, and Gaming consoles), End-user (Individual users, Enterprises, and Educational institutions), and Geography (North America, APAC, Europe, South America, and Middle East and Africa)
-
-
Which regions are analyzed in the report?
-
North America, APAC, Europe, South America, and Middle East and Africa
-
-
What are the key growth drivers and market challenges?
-
Heightened demand for encoders to support multiple broadcasting formats, Growing privacy and security concerns
-
-
Who are the major players in the Video Streaming Market?
-
Key Companies AGILE CONTENT SA, Akamai Technologies Inc., Amazon.com Inc., Apple Inc., Brightcove Inc., Cisco Systems Inc., Dacast Inc., Enghouse Systems Ltd., Google LLC, Haivision Systems Inc., International Business Machines Corp., Kaltura Inc., MediaPlatform Inc., Netflix Inc., Panopto Inc., Sonic Foundry Inc., SproutVideo LLC, The Walt Disney Co., VBrick, and Wowza Media Systems LLC
-
Market Research Insights
- The market continues to evolve, with key technologies shaping its landscape. Two significant aspects are EME DMR integration and content delivery costs. EME DMR (Encrypted Media Extensions Digital Rights Management) integration ensures secure video delivery, safeguarding content from unauthorized access. In contrast, content delivery costs have risen due to factors like HLS adaptive bitrate and DASH streaming protocols, which optimize video playback for various devices and networks. Moreover, manifest file generation, MSE video playback, and playback error handling contribute to content delivery optimization. Latency measurement tools and network reliability analysis further enhance the user experience by minimizing buffering issues.
- Secure video delivery and metadata management systems maintain content security and accessibility. Hevc video compression and Av1 video codec offer improved video quality metrics, reducing bandwidth usage patterns. Advertising integration and user engagement analysis are essential for monetization, while CDN performance tuning and media storage solutions ensure efficient content delivery. Live event streaming and segment duration control offer flexibility to broadcasters, with bit rate adaptation addressing network inconsistencies.
We can help! Our analysts can customize this video streaming market research report to meet your requirements.
 RIA -
RIA - 
