Virtual Assistant Market Analysis, Size, and Forecast 2026-2030: North America (US, Canada, and Mexico), APAC (China, Japan, and India), Europe (Germany, UK, and France), South America (Brazil and Argentina), Middle East and Africa (Saudi Arabia, UAE, and South Africa), and Rest of World (ROW)

Virtual Assistant Market Analysis, Size, and Forecast 2026-2030:
North America (US, Canada, and Mexico), APAC (China, Japan, and India), Europe (Germany, UK, and France), South America (Brazil and Argentina), Middle East and Africa (Saudi Arabia, UAE, and South Africa), and Rest of World (ROW)

Published: Mar 2026 298 Pages SKU: IRTNTR70433

Market Overview at a Glance

$394.68 B
Market Opportunity
87.2%
CAGR 2025 - 2030
38.7%
North America Growth
$9.10 B
Spoken commands segment 2024

Virtual Assistant Market Size 2026-2030

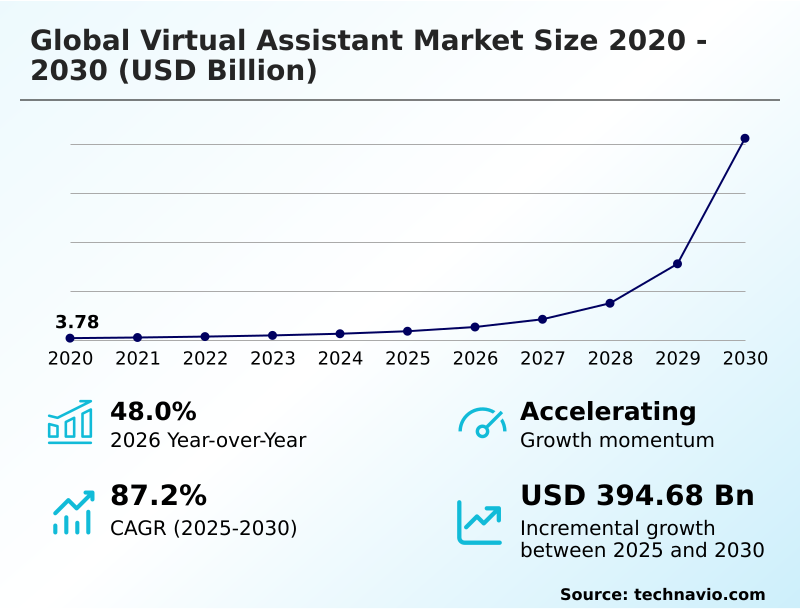
The virtual assistant market size is valued to increase by USD 394.68 billion, at a CAGR of 87.2% from 2025 to 2030. Demand for enhanced customer service will drive the virtual assistant market.

Major Market Trends & Insights

  • North America dominated the market and accounted for a 38.7% growth during the forecast period.
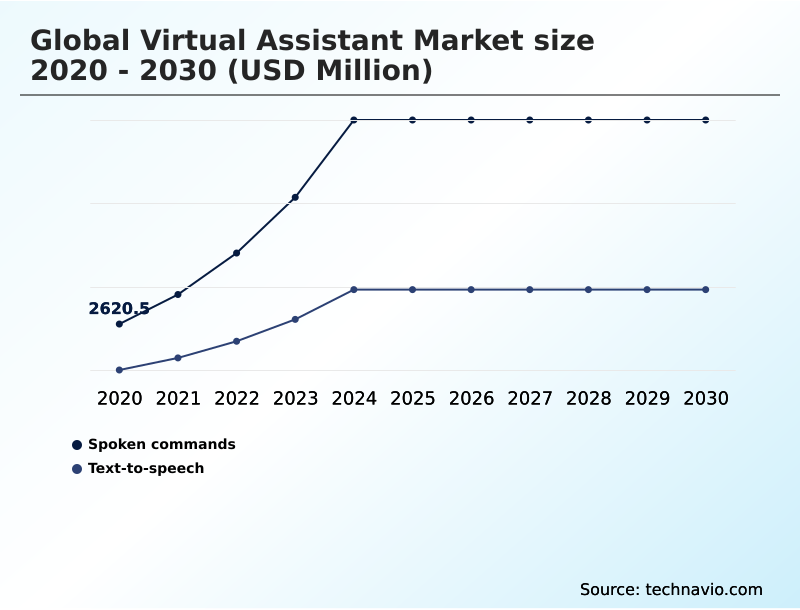
  • By Type - Spoken commands segment was valued at USD 9.10 billion in 2024
  • By End-user - Automotive segment accounted for the largest market revenue share in 2024

Market Size & Forecast

  • Market Opportunities: USD 408.85 billion
  • Market Future Opportunities: USD 394.68 billion
  • CAGR from 2025 to 2030 : 87.2%

Market Summary

  • The virtual assistant market is undergoing a significant transformation, moving beyond simple command execution to become a cornerstone of intelligent automation. This evolution is driven by advances in conversational AI and sophisticated machine learning models, which enable systems to deliver contextual and proactive support.
  • Enterprises are leveraging AI assistants for enterprise for comprehensive task automation, from managing internal workflows with intelligent document processing to enhancing AI-driven customer engagement on conversational commerce platforms. For example, in logistics, these tools can automate supply chain communications, predict shipping delays, and manage inventory documentation, significantly improving operational resilience.
  • However, this rapid adoption introduces challenges related to data privacy and the need for seamless integration with legacy systems. The market's trajectory is defined by the balance between harnessing the power of automated customer support and ensuring robust, secure, and ethically governed AI frameworks.

What will be the Size of the Virtual Assistant Market during the forecast period?

Get Key Insights on Market Forecast (PDF) Request Free Sample

How is the Virtual Assistant Market Segmented?

The virtual assistant industry research report provides comprehensive data (region-wise segment analysis), with forecasts and estimates in "USD million" for the period 2026-2030, as well as historical data from 2020-2024 for the following segments.

  • Type
    • Spoken commands
    • Text-to-speech
  • End-user
    • Automotive
    • BFSI
    • Government
    • Retail
    • Others
  • Product type
    • Chatbots
    • Smart speakers
  • Geography
    • North America
      • US
      • Canada
      • Mexico
    • APAC
      • China
      • Japan
      • India
    • Europe
      • Germany
      • UK
      • France
    • South America
      • Brazil
      • Argentina
    • Middle East and Africa
      • Saudi Arabia
      • UAE
      • South Africa
    • Rest of World (ROW)

By Type Insights

The spoken commands segment is estimated to witness significant growth during the forecast period.

The spoken commands segment is evolving through the integration of agentic AI, which is shifting human-computer interaction from simple instructions to complex, conversational workflows.

Advanced natural language understanding and sophisticated voice user interface (VUI) design are central to this change, enabling in-car virtual assistants and voice-enabled IoT devices to perform nuanced tasks.

This transition is supported by advancements in edge computing, which ensures low-latency responsiveness.

In applications for AI for contact center automation, these systems improve operational efficiency and user trust by reducing interaction times by up to 30%, which is particularly critical in hands-free environments.

The market is defined by this continuous move toward more intuitive and autonomous voice-activated experiences.

Request Free Sample

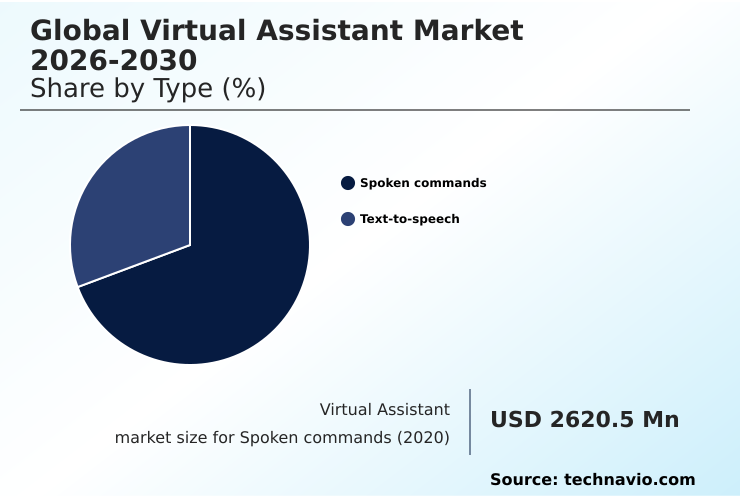
The Spoken commands segment was valued at USD 9.10 billion in 2024 and showed a gradual increase during the forecast period.

Request Free Sample

Regional Analysis

North America is estimated to contribute 38.7% to the growth of the global market during the forecast period.Technavio’s analysts have elaborately explained the regional trends and drivers that shape the market during the forecast period.

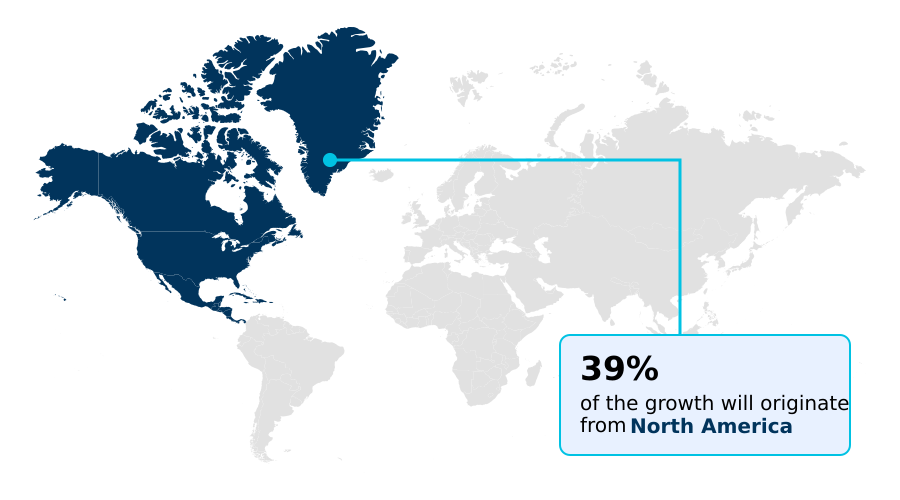
See How Virtual Assistant Market Demand is Rising in North America Request Free Sample

The geographic landscape of the market is intensely competitive, with North America and APAC collectively representing over 76% of the incremental growth opportunities.

North America's dominance is sustained by early adoption of deep learning and large language models (LLMs) for generative AI applications. Meanwhile, APAC is the fastest-growing territory, driven by mobile-first economies and significant investments in AI for workforce optimization.

AI-powered personalization and the proliferation of voice-activated systems and smart home control systems are key trends in both regions.

The United States remains the single largest market, while countries like India and China are rapidly closing the gap by leveraging their vast digital consumer bases and fostering local innovation in AI infrastructure.

Market Dynamics

Our researchers analyzed the data with 2025 as the base year, along with the key drivers, trends, and challenges. A holistic analysis of drivers will help companies refine their marketing strategies to gain a competitive advantage.

  • Analyzing the virtual assistant market reveals distinct operational benefits and challenges across different applications. A key debate involves spoken commands versus text-to-speech efficiency, where user context and environment dictate the optimal interface. In corporate settings, enterprise chatbot integration challenges persist, often related to connecting with legacy systems and ensuring data security.
  • The rise of LLM applications in customer service is revolutionizing support, enabling more natural and effective interactions. Simultaneously, generative AI for retail personalization is creating new revenue streams by tailoring shopping experiences with high precision. Businesses evaluating AI-driven task automation ROI are finding that success hinges on strategic implementation, as outcomes can vary significantly.
  • For instance, the use of voice biometrics security in banking offers enhanced protection but requires careful user adoption strategies. Similarly, achieving true contextual awareness in healthcare AI is critical for diagnostic accuracy. The expansion into global markets underscores the importance of NLP for multilingual customer support and proactive assistance in smart homes for enhancing user convenience.
  • For complex enterprise needs, the focus is shifting toward agentic AI for complex workflows, which promises greater autonomy. The user experience of a multimodal interface and the insights from sentiment analysis for brand reputation are also crucial.
  • Predictive analytics in e-commerce can boost sales, while automated workflow for smes and intelligent automation in supply chain operations can reduce manual processing times by over 40% compared to traditional methods.

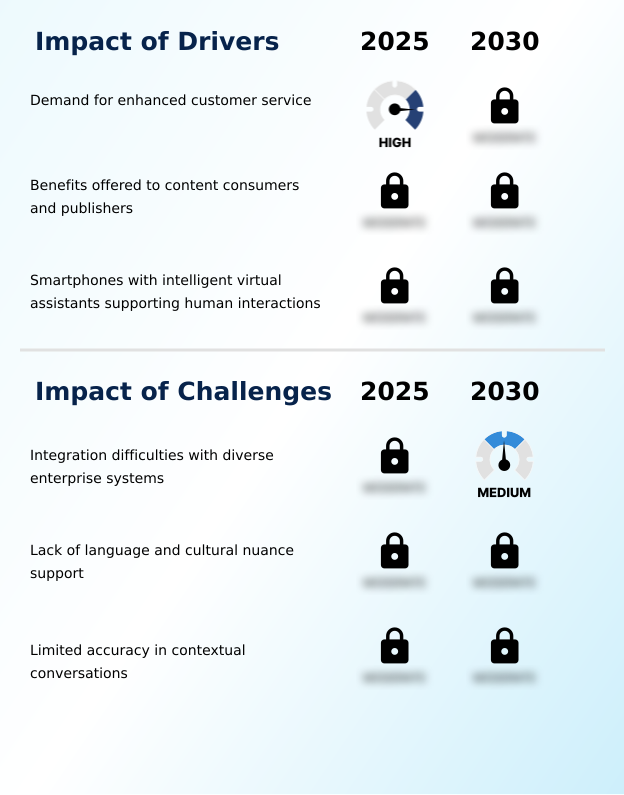
What are the key market drivers leading to the rise in the adoption of Virtual Assistant Industry?

  • The growing demand for enhanced customer service across multiple industries serves as a key driver for market expansion.

  • Market growth is primarily propelled by the enterprise need for scalable and efficient automated customer support.
  • The implementation of intelligent automation and robotic process automation (RPA) allows businesses to offer 24/7 service availability, automating over 60% of routine inquiries and freeing up human agents for complex issues.
  • This drive for AI-driven customer engagement is reflected in regional growth, with North America alone accounting for nearly 38.7% of market expansion.
  • Advanced context awareness and sentiment analysis capabilities are further enhancing service quality, enabling virtual assistants to deliver more empathetic and relevant responses.
  • As a result, AI for contact center automation has become a core strategy for reducing operational costs and improving customer satisfaction scores across industries.

What are the market trends shaping the Virtual Assistant Industry?

  • The increasing popularity of chatbots is a significant trend, as these conversational agents become the primary interface for digital service interactions.

  • Key trends are reshaping the market, driven by the fusion of multimodal interfaces and advanced conversational AI. Conversational commerce platforms are leveraging these technologies to create seamless shopping experiences, with some retailers seeing a 15% improvement in conversion rates.
  • The use of predictive analytics in conversational marketing allows for hyper-personalized engagement, a critical factor as nearly half of younger consumers now expect AI-driven recommendations. Furthermore, generative AI applications are enhancing text-to-speech synthesis to produce highly natural and context-aware voices, which is vital for brand identity.
  • The global shift to hybrid work models, now adopted by over 60% of businesses in leading economies, has also accelerated demand for integrated virtual assistants that streamline cross-platform communication.

What challenges does the Virtual Assistant Industry face during its growth?

  • Integration complexities with diverse and often legacy enterprise systems present a significant challenge to market growth and adoption.

  • Significant challenges persist in the deployment of virtual assistants, particularly concerning integration and performance consistency. Enterprises report that custom integration projects for AI assistants for enterprise frequently exceed budgets by up to 25% due to complexities with legacy systems and fragmented data architectures.
  • The reliance on sophisticated machine learning models and neural networks creates difficulties in dialog management, where maintaining context in long conversations remains a hurdle. Furthermore, the accuracy of speech recognition technologies can drop by as much as 50% for non-dominant languages or regional dialects, limiting the effectiveness of omnichannel virtual assistants in global markets.
  • These issues in virtual agents for IT support and other applications highlight the need for more standardized integration protocols and diverse training datasets to ensure reliable performance.

Exclusive Technavio Analysis on Customer Landscape

The virtual assistant market forecasting report includes the adoption lifecycle of the market, covering from the innovator’s stage to the laggard’s stage. It focuses on adoption rates in different regions based on penetration. Furthermore, the virtual assistant market report also includes key purchase criteria and drivers of price sensitivity to help companies evaluate and develop their market growth analysis strategies.

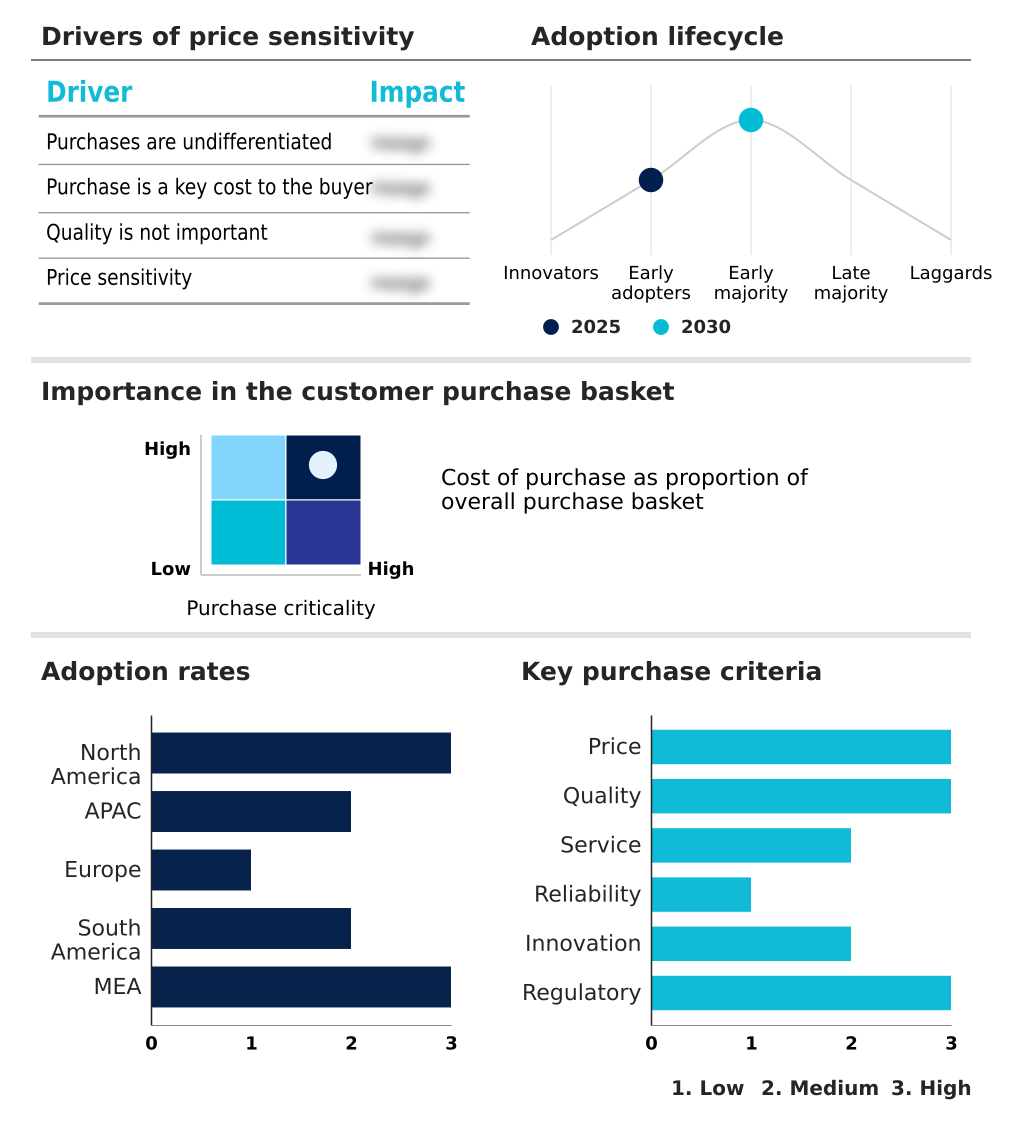
Customer Landscape of Virtual Assistant Industry

Competitive Landscape

Companies are implementing various strategies, such as strategic alliances, virtual assistant market forecast, partnerships, mergers and acquisitions, geographical expansion, and product/service launches, to enhance their presence in the industry.

247 Virtual Assistants - Provides specialized virtual assistant services that streamline administrative, customer support, and marketing operations for enhanced business efficiency and scalability.

The industry research and growth report includes detailed analyses of the competitive landscape of the market and information about key companies, including:

  • 247 Virtual Assistants
  • Amazon.com Inc.
  • Anboto Europe SL Co.
  • Apple Inc.
  • Teneo AI
  • Baidu Inc.
  • Creative Virtual Ltd.
  • CSS Corp.
  • CX Co.
  • eGain Corp.
  • GAVS Technologies NA Inc.
  • Google LLC
  • IBM Corp.
  • Inbenta Holdings Inc.
  • Microsoft Corp.
  • Oracle Corp.
  • Synthetix Ltd.
  • True Image Interactive Inc.
  • Verint Systems Inc.

Qualitative and quantitative analysis of companies has been conducted to help clients understand the wider business environment as well as the strengths and weaknesses of key industry players. Data is qualitatively analyzed to categorize companies as pure play, category-focused, industry-focused, and diversified; it is quantitatively analyzed to categorize companies as dominant, leading, strong, tentative, and weak.

Recent Development and News in Virtual assistant market

  • In August 2025, Tesla launched the Hey Tesla AI voice assistant for its electric vehicles in China, utilizing local models to ensure cultural and linguistic relevance.
  • In October 2025, Microsoft introduced agentic AI capabilities to its Copilot platform, enabling the system to execute multi-step tasks autonomously and anticipate user requirements.
  • In February 2025, Amazon unveiled Alexa+, a next-generation voice assistant powered by generative AI that offers more conversational and personalized interactions as a subscription service.
  • In May 2025, Sarvam AI launched Bulbul-v2, a neural text-to-speech model supporting eleven Indian languages, advancing localization efforts in the global virtual assistant market.

Dive into Technavio’s robust research methodology, blending expert interviews, extensive data synthesis, and validated models for unparalleled Virtual Assistant Market insights. See full methodology.

Market Scope
Page number 298
Base year 2025
Historic period 2020-2024
Forecast period 2026-2030
Growth momentum & CAGR Accelerate at a CAGR of 87.2%
Market growth 2026-2030 USD 394683.6 million
Market structure Fragmented
YoY growth 2025-2026(%) 48.0%
Key countries US, Canada, Mexico, China, Japan, India, South Korea, Australia, Indonesia, Germany, UK, France, Italy, Spain, The Netherlands, Brazil, Argentina, Chile, Saudi Arabia, UAE, South Africa, Israel and Turkey
Competitive landscape Leading Companies, Market Positioning of Companies, Competitive Strategies, and Industry Risks

Request Free Sample

Research Analyst Overview

  • The virtual assistant market is defined by a rapid evolution from basic voice-activated systems to sophisticated agentic AI capable of autonomous task automation. This shift is enabled by core technologies like natural language understanding, advanced speech recognition, and deep learning, which power increasingly complex human-computer interaction.
  • The integration of voice biometrics is becoming a critical security layer, particularly in sensitive sectors. As machine learning models become more powerful, there is a growing trend toward edge computing to ensure low-latency, real-time responsiveness.
  • For board-level decision-makers, the adoption of multimodal interfaces and AI-powered personalization is a key strategic consideration, impacting budget allocation for digital transformation, as these systems can enhance customer engagement by over 25%. A pivotal technology, text-to-speech synthesis, is achieving near-human vocal quality, while predictive analytics and sentiment analysis are providing unprecedented business intelligence.
  • The ultimate goal is achieving full context awareness and proactive assistance through intelligent automation, dialog management, and automated workflow, fundamentally reshaping automated customer support.

What are the Key Data Covered in this Virtual Assistant Market Research and Growth Report?

  • What is the expected growth of the Virtual Assistant Market between 2026 and 2030?

    • USD 394.68 billion, at a CAGR of 87.2%

  • What segmentation does the market report cover?

    • The report is segmented by Type (Spoken commands, and Text-to-speech), End-user (Automotive, BFSI, Government, Retail, and Others), Product Type (Chatbots, and Smart speakers) and Geography (North America, APAC, Europe, South America, Middle East and Africa)

  • Which regions are analyzed in the report?

    • North America, APAC, Europe, South America and Middle East and Africa

  • What are the key growth drivers and market challenges?

    • Demand for enhanced customer service, Integration difficulties with diverse enterprise systems

  • Who are the major players in the Virtual Assistant Market?

    • 247 Virtual Assistants, Amazon.com Inc., Anboto Europe SL Co., Apple Inc., Teneo AI, Baidu Inc., Creative Virtual Ltd., CSS Corp., CX Co., eGain Corp., GAVS Technologies NA Inc., Google LLC, IBM Corp., Inbenta Holdings Inc., Microsoft Corp., Oracle Corp., Synthetix Ltd., True Image Interactive Inc. and Verint Systems Inc.

Market Research Insights

  • Market dynamics are shaped by the enterprise adoption of omnichannel virtual assistants, which unify customer interactions across platforms. In the financial sector, personalized financial advisors are becoming standard, with adoption rates among younger demographics nearing 50%.
  • The integration of robotic process automation (RPA) with conversational interfaces is driving significant efficiency gains, with some firms reporting up to a 30% reduction in operational costs in back-office functions. This push is fueled by AI for contact center automation, where AI-powered tools are streamlining workflows and improving service quality.
  • The competitive landscape is increasingly influenced by the ability to deliver seamless, context-aware experiences that reduce customer effort and build loyalty.

We can help! Our analysts can customize this virtual assistant market research report to meet your requirements.

Get in touch

1. Executive Summary

1.1 Market overview

Executive Summary - Chart on Market Overview
Executive Summary - Data Table on Market Overview
Executive Summary - Chart on Global Market Characteristics
Executive Summary - Chart on Market by Geography
Executive Summary - Chart on Market Segmentation by Type
Executive Summary - Chart on Market Segmentation by End-user
Executive Summary - Chart on Market Segmentation by Product Type
Executive Summary - Chart on Incremental Growth
Executive Summary - Data Table on Incremental Growth
Executive Summary - Chart on Company Market Positioning

2. Technavio Analysis

2.1 Analysis of price sensitivity, lifecycle, customer purchase basket, adoption rates, and purchase criteria

2.2 Criticality of inputs and Factors of differentiation

Chart on Overview on criticality of inputs and factors of differentiation

2.3 Factors of disruption

Chart on Overview on factors of disruption

2.4 Impact of drivers and challenges

Chart on Impact of drivers and challenges in 2025 and 2030

3. Market Landscape

3.1 Market ecosystem

Chart on Parent Market
Data Table on - Parent Market

3.2 Market characteristics

Chart on Market characteristics analysis

3.3 Value chain analysis

Chart on Value chain analysis

4. Market Sizing

4.1 Market definition

Data Table on Offerings of companies included in the market definition

4.2 Market segment analysis

Market segments

4.3 Market size 2025

4.4 Market outlook: Forecast for 2025-2030

Chart on Global - Market size and forecast 2025-2030 ($ million)
Data Table on Global - Market size and forecast 2025-2030 ($ million)
Chart on Global Market: Year-over-year growth 2025-2030 (%)
Data Table on Global Market: Year-over-year growth 2025-2030 (%)

5. Historic Market Size

5.1 Global Virtual Assistant Market 2020 - 2024

Historic Market Size - Data Table on Global Virtual Assistant Market 2020 - 2024 ($ million)

5.2 Type segment analysis 2020 - 2024

Historic Market Size - Type Segment 2020 - 2024 ($ million)

5.3 End-user segment analysis 2020 - 2024

Historic Market Size - End-user Segment 2020 - 2024 ($ million)

5.4 Product Type segment analysis 2020 - 2024

Historic Market Size - Product Type Segment 2020 - 2024 ($ million)

5.5 Geography segment analysis 2020 - 2024

Historic Market Size - Geography Segment 2020 - 2024 ($ million)

5.6 Country segment analysis 2020 - 2024

Historic Market Size - Country Segment 2020 - 2024 ($ million)

6. Qualitative Analysis

6.1 Impact of AI on Global Virtual Assistant Market

7. Five Forces Analysis

7.1 Five forces summary

Five forces analysis - Comparison between 2025 and 2030

7.2 Bargaining power of buyers

Bargaining power of buyers - Impact of key factors 2025 and 2030

7.3 Bargaining power of suppliers

Bargaining power of suppliers - Impact of key factors in 2025 and 2030

7.4 Threat of new entrants

Threat of new entrants - Impact of key factors in 2025 and 2030

7.5 Threat of substitutes

Threat of substitutes - Impact of key factors in 2025 and 2030

7.6 Threat of rivalry

Threat of rivalry - Impact of key factors in 2025 and 2030

7.7 Market condition

Chart on Market condition - Five forces 2025 and 2030

8. Market Segmentation by Type

8.1 Market segments

Chart on Type - Market share 2025-2030 (%)
Data Table on Type - Market share 2025-2030 (%)

8.2 Comparison by Type

Chart on Comparison by Type
Data Table on Comparison by Type

8.3 Spoken commands - Market size and forecast 2025-2030

Chart on Spoken commands - Market size and forecast 2025-2030 ($ million)
Data Table on Spoken commands - Market size and forecast 2025-2030 ($ million)
Chart on Spoken commands - Year-over-year growth 2025-2030 (%)
Data Table on Spoken commands - Year-over-year growth 2025-2030 (%)

8.4 Text-to-speech - Market size and forecast 2025-2030

Chart on Text-to-speech - Market size and forecast 2025-2030 ($ million)
Data Table on Text-to-speech - Market size and forecast 2025-2030 ($ million)
Chart on Text-to-speech - Year-over-year growth 2025-2030 (%)
Data Table on Text-to-speech - Year-over-year growth 2025-2030 (%)

8.5 Market opportunity by Type

Market opportunity by Type ($ million)
Data Table on Market opportunity by Type ($ million)

9. Market Segmentation by End-user

9.1 Market segments

Chart on End-user - Market share 2025-2030 (%)
Data Table on End-user - Market share 2025-2030 (%)

9.2 Comparison by End-user

Chart on Comparison by End-user
Data Table on Comparison by End-user

9.3 Automotive - Market size and forecast 2025-2030

Chart on Automotive - Market size and forecast 2025-2030 ($ million)
Data Table on Automotive - Market size and forecast 2025-2030 ($ million)
Chart on Automotive - Year-over-year growth 2025-2030 (%)
Data Table on Automotive - Year-over-year growth 2025-2030 (%)

9.4 BFSI - Market size and forecast 2025-2030

Chart on BFSI - Market size and forecast 2025-2030 ($ million)
Data Table on BFSI - Market size and forecast 2025-2030 ($ million)
Chart on BFSI - Year-over-year growth 2025-2030 (%)
Data Table on BFSI - Year-over-year growth 2025-2030 (%)

9.5 Government - Market size and forecast 2025-2030

Chart on Government - Market size and forecast 2025-2030 ($ million)
Data Table on Government - Market size and forecast 2025-2030 ($ million)
Chart on Government - Year-over-year growth 2025-2030 (%)
Data Table on Government - Year-over-year growth 2025-2030 (%)

9.6 Retail - Market size and forecast 2025-2030

Chart on Retail - Market size and forecast 2025-2030 ($ million)
Data Table on Retail - Market size and forecast 2025-2030 ($ million)
Chart on Retail - Year-over-year growth 2025-2030 (%)
Data Table on Retail - Year-over-year growth 2025-2030 (%)

9.7 Others - Market size and forecast 2025-2030

Chart on Others - Market size and forecast 2025-2030 ($ million)
Data Table on Others - Market size and forecast 2025-2030 ($ million)
Chart on Others - Year-over-year growth 2025-2030 (%)
Data Table on Others - Year-over-year growth 2025-2030 (%)

9.8 Market opportunity by End-user

Market opportunity by End-user ($ million)
Data Table on Market opportunity by End-user ($ million)

10. Market Segmentation by Product Type

10.1 Market segments

Chart on Product Type - Market share 2025-2030 (%)
Data Table on Product Type - Market share 2025-2030 (%)

10.2 Comparison by Product Type

Chart on Comparison by Product Type
Data Table on Comparison by Product Type

10.3 Chatbots - Market size and forecast 2025-2030

Chart on Chatbots - Market size and forecast 2025-2030 ($ million)
Data Table on Chatbots - Market size and forecast 2025-2030 ($ million)
Chart on Chatbots - Year-over-year growth 2025-2030 (%)
Data Table on Chatbots - Year-over-year growth 2025-2030 (%)

10.4 Smart speakers - Market size and forecast 2025-2030

Chart on Smart speakers - Market size and forecast 2025-2030 ($ million)
Data Table on Smart speakers - Market size and forecast 2025-2030 ($ million)
Chart on Smart speakers - Year-over-year growth 2025-2030 (%)
Data Table on Smart speakers - Year-over-year growth 2025-2030 (%)

10.5 Market opportunity by Product Type

Market opportunity by Product Type ($ million)
Data Table on Market opportunity by Product Type ($ million)

11. Customer Landscape

11.1 Customer landscape overview

Analysis of price sensitivity, lifecycle, customer purchase basket, adoption rates, and purchase criteria

12. Geographic Landscape

12.1 Geographic segmentation

Chart on Market share by geography 2025-2030 (%)
Data Table on Market share by geography 2025-2030 (%)

12.2 Geographic comparison

Chart on Geographic comparison
Data Table on Geographic comparison

12.3 North America - Market size and forecast 2025-2030

Chart on North America - Market size and forecast 2025-2030 ($ million)
Data Table on North America - Market size and forecast 2025-2030 ($ million)
Chart on North America - Year-over-year growth 2025-2030 (%)
Data Table on North America - Year-over-year growth 2025-2030 (%)
Chart on Regional Comparison - North America
Data Table on Regional Comparison - North America

12.3.1 US - Market size and forecast 2025-2030

Chart on US - Market size and forecast 2025-2030 ($ million)
Data Table on US - Market size and forecast 2025-2030 ($ million)
Chart on US - Year-over-year growth 2025-2030 (%)
Data Table on US - Year-over-year growth 2025-2030 (%)

12.3.2 Canada - Market size and forecast 2025-2030

Chart on Canada - Market size and forecast 2025-2030 ($ million)
Data Table on Canada - Market size and forecast 2025-2030 ($ million)
Chart on Canada - Year-over-year growth 2025-2030 (%)
Data Table on Canada - Year-over-year growth 2025-2030 (%)

12.3.3 Mexico - Market size and forecast 2025-2030

Chart on Mexico - Market size and forecast 2025-2030 ($ million)
Data Table on Mexico - Market size and forecast 2025-2030 ($ million)
Chart on Mexico - Year-over-year growth 2025-2030 (%)
Data Table on Mexico - Year-over-year growth 2025-2030 (%)

12.4 APAC - Market size and forecast 2025-2030

Chart on APAC - Market size and forecast 2025-2030 ($ million)
Data Table on APAC - Market size and forecast 2025-2030 ($ million)
Chart on APAC - Year-over-year growth 2025-2030 (%)
Data Table on APAC - Year-over-year growth 2025-2030 (%)
Chart on Regional Comparison - APAC
Data Table on Regional Comparison - APAC

12.4.1 China - Market size and forecast 2025-2030

Chart on China - Market size and forecast 2025-2030 ($ million)
Data Table on China - Market size and forecast 2025-2030 ($ million)
Chart on China - Year-over-year growth 2025-2030 (%)
Data Table on China - Year-over-year growth 2025-2030 (%)

12.4.2 Japan - Market size and forecast 2025-2030

Chart on Japan - Market size and forecast 2025-2030 ($ million)
Data Table on Japan - Market size and forecast 2025-2030 ($ million)
Chart on Japan - Year-over-year growth 2025-2030 (%)
Data Table on Japan - Year-over-year growth 2025-2030 (%)

12.4.3 India - Market size and forecast 2025-2030

Chart on India - Market size and forecast 2025-2030 ($ million)
Data Table on India - Market size and forecast 2025-2030 ($ million)
Chart on India - Year-over-year growth 2025-2030 (%)
Data Table on India - Year-over-year growth 2025-2030 (%)

12.4.4 South Korea - Market size and forecast 2025-2030

Chart on South Korea - Market size and forecast 2025-2030 ($ million)
Data Table on South Korea - Market size and forecast 2025-2030 ($ million)
Chart on South Korea - Year-over-year growth 2025-2030 (%)
Data Table on South Korea - Year-over-year growth 2025-2030 (%)

12.4.5 Australia - Market size and forecast 2025-2030

Chart on Australia - Market size and forecast 2025-2030 ($ million)
Data Table on Australia - Market size and forecast 2025-2030 ($ million)
Chart on Australia - Year-over-year growth 2025-2030 (%)
Data Table on Australia - Year-over-year growth 2025-2030 (%)

12.4.6 Indonesia - Market size and forecast 2025-2030

Chart on Indonesia - Market size and forecast 2025-2030 ($ million)
Data Table on Indonesia - Market size and forecast 2025-2030 ($ million)
Chart on Indonesia - Year-over-year growth 2025-2030 (%)
Data Table on Indonesia - Year-over-year growth 2025-2030 (%)

12.5 Europe - Market size and forecast 2025-2030

Chart on Europe - Market size and forecast 2025-2030 ($ million)
Data Table on Europe - Market size and forecast 2025-2030 ($ million)
Chart on Europe - Year-over-year growth 2025-2030 (%)
Data Table on Europe - Year-over-year growth 2025-2030 (%)
Chart on Regional Comparison - Europe
Data Table on Regional Comparison - Europe

12.5.1 Germany - Market size and forecast 2025-2030

Chart on Germany - Market size and forecast 2025-2030 ($ million)
Data Table on Germany - Market size and forecast 2025-2030 ($ million)
Chart on Germany - Year-over-year growth 2025-2030 (%)
Data Table on Germany - Year-over-year growth 2025-2030 (%)

12.5.2 UK - Market size and forecast 2025-2030

Chart on UK - Market size and forecast 2025-2030 ($ million)
Data Table on UK - Market size and forecast 2025-2030 ($ million)
Chart on UK - Year-over-year growth 2025-2030 (%)
Data Table on UK - Year-over-year growth 2025-2030 (%)

12.5.3 France - Market size and forecast 2025-2030

Chart on France - Market size and forecast 2025-2030 ($ million)
Data Table on France - Market size and forecast 2025-2030 ($ million)
Chart on France - Year-over-year growth 2025-2030 (%)
Data Table on France - Year-over-year growth 2025-2030 (%)

12.5.4 Italy - Market size and forecast 2025-2030

Chart on Italy - Market size and forecast 2025-2030 ($ million)
Data Table on Italy - Market size and forecast 2025-2030 ($ million)
Chart on Italy - Year-over-year growth 2025-2030 (%)
Data Table on Italy - Year-over-year growth 2025-2030 (%)

12.5.5 Spain - Market size and forecast 2025-2030

Chart on Spain - Market size and forecast 2025-2030 ($ million)
Data Table on Spain - Market size and forecast 2025-2030 ($ million)
Chart on Spain - Year-over-year growth 2025-2030 (%)
Data Table on Spain - Year-over-year growth 2025-2030 (%)

12.5.6 The Netherlands - Market size and forecast 2025-2030

Chart on The Netherlands - Market size and forecast 2025-2030 ($ million)
Data Table on The Netherlands - Market size and forecast 2025-2030 ($ million)
Chart on The Netherlands - Year-over-year growth 2025-2030 (%)
Data Table on The Netherlands - Year-over-year growth 2025-2030 (%)

12.6 South America - Market size and forecast 2025-2030

Chart on South America - Market size and forecast 2025-2030 ($ million)
Data Table on South America - Market size and forecast 2025-2030 ($ million)
Chart on South America - Year-over-year growth 2025-2030 (%)
Data Table on South America - Year-over-year growth 2025-2030 (%)
Chart on Regional Comparison - South America
Data Table on Regional Comparison - South America

12.6.1 Brazil - Market size and forecast 2025-2030

Chart on Brazil - Market size and forecast 2025-2030 ($ million)
Data Table on Brazil - Market size and forecast 2025-2030 ($ million)
Chart on Brazil - Year-over-year growth 2025-2030 (%)
Data Table on Brazil - Year-over-year growth 2025-2030 (%)

12.6.2 Argentina - Market size and forecast 2025-2030

Chart on Argentina - Market size and forecast 2025-2030 ($ million)
Data Table on Argentina - Market size and forecast 2025-2030 ($ million)
Chart on Argentina - Year-over-year growth 2025-2030 (%)
Data Table on Argentina - Year-over-year growth 2025-2030 (%)

12.6.3 Chile - Market size and forecast 2025-2030

Chart on Chile - Market size and forecast 2025-2030 ($ million)
Data Table on Chile - Market size and forecast 2025-2030 ($ million)
Chart on Chile - Year-over-year growth 2025-2030 (%)
Data Table on Chile - Year-over-year growth 2025-2030 (%)

12.7 Middle East and Africa - Market size and forecast 2025-2030

Chart on Middle East and Africa - Market size and forecast 2025-2030 ($ million)
Data Table on Middle East and Africa - Market size and forecast 2025-2030 ($ million)
Chart on Middle East and Africa - Year-over-year growth 2025-2030 (%)
Data Table on Middle East and Africa - Year-over-year growth 2025-2030 (%)
Chart on Regional Comparison - Middle East and Africa
Data Table on Regional Comparison - Middle East and Africa

12.7.1 Saudi Arabia - Market size and forecast 2025-2030

Chart on Saudi Arabia - Market size and forecast 2025-2030 ($ million)
Data Table on Saudi Arabia - Market size and forecast 2025-2030 ($ million)
Chart on Saudi Arabia - Year-over-year growth 2025-2030 (%)
Data Table on Saudi Arabia - Year-over-year growth 2025-2030 (%)

12.7.2 UAE - Market size and forecast 2025-2030

Chart on UAE - Market size and forecast 2025-2030 ($ million)
Data Table on UAE - Market size and forecast 2025-2030 ($ million)
Chart on UAE - Year-over-year growth 2025-2030 (%)
Data Table on UAE - Year-over-year growth 2025-2030 (%)

12.7.3 South Africa - Market size and forecast 2025-2030

Chart on South Africa - Market size and forecast 2025-2030 ($ million)
Data Table on South Africa - Market size and forecast 2025-2030 ($ million)
Chart on South Africa - Year-over-year growth 2025-2030 (%)
Data Table on South Africa - Year-over-year growth 2025-2030 (%)

12.7.4 Israel - Market size and forecast 2025-2030

Chart on Israel - Market size and forecast 2025-2030 ($ million)
Data Table on Israel - Market size and forecast 2025-2030 ($ million)
Chart on Israel - Year-over-year growth 2025-2030 (%)
Data Table on Israel - Year-over-year growth 2025-2030 (%)

12.7.5 Turkey - Market size and forecast 2025-2030

Chart on Turkey - Market size and forecast 2025-2030 ($ million)
Data Table on Turkey - Market size and forecast 2025-2030 ($ million)
Chart on Turkey - Year-over-year growth 2025-2030 (%)
Data Table on Turkey - Year-over-year growth 2025-2030 (%)

12.8 Market opportunity by geography

Market opportunity by geography ($ million)
Data Tables on Market opportunity by geography ($ million)

13. Drivers, Challenges, and Opportunity

13.1 Market drivers

Demand for enhanced customer service
Benefits offered to content consumers and publishers
Smartphones with intelligent virtual assistants supporting human interactions

13.2 Market challenges

Integration difficulties with diverse enterprise systems
Lack of language and cultural nuance support
Limited accuracy in contextual conversations

13.3 Impact of drivers and challenges

Impact of drivers and challenges in 2025 and 2030

13.4 Market opportunities

Increasing popularity of chatbots
Virtual assistants make use of phone easier
Rising popularity of NLP

14. Competitive Landscape

14.1 Overview

14.2

Overview on criticality of inputs and factors of differentiation

14.3 Landscape disruption

Overview on factors of disruption

14.4 Industry risks

Impact of key risks on business

15. Competitive Analysis

15.1 Companies profiled

Companies covered

15.2 Company ranking index

15.3 Market positioning of companies

Matrix on companies position and classification

15.4 247 Virtual Assistants

247 Virtual Assistants - Overview
247 Virtual Assistants - Product / Service
247 Virtual Assistants - Key offerings
SWOT

15.5 Amazon.com Inc.

Amazon.com Inc. - Overview
Amazon.com Inc. - Business segments
Amazon.com Inc. - Key news
Amazon.com Inc. - Key offerings
Amazon.com Inc. - Segment focus
SWOT

15.6 Anboto Europe SL Co.

Anboto Europe SL Co. - Overview
Anboto Europe SL Co. - Product / Service
Anboto Europe SL Co. - Key offerings
SWOT

15.7 Apple Inc.

Apple Inc. - Overview
Apple Inc. - Business segments
Apple Inc. - Key news
Apple Inc. - Key offerings
Apple Inc. - Segment focus
SWOT

15.8 Baidu Inc.

Baidu Inc. - Overview
Baidu Inc. - Business segments
Baidu Inc. - Key offerings
Baidu Inc. - Segment focus
SWOT

15.9 Creative Virtual Ltd.

Creative Virtual Ltd. - Overview
Creative Virtual Ltd. - Product / Service
Creative Virtual Ltd. - Key offerings
SWOT

15.10 CSS Corp.

CSS Corp. - Overview
CSS Corp. - Product / Service
CSS Corp. - Key offerings
SWOT

15.11 CX Co.

CX Co. - Overview
CX Co. - Product / Service
CX Co. - Key offerings
SWOT

15.12 Google LLC

Google LLC - Overview
Google LLC - Product / Service
Google LLC - Key offerings
SWOT

15.13 IBM Corp.

IBM Corp. - Overview
IBM Corp. - Business segments
IBM Corp. - Key news
IBM Corp. - Key offerings
IBM Corp. - Segment focus
SWOT

15.14 Inbenta Holdings Inc.

Inbenta Holdings Inc. - Overview
Inbenta Holdings Inc. - Product / Service
Inbenta Holdings Inc. - Key offerings
SWOT

15.15 Microsoft Corp.

Microsoft Corp. - Overview
Microsoft Corp. - Business segments
Microsoft Corp. - Key news
Microsoft Corp. - Key offerings
Microsoft Corp. - Segment focus
SWOT

15.16 Oracle Corp.

Oracle Corp. - Overview
Oracle Corp. - Business segments
Oracle Corp. - Key news
Oracle Corp. - Key offerings
Oracle Corp. - Segment focus
SWOT

15.17 Synthetix Ltd.

Synthetix Ltd. - Overview
Synthetix Ltd. - Product / Service
Synthetix Ltd. - Key offerings
SWOT

15.18 Verint Systems Inc.

Verint Systems Inc. - Overview
Verint Systems Inc. - Product / Service
Verint Systems Inc. - Key offerings
SWOT

16. Appendix

16.1 Scope of the report

Market definition
Objectives
Notes and caveats

16.2 Inclusions and exclusions checklist

Inclusions checklist
Exclusions checklist

16.3 Currency conversion rates for US$

16.4 Research methodology

16.5 Data procurement

Information sources

16.6 Data validation

16.7 Validation techniques employed for market sizing

16.8 Data synthesis

16.9 360 degree market analysis

16.10 List of abbreviations

Research Methodology

Technavio presents a detailed picture of the market by way of study, synthesis, and summation of data from multiple sources. The analysts have presented the various facets of the market with a particular focus on identifying the key industry influencers. The data thus presented is comprehensive, reliable, and the result of extensive research, both primary and secondary.

INFORMATION SOURCES

Primary sources

  • Manufacturers and suppliers
  • Channel partners
  • Industry experts
  • Strategic decision makers

Secondary sources

  • Industry journals and periodicals
  • Government data
  • Financial reports of key industry players
  • Historical data
  • Press releases

DATA ANALYSIS

Data Synthesis

  • Collation of data
  • Estimation of key figures
  • Analysis of derived insights

Data Validation

  • Triangulation with data models
  • Reference against proprietary databases
  • Corroboration with industry experts

REPORT WRITING

Qualitative

  • Market drivers
  • Market challenges
  • Market trends
  • Five forces analysis

Quantitative

  • Market size and forecast
  • Market segmentation
  • Geographical insights
  • Competitive landscape

Interested in this report?

Get your sample now to see our research methodology and insights!

Download Now

Frequently Asked Questions

Virtual Assistant market growth will increase by USD 394683.6 million during 2026-2030.

The Virtual Assistant market is expected to grow at a CAGR of 87.2% during 2026-2030.

Virtual Assistant market is segmented by Type (Spoken commands, Text-to-speech) End-user (Automotive, BFSI, Government, Retail, Others) Product type (Chatbots, Smart speakers)

247 Virtual Assistants, Amazon.com Inc., Anboto Europe SL Co., Apple Inc., Teneo AI, Baidu Inc., Creative Virtual Ltd., CSS Corp., CX Co., eGain Corp., GAVS Technologies NA Inc., Google LLC, IBM Corp., Inbenta Holdings Inc., Microsoft Corp., Oracle Corp., Synthetix Ltd., True Image Interactive Inc., Verint Systems Inc. are a few of the key vendors in the Virtual Assistant market.

North America will register the highest growth rate of 38.7% among the other regions. Therefore, the Virtual Assistant market in North America is expected to garner significant business opportunities for the vendors during the forecast period.

US, Canada, Mexico, China, Japan, India, South Korea, Australia, Indonesia, Germany, UK, France, Italy, Spain, The Netherlands, Brazil, Argentina, Chile, Saudi Arabia, UAE, South Africa, Israel, Turkey

  • Demand for enhanced customer service is the driving factor this market.

The Virtual Assistant market vendors should focus on grabbing business opportunities from the Type segment as it accounted for the largest market share in the base year.