Virtual Desktop Infrastructure Market Analysis North America, Europe, APAC, South America, Middle East and Africa - US, Germany, UK, Canada, Australia - Size and Forecast 2024-2028

Virtual Desktop Infrastructure Market Analysis North America, Europe, APAC, South America, Middle East and Africa - US, Germany, UK, Canada, Australia - Size and Forecast 2024-2028

Published: May 2024 190 Pages SKU: IRTNTR43431

Market Overview at a Glance

$7.55 B
Market Opportunity
12.6%
CAGR
10.95
YoY growth 2023-2024(%)

Virtual Desktop Infrastructure Market Size 2024-2028 

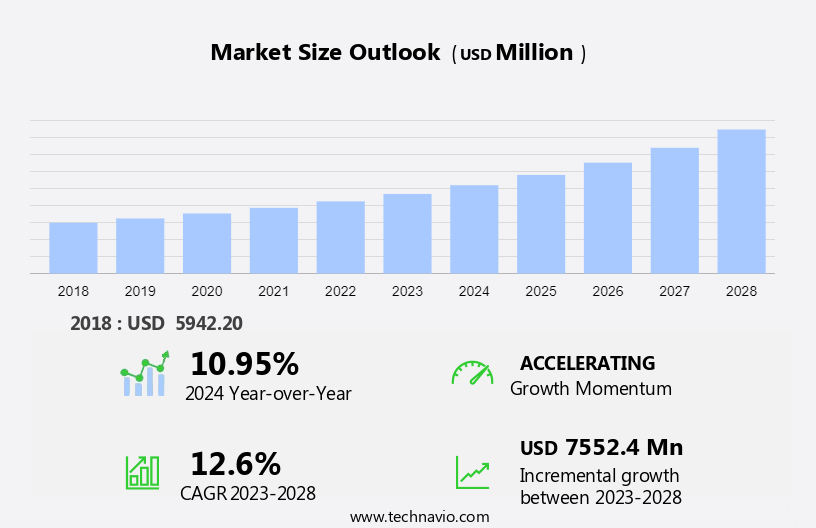
The virtual desktop infrastructure market size is forecast to increase by USD 7.55 billion at a CAGR of 12.6% between 2023 and 2028.

  • The Virtual Desktop Infrastructure (VDI) market is experiencing significant growth, driven by several key trends. One of the primary factors fueling market expansion is the ease of operating and managing virtual infrastructure for Small and Medium-sized Enterprises (SMEs). Cloud-based VDI solutions offer a cost-effective and efficient alternative to traditional desktop setups, enabling businesses to streamline operations and improve productivity. Cloud computing, artificial intelligence (AI), and automation are driving the integration of VDI with smart devices and digital workspaces, creating smart workplaces. Another trend shaping the VDI market is the resolution of infrastructure bottlenecks. With the increasing adoption of remote work and bring-your-own-device (BYOD) policies, organizations are seeking reliable and secure virtual desktop solutions to address the challenges of supporting diverse devices and ensuring seamless access to applications and data from anywhere. Despite these opportunities, the VDI market also faces challenges, such as the need for strong security measures to protect sensitive data and the requirement for high network bandwidth and low latency to ensure optimal user experience. Addressing these challenges will be crucial for market growth and the adoption of VDI solutions by businesses of all sizes.

What will be the Size of the Virtual Desktop Infrastructure Market During the Forecast Period?

Virtual Desktop Infrastructure Market Size

 Request Free Sample

  • The virtual desktop infrastructure (VDI) market is experiencing significant growth as businesses continue their digitalization efforts and strive for operational efficiency. With the proliferation of smart workplaces and the increasing use of smart devices, there is a rising demand for secure and flexible digital workspaces. VDI solutions enable businesses to deliver desktop environments and applications to end-users through the cloud or on-premises data centers, eliminating the need for a traditional client/server model and reducing the reliance on specific operating systems. Cloud computing and artificial intelligence (AI) are key drivers In the VDI market, enabling advanced automation and enhancing the user experience.
  • However, data security remains a major concern, with data breaches a constant threat In the digital age. VDI solutions provide a secure and centralized environment for managing desktops and applications, reducing the risk of data loss or theft. Virtual machines (VMs) are a popular technology used in VDI implementations, allowing businesses to create multiple virtual desktops on a single physical machine. The use of VMs also facilitates easy maintenance and upgrades, as well as improved resource utilization. Overall, the VDI market is expected to continue its growth trajectory as businesses seek to optimize their IT infrastructure and enhance their digital transformation initiatives.

How is this Virtual Desktop Infrastructure Industry segmented and which is the largest segment?

The virtual desktop infrastructure industry research report provides comprehensive data (region-wise segment analysis), with forecasts and estimates in "USD billion" for the period 2024-2028, as well as historical data from 2018-2022 for the following segments.
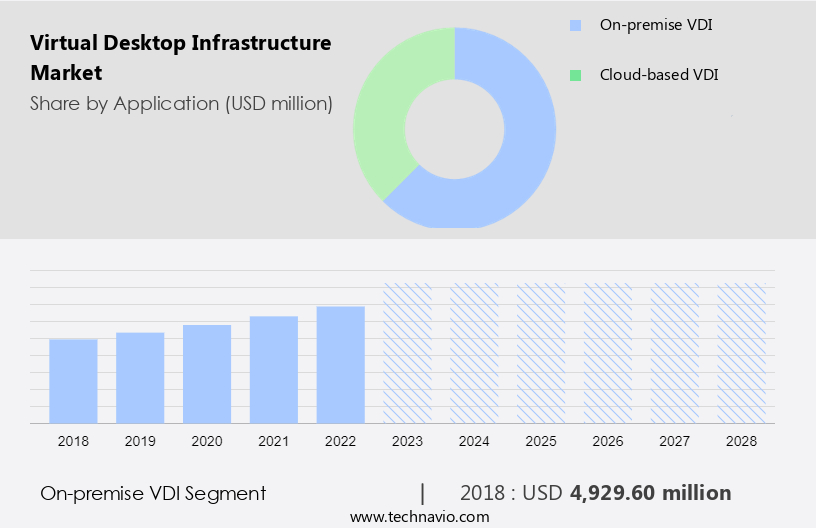
  • Application
    • On-premise VDI
    • Cloud-based VDI
  • End-user
    • BFSI
    • Education
    • Healthcare
    • Others
  • Type
    • Services
    • New software licenses
  • Geography
    • North America
      • Canada
      • US
    • Europe
      • Germany
      • UK
    • APAC
    • South America
    • Middle East and Africa

By Application Insights

  • The on-premise VDI segment is estimated to witness significant growth during the forecast period.

The Virtual Desktop Infrastructure (VDI) market is experiencing significant growth due to the increasing trend of remote work culture and the adoption of public cloud services. While the on-premises VDI segment is expected to grow at a slower pace compared to the cloud-based VDI segment, it remains a preferred choice for large enterprises with dedicated IT infrastructure and support teams. On-premises VDI provides companies with greater control and ownership over their software operations and critical data, as well as customization options and enhanced security. The deployment model requires software procurement, installation, and maintenance on the company's servers, making it a more capital-intensive option. Despite the initial investment, the added benefits of on-premises VDI, such as customization and security, continue to drive its adoption.

Virtual Desktop Infrastructure Market Size

Get a glance at the  Virtual Desktop Infrastructure Industry report of share of various segments Request Free Sample

The on-premise VDI segment was valued at USD 4.93 billion in 2018 and showed a gradual increase during the forecast period.

Regional Analysis

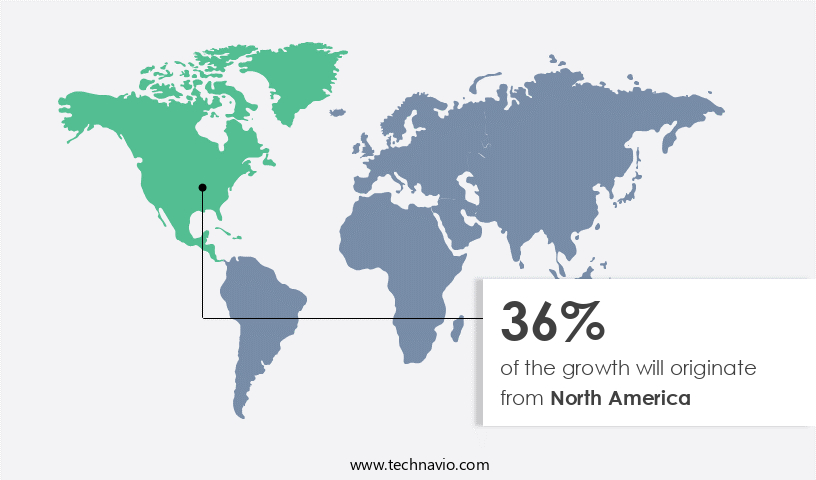
  • North America is estimated to contribute 36% to the growth of the global market during the forecast period.

Technavio's analysts have elaborately explained the regional trends and drivers that shape the market during the forecast period.

Virtual Desktop Infrastructure Market Share by Geography

For more insights on the market share of various regions, Request Free Sample

Virtual Desktop Infrastructure (VDI) market growth in North America is driven by the increasing adoption of virtualization software and solutions, particularly in sectors such as education and healthcare. The trend is expected to expand to industries like BFSI and government sectors. Cloud-based VDI solutions are gaining traction due to the flexibility they offer for operational business needs, which are increasingly utilizing cloud-based applications. Cost savings and access to cutting-edge technologies are additional benefits of VDI, making it an attractive option for businesses. Data security concerns, including data breaches, are being addressed through advanced security features in VDI platforms. The natural evolution of data centers towards virtualization and the increasing importance of business continuity plans further fuel the market growth during the forecast period.

Market Dynamics

Our virtual desktop infrastructure market researchers analyzed the data with 2023 as the base year, along with the key drivers, trends, and challenges. A holistic analysis of drivers will help companies refine their marketing strategies to gain a competitive advantage.

What are the key market drivers leading to the rise In the adoption of Virtual Desktop Infrastructure Industry?

Ease of operating and managing virtual infrastructure is the key driver of the market.

  • Virtual Desktop Infrastructure (VDI) has become a crucial component of digital transformation for businesses seeking to enhance operational efficiency and performance. Traditional desktop infrastructure, which handles large amounts of real-time data, requires continuous operation to prevent potential losses. VDI solutions address this need by offering real-time monitoring of components and environmental status. VDI delivers an improved user experience, enabling employees to access applications and data from anywhere using their Bring-Your-Own-Device (BYOD). This flexibility increases employee efficiency and supports the growing trend of remote work culture. VDI's cloud-based deployment models, such as Desktop-as-a-Service (DaaS), offer cost savings and elimination of compatibility issues often encountered in on-premises data centers.
  • Security is a significant concern for businesses handling sensitive data. VDI's encryption and data security features protect against data breaches, ensuring data privacy and compliance with industry regulations. Manufacturing, healthcare, IT & telecom, and large enterprises are among the industries increasingly adopting VDI to streamline operations and accommodate their mobile workforces. Virtual desktops and virtual machines (VMs) offer enhanced performance and operational efficiency. Public cloud and on-premise deployment types cater to businesses with varying security and cost requirements.

What are the market trends shaping the Virtual Desktop Infrastructure Industry?

Cloud-based VDI for SMEs is the upcoming market trend.

  • The Virtual Desktop Infrastructure (VDI) market is experiencing significant growth due to the increasing adoption of cloud computing and digital transformation by businesses. With the shift towards cloud-based solutions, companies are moving their operations from on-premises data centers to public clouds for enhanced operational efficiency and cost savings. This trend is driving the demand for cloud-based Desktop-as-a-Service (DaaS) platforms, which offer compatibility with various operating systems and smart devices. The healthcare, manufacturing, and IT & telecom industries are leading the way in implementing VDI solutions, as they require secure and efficient digital workspaces for their mobile workforce. VDI offers several advantages, including simplified administration, remote access and maintenance, and data security through encryption and other security strategies.
  • However, the high initial costs of implementing VDI solutions have made it challenging for Small and Medium-sized Enterprises (SMEs) to adopt them. Despite this, the benefits of increased employee efficiency, performance, and data security are compelling, making VDI an essential component of any modern business's IT strategy. As businesses continue to digitalize and embrace the remote work culture, the demand for VDI solutions is expected to grow. Cloud-based VDI offerings from leading DaaS providers offer cutting-edge solutions to address compatibility issues and ensure data security, making them an attractive option for businesses of all sizes.

What challenges does the Virtual Desktop Infrastructure Industry face during its growth?

Infrastructure bottlenecks is a key challenge affecting the industry growth.

  • Virtual Desktop Infrastructure (VDI) has become a crucial component of digital workspaces for businesses seeking to enhance employee efficiency and support a remote work culture. VDI enables the delivery of a desktop environment over a network, allowing employees to access their applications and data from any device, anywhere. However, the adoption of VDI comes with challenges, particularly in terms of compatibility issues and performance. The client/server model of VDI necessitates a strong and high-performance data center infrastructure. Many businesses encounter issues with their existing infrastructure's ability to support VDI operations, leading to increased capital expenditures (CAPEX) and operational expenditures (OPEX).
  • Furthermore, running multiple virtual images simultaneously can result in bottlenecks, decreased productivity, and lower operational efficiency due to increased latency periods and reduced input/output per second (IOPS) throughput. To address these challenges, companies such as Dell Technologies Inc., and Hewlett Packard Enterprise Co., have collaborated with major VDI providers like Citrix and VMware to deliver cloud-based, AI-driven, and automation-enabled data center infrastructure. These offerings cater specifically to VDI deployments, ensuring compatibility, performance, and security. Moreover, the adoption of Desktop-as-a-Service (DaaS) platforms further simplifies VDI deployment and management, enabling businesses to focus on their core competencies while ensuring data security and encryption.

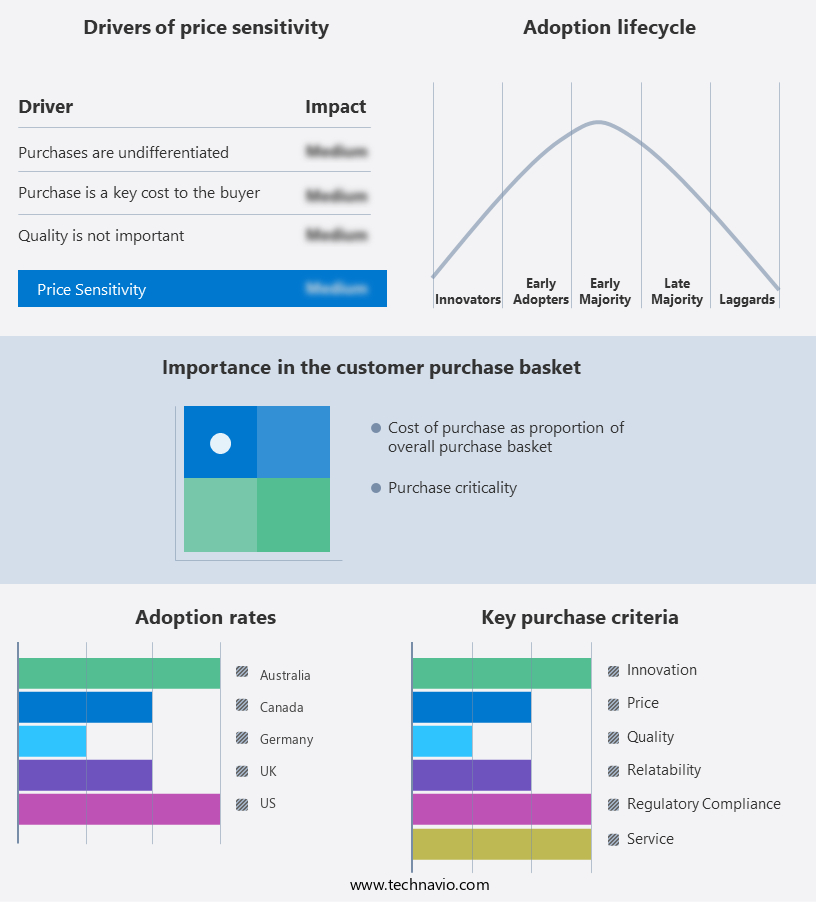
Exclusive Customer Landscape

The virtual desktop infrastructure market forecasting report includes the adoption lifecycle of the market, covering from the innovator's stage to the laggard's stage. It focuses on adoption rates in different regions based on penetration. Furthermore, the virtual desktop infrastructure market report also includes key purchase criteria and drivers of price sensitivity to help companies evaluate and develop their market growth analysis strategies.

Virtual Desktop Infrastructure Market Share by Geography

 Customer Landscape

Key Companies & Market Insights

Companies are implementing various strategies, such as strategic alliances, virtual desktop infrastructure market forecast, partnerships, mergers and acquisitions, geographical expansion, and product/service launches, to enhance their presence In the industry.

Ncomputing Co. Ltd. - The company offers virtual desktop infrastructure solutions such as Azure Virtual Desktop.

The industry research and growth report includes detailed analyses of the competitive landscape of the market and information about key companies, including:

  • Amazon.com Inc.
  • Centerm Information Co. Ltd.
  • Cisco Systems Inc.
  • Citrix Systems Inc.
  • Dell Technologies Inc.
  • dinCloud Inc.
  • Fujitsu Ltd.
  • Hewlett Packard Enterprise Co.
  • HiveIO Inc.
  • Huawei Technologies Co. Ltd.
  • IGEL
  • Intel Corp.
  • International Business Machines Corp.
  • Microsoft Corp.
  • Ncomputing Co. Ltd.
  • Oracle Corp.
  • Parallels International GmbH
  • Progress Software Corp.
  • Red Hat Inc.
  • Stratodesk Corp.

Qualitative and quantitative analysis of companies has been conducted to help clients understand the wider business environment as well as the strengths and weaknesses of key industry players. Data is qualitatively analyzed to categorize companies as pure play, category-focused, industry-focused, and diversified; it is quantitatively analyzed to categorize companies as dominant, leading, strong, tentative, and weak.

Research Analyst Overview

Virtual Desktop Infrastructure (VDI) is a deployment model that enables businesses to deliver desktop computing services over a network. This technology allows users to access their work environments from any location and device, fostering a flexible and efficient work culture. The Internet of Things (IoT) is increasingly integrated with solutions like Desktop as a Service (DaaS) and VDI (Virtual Desktop Infrastructure), which allow businesses to manage remote work environments more efficiently, all while relying on an optimized operating system to support seamless connectivity and performance. The VDI market has experienced significant growth due to the increasing trend of digital transformation and the adoption of cloud computing. The traditional client/server model has given way to digital workspaces, where applications and data are delivered as services over the Internet. This shift has led to numerous benefits, including cost savings, improved operational efficiency, and enhanced employee productivity.

Moreover, one of the key drivers of VDI adoption is the mobile workforce. With more employees working remotely, the need for secure and accessible desktops has become crucial. VDI solutions provide a consistent user experience across various devices, ensuring that employees can access their workspaces from anywhere, at any time. Another factor contributing to the growth of the VDI market is the integration of automation and artificial intelligence (AI) in desktop virtualization. These cutting-edge solutions enable businesses to streamline their IT operations, reduce manual tasks, and improve overall performance. Despite the numerous benefits, VDI implementation comes with its challenges.

Furthermore, compatibility issues between operating systems and applications can pose a significant hurdle. Moreover, data security concerns, such as data breaches and encryption, need to be addressed to ensure the confidentiality and integrity of sensitive information. VDI deployment models come in two primary types: on-premises and cloud-based. On-premises data centers offer greater control and customization, while cloud-based solutions provide scalability and cost savings. The choice between the two depends on the specific needs and resources of the business. The VDI market caters to various industries, including healthcare, IT & telecom, manufacturing, and large enterprises. These sectors require secure and efficient desktop environments to manage their digital workspaces effectively.

Virtual Desktop Infrastructure Market Scope

Report Coverage

Details

Page number

190

Base year

2023

Historic period

2018-2022

Forecast period

2024-2028

Growth momentum & CAGR

Accelerate at a CAGR of 12.6%

Market Growth 2024-2028

USD 7.55 billion

Market structure

Fragmented

YoY growth 2023-2024(%)

10.95

Key countries

US, Germany, UK, Canada, and Australia

Competitive landscape

Leading Companies, Market Positioning of Companies, Competitive Strategies, and Industry Risks

Request Free Sample

What are the Key Data Covered in this Virtual Desktop Infrastructure Market Research and Growth Report?

  • CAGR of the Virtual Desktop Infrastructure industry during the forecast period
  • Detailed information on factors that will drive the Virtual Desktop Infrastructure market growth and forecasting between 2024 and 2028
  • Precise estimation of the size of the market and its contribution of the industry in focus to the parent market
  • Accurate predictions about upcoming growth and trends and changes in consumer behaviour
  • Growth of the market across North America, Europe, APAC, South America, and Middle East and Africa
  • A thorough analysis of the market's competitive landscape and detailed information about companies
  • Comprehensive analysis of factors that will challenge the virtual desktop infrastructure market growth of industry companies

We can help! Our analysts can customize this virtual desktop infrastructure market research report to meet your requirements.

Get in touch

1 Executive Summary

  • 1.1 Market overview
    • Executive Summary - Chart on Market Overview
    • Executive Summary - Data Table on Market Overview
    • Executive Summary - Chart on Global Market Characteristics
    • Executive Summary - Chart on Market by Geography
    • Executive Summary - Chart on Market Segmentation by Application
    • Executive Summary - Chart on Market Segmentation by End-user
    • Executive Summary - Chart on Market Segmentation by Type
    • Executive Summary - Chart on Incremental Growth
    • Executive Summary - Data Table on Incremental Growth
    • Executive Summary - Chart on Company Market Positioning

2 Market Landscape

  • 2.1 Market ecosystem
    • Parent Market
    • Data Table on - Parent Market
  • 2.2 Market characteristics
    • Market characteristics analysis
  • 2.3 Value chain analysis
    • Value Chain Analysis

3 Market Sizing

  • 3.1 Market definition
    • Offerings of companies included in the market definition
  • 3.2 Market segment analysis
    • Market segments
  • 3.3 Market size 2023
    • 3.4 Market outlook: Forecast for 2023-2028
      • Chart on Global - Market size and forecast 2023-2028 ($ million)
      • Data Table on Global - Market size and forecast 2023-2028 ($ million)
      • Chart on Global Market: Year-over-year growth 2023-2028 (%)
      • Data Table on Global Market: Year-over-year growth 2023-2028 (%)

    4 Historic Market Size

    • 4.1 Global Virtual Desktop Infrastructure Market 2018 - 2022
      • Historic Market Size - Data Table on Global Virtual Desktop Infrastructure Market 2018 - 2022 ($ million)
    • 4.2 Application segment analysis 2018 - 2022
      • Historic Market Size - Application Segment 2018 - 2022 ($ million)
    • 4.3 End-user segment analysis 2018 - 2022
      • Historic Market Size - End-user Segment 2018 - 2022 ($ million)
    • 4.4 Type segment analysis 2018 - 2022
      • Historic Market Size - Type Segment 2018 - 2022 ($ million)
    • 4.5 Geography segment analysis 2018 - 2022
      • Historic Market Size - Geography Segment 2018 - 2022 ($ million)
    • 4.6 Country segment analysis 2018 - 2022
      • Historic Market Size - Country Segment 2018 - 2022 ($ million)

    5 Five Forces Analysis

    • 5.1 Five forces summary
      • Five forces analysis - Comparison between 2023 and 2028
    • 5.2 Bargaining power of buyers
      • Bargaining power of buyers - Impact of key factors 2023 and 2028
    • 5.3 Bargaining power of suppliers
      • Bargaining power of suppliers - Impact of key factors in 2023 and 2028
    • 5.4 Threat of new entrants
      • Threat of new entrants - Impact of key factors in 2023 and 2028
    • 5.5 Threat of substitutes
      • Threat of substitutes - Impact of key factors in 2023 and 2028
    • 5.6 Threat of rivalry
      • Threat of rivalry - Impact of key factors in 2023 and 2028
    • 5.7 Market condition
      • Chart on Market condition - Five forces 2023 and 2028

    6 Market Segmentation by Application

    • 6.1 Market segments
      • Chart on Application - Market share 2023-2028 (%)
      • Data Table on Application - Market share 2023-2028 (%)
    • 6.2 Comparison by Application
      • Chart on Comparison by Application
      • Data Table on Comparison by Application
    • 6.3 On-premise VDI - Market size and forecast 2023-2028
      • Chart on On-premise VDI - Market size and forecast 2023-2028 ($ million)
      • Data Table on On-premise VDI - Market size and forecast 2023-2028 ($ million)
      • Chart on On-premise VDI - Year-over-year growth 2023-2028 (%)
      • Data Table on On-premise VDI - Year-over-year growth 2023-2028 (%)
    • 6.4 Cloud-based VDI - Market size and forecast 2023-2028
      • Chart on Cloud-based VDI - Market size and forecast 2023-2028 ($ million)
      • Data Table on Cloud-based VDI - Market size and forecast 2023-2028 ($ million)
      • Chart on Cloud-based VDI - Year-over-year growth 2023-2028 (%)
      • Data Table on Cloud-based VDI - Year-over-year growth 2023-2028 (%)
    • 6.5 Market opportunity by Application
      • Market opportunity by Application ($ million)
      • Data Table on Market opportunity by Application ($ million)

    7 Market Segmentation by End-user

    • 7.1 Market segments
      • Chart on End-user - Market share 2023-2028 (%)
      • Data Table on End-user - Market share 2023-2028 (%)
    • 7.2 Comparison by End-user
      • Chart on Comparison by End-user
      • Data Table on Comparison by End-user
    • 7.3 BFSI - Market size and forecast 2023-2028
      • Chart on BFSI - Market size and forecast 2023-2028 ($ million)
      • Data Table on BFSI - Market size and forecast 2023-2028 ($ million)
      • Chart on BFSI - Year-over-year growth 2023-2028 (%)
      • Data Table on BFSI - Year-over-year growth 2023-2028 (%)
    • 7.4 Education - Market size and forecast 2023-2028
      • Chart on Education - Market size and forecast 2023-2028 ($ million)
      • Data Table on Education - Market size and forecast 2023-2028 ($ million)
      • Chart on Education - Year-over-year growth 2023-2028 (%)
      • Data Table on Education - Year-over-year growth 2023-2028 (%)
    • 7.5 Healthcare - Market size and forecast 2023-2028
      • Chart on Healthcare - Market size and forecast 2023-2028 ($ million)
      • Data Table on Healthcare - Market size and forecast 2023-2028 ($ million)
      • Chart on Healthcare - Year-over-year growth 2023-2028 (%)
      • Data Table on Healthcare - Year-over-year growth 2023-2028 (%)
    • 7.6 Others - Market size and forecast 2023-2028
      • Chart on Others - Market size and forecast 2023-2028 ($ million)
      • Data Table on Others - Market size and forecast 2023-2028 ($ million)
      • Chart on Others - Year-over-year growth 2023-2028 (%)
      • Data Table on Others - Year-over-year growth 2023-2028 (%)
    • 7.7 Market opportunity by End-user
      • Market opportunity by End-user ($ million)
      • Data Table on Market opportunity by End-user ($ million)

    8 Market Segmentation by Type

    • 8.1 Market segments
      • Chart on Type - Market share 2023-2028 (%)
      • Data Table on Type - Market share 2023-2028 (%)
    • 8.2 Comparison by Type
      • Chart on Comparison by Type
      • Data Table on Comparison by Type
    • 8.3 Services - Market size and forecast 2023-2028
      • Chart on Services - Market size and forecast 2023-2028 ($ million)
      • Data Table on Services - Market size and forecast 2023-2028 ($ million)
      • Chart on Services - Year-over-year growth 2023-2028 (%)
      • Data Table on Services - Year-over-year growth 2023-2028 (%)
    • 8.4 New software licenses - Market size and forecast 2023-2028
      • Chart on New software licenses - Market size and forecast 2023-2028 ($ million)
      • Data Table on New software licenses - Market size and forecast 2023-2028 ($ million)
      • Chart on New software licenses - Year-over-year growth 2023-2028 (%)
      • Data Table on New software licenses - Year-over-year growth 2023-2028 (%)
    • 8.5 Market opportunity by Type
      • Market opportunity by Type ($ million)
      • Data Table on Market opportunity by Type ($ million)

    9 Customer Landscape

    • 9.1 Customer landscape overview
      • Analysis of price sensitivity, lifecycle, customer purchase basket, adoption rates, and purchase criteria

    10 Geographic Landscape

    • 10.1 Geographic segmentation
      • Chart on Market share by geography 2023-2028 (%)
      • Data Table on Market share by geography 2023-2028 (%)
    • 10.2 Geographic comparison
      • Chart on Geographic comparison
      • Data Table on Geographic comparison
    • 10.3 North America - Market size and forecast 2023-2028
      • Chart on North America - Market size and forecast 2023-2028 ($ million)
      • Data Table on North America - Market size and forecast 2023-2028 ($ million)
      • Chart on North America - Year-over-year growth 2023-2028 (%)
      • Data Table on North America - Year-over-year growth 2023-2028 (%)
    • 10.4 Europe - Market size and forecast 2023-2028
      • Chart on Europe - Market size and forecast 2023-2028 ($ million)
      • Data Table on Europe - Market size and forecast 2023-2028 ($ million)
      • Chart on Europe - Year-over-year growth 2023-2028 (%)
      • Data Table on Europe - Year-over-year growth 2023-2028 (%)
    • 10.5 APAC - Market size and forecast 2023-2028
      • Chart on APAC - Market size and forecast 2023-2028 ($ million)
      • Data Table on APAC - Market size and forecast 2023-2028 ($ million)
      • Chart on APAC - Year-over-year growth 2023-2028 (%)
      • Data Table on APAC - Year-over-year growth 2023-2028 (%)
    • 10.6 South America - Market size and forecast 2023-2028
      • Chart on South America - Market size and forecast 2023-2028 ($ million)
      • Data Table on South America - Market size and forecast 2023-2028 ($ million)
      • Chart on South America - Year-over-year growth 2023-2028 (%)
      • Data Table on South America - Year-over-year growth 2023-2028 (%)
    • 10.7 Middle East and Africa - Market size and forecast 2023-2028
      • Chart on Middle East and Africa - Market size and forecast 2023-2028 ($ million)
      • Data Table on Middle East and Africa - Market size and forecast 2023-2028 ($ million)
      • Chart on Middle East and Africa - Year-over-year growth 2023-2028 (%)
      • Data Table on Middle East and Africa - Year-over-year growth 2023-2028 (%)
    • 10.8 US - Market size and forecast 2023-2028
      • Chart on US - Market size and forecast 2023-2028 ($ million)
      • Data Table on US - Market size and forecast 2023-2028 ($ million)
      • Chart on US - Year-over-year growth 2023-2028 (%)
      • Data Table on US - Year-over-year growth 2023-2028 (%)
    • 10.9 Germany - Market size and forecast 2023-2028
      • Chart on Germany - Market size and forecast 2023-2028 ($ million)
      • Data Table on Germany - Market size and forecast 2023-2028 ($ million)
      • Chart on Germany - Year-over-year growth 2023-2028 (%)
      • Data Table on Germany - Year-over-year growth 2023-2028 (%)
    • 10.10 UK - Market size and forecast 2023-2028
      • Chart on UK - Market size and forecast 2023-2028 ($ million)
      • Data Table on UK - Market size and forecast 2023-2028 ($ million)
      • Chart on UK - Year-over-year growth 2023-2028 (%)
      • Data Table on UK - Year-over-year growth 2023-2028 (%)
    • 10.11 Canada - Market size and forecast 2023-2028
      • Chart on Canada - Market size and forecast 2023-2028 ($ million)
      • Data Table on Canada - Market size and forecast 2023-2028 ($ million)
      • Chart on Canada - Year-over-year growth 2023-2028 (%)
      • Data Table on Canada - Year-over-year growth 2023-2028 (%)
    • 10.12 Australia - Market size and forecast 2023-2028
      • Chart on Australia - Market size and forecast 2023-2028 ($ million)
      • Data Table on Australia - Market size and forecast 2023-2028 ($ million)
      • Chart on Australia - Year-over-year growth 2023-2028 (%)
      • Data Table on Australia - Year-over-year growth 2023-2028 (%)
    • 10.13 Market opportunity by geography
      • Market opportunity by geography ($ million)
      • Data Tables on Market opportunity by geography ($ million)

    11 Drivers, Challenges, and Opportunity/Restraints

    • 11.1 Market drivers
      • 11.2 Market challenges
        • 11.3 Impact of drivers and challenges
          • Impact of drivers and challenges in 2023 and 2028
        • 11.4 Market opportunities/restraints

          12 Competitive Landscape

          • 12.1 Overview
            • 12.2 Competitive Landscape
              • Overview on criticality of inputs and factors of differentiation
            • 12.3 Landscape disruption
              • Overview on factors of disruption
            • 12.4 Industry risks
              • Impact of key risks on business

            13 Competitive Analysis

            • 13.1 Companies profiled
              • Companies covered
            • 13.2 Market positioning of companies
              • Matrix on companies position and classification
            • 13.3 Amazon.com Inc.
              • Amazon.com Inc. - Overview
              • Amazon.com Inc. - Business segments
              • Amazon.com Inc. - Key news
              • Amazon.com Inc. - Key offerings
              • Amazon.com Inc. - Segment focus
            • 13.4 Centerm Information Co. Ltd.
              • Centerm Information Co. Ltd. - Overview
              • Centerm Information Co. Ltd. - Product / Service
              • Centerm Information Co. Ltd. - Key offerings
            • 13.5 Cisco Systems Inc.
              • Cisco Systems Inc. - Overview
              • Cisco Systems Inc. - Business segments
              • Cisco Systems Inc. - Key news
              • Cisco Systems Inc. - Key offerings
              • Cisco Systems Inc. - Segment focus
            • 13.6 Citrix Systems Inc.
              • Citrix Systems Inc. - Overview
              • Citrix Systems Inc. - Product / Service
              • Citrix Systems Inc. - Key offerings
            • 13.7 Dell Technologies Inc.
              • Dell Technologies Inc. - Overview
              • Dell Technologies Inc. - Business segments
              • Dell Technologies Inc. - Key offerings
              • Dell Technologies Inc. - Segment focus
            • 13.8 dinCloud Inc.
              • dinCloud Inc. - Overview
              • dinCloud Inc. - Product / Service
              • dinCloud Inc. - Key offerings
            • 13.9 Fujitsu Ltd.
              • Fujitsu Ltd. - Overview
              • Fujitsu Ltd. - Business segments
              • Fujitsu Ltd. - Key news
              • Fujitsu Ltd. - Key offerings
              • Fujitsu Ltd. - Segment focus
            • 13.10 Hewlett Packard Enterprise Co.
              • Hewlett Packard Enterprise Co. - Overview
              • Hewlett Packard Enterprise Co. - Business segments
              • Hewlett Packard Enterprise Co. - Key news
              • Hewlett Packard Enterprise Co. - Key offerings
              • Hewlett Packard Enterprise Co. - Segment focus
            • 13.11 HiveIO Inc.
              • HiveIO Inc. - Overview
              • HiveIO Inc. - Product / Service
              • HiveIO Inc. - Key offerings
            • 13.12 Huawei Technologies Co. Ltd.
              • Huawei Technologies Co. Ltd. - Overview
              • Huawei Technologies Co. Ltd. - Product / Service
              • Huawei Technologies Co. Ltd. - Key news
              • Huawei Technologies Co. Ltd. - Key offerings
            • 13.13 Intel Corp.
              • Intel Corp. - Overview
              • Intel Corp. - Business segments
              • Intel Corp. - Key news
              • Intel Corp. - Key offerings
              • Intel Corp. - Segment focus
            • 13.14 International Business Machines Corp.
              • International Business Machines Corp. - Overview
              • International Business Machines Corp. - Business segments
              • International Business Machines Corp. - Key news
              • International Business Machines Corp. - Key offerings
              • International Business Machines Corp. - Segment focus
            • 13.15 Microsoft Corp.
              • Microsoft Corp. - Overview
              • Microsoft Corp. - Business segments
              • Microsoft Corp. - Key news
              • Microsoft Corp. - Key offerings
              • Microsoft Corp. - Segment focus
            • 13.16 Oracle Corp.
              • Oracle Corp. - Overview
              • Oracle Corp. - Business segments
              • Oracle Corp. - Key news
              • Oracle Corp. - Key offerings
              • Oracle Corp. - Segment focus
            • 13.17 Red Hat Inc.
              • Red Hat Inc. - Overview
              • Red Hat Inc. - Product / Service
              • Red Hat Inc. - Key offerings

            14 Appendix

            • 14.1 Scope of the report
              • 14.2 Inclusions and exclusions checklist
                • Inclusions checklist
                • Exclusions checklist
              • 14.3 Currency conversion rates for US$
                • Currency conversion rates for US$
              • 14.4 Research methodology
                • Research methodology
              • 14.5 Data procurement
                • Information sources
              • 14.6 Data validation
                • Data validation
              • 14.7 Validation techniques employed for market sizing
                • Validation techniques employed for market sizing
              • 14.8 Data synthesis
                • Data synthesis
              • 14.9 360 degree market analysis
                • 360 degree market analysis
              • 14.10 List of abbreviations
                • List of abbreviations

              Research Methodology

              Technavio presents a detailed picture of the market by way of study, synthesis, and summation of data from multiple sources. The analysts have presented the various facets of the market with a particular focus on identifying the key industry influencers. The data thus presented is comprehensive, reliable, and the result of extensive research, both primary and secondary.

              INFORMATION SOURCES

              Primary sources

              • Manufacturers and suppliers
              • Channel partners
              • Industry experts
              • Strategic decision makers

              Secondary sources

              • Industry journals and periodicals
              • Government data
              • Financial reports of key industry players
              • Historical data
              • Press releases

              DATA ANALYSIS

              Data Synthesis

              • Collation of data
              • Estimation of key figures
              • Analysis of derived insights

              Data Validation

              • Triangulation with data models
              • Reference against proprietary databases
              • Corroboration with industry experts

              REPORT WRITING

              Qualitative

              • Market drivers
              • Market challenges
              • Market trends
              • Five forces analysis

              Quantitative

              • Market size and forecast
              • Market segmentation
              • Geographical insights
              • Competitive landscape

              Interested in this report?

              Get your sample now to see our research methodology and insights!

              Download Now

              Frequently Asked Questions

              Virtual Desktop Infrastructure market growth will increase by $ 7552.4 mn during 2024-2028.

              The Virtual Desktop Infrastructure market is expected to grow at a CAGR of 12.6% during 2024-2028.

              Virtual Desktop Infrastructure market is segmented by Application( On-premise VDI, Cloud-based VDI, Healthcare, Others) End-user( BFSI, Education, Healthcare, Others) Type( Services, New software licenses, APAC, South America, MEA)

              Amazon.com Inc., Centerm Information Co. Ltd., Cisco Systems Inc., Citrix Systems Inc., Dell Technologies Inc., dinCloud Inc., Fujitsu Ltd., Hewlett Packard Enterprise Co., HiveIO Inc., Huawei Technologies Co. Ltd., IGEL, Intel Corp., International Business Machines Corp., Microsoft Corp., Ncomputing Co. Ltd., Oracle Corp., Parallels International GmbH, Progress Software Corp., Red Hat Inc., Stratodesk Corp. are a few of the key vendors in the Virtual Desktop Infrastructure market.

              North America will register the highest growth rate of 36% among the other regions. Therefore, the Virtual Desktop Infrastructure market in North America is expected to garner significant business opportunities for the vendors during the forecast period.

              US, Germany, UK, Canada, Australia

              • Ease of operating and managing virtual infrastructureIncreasing the efficiency and performance of business operations is crucial for any enterprise. These enterprises operate traditional desktop infrastructure and deal in a huge amount of data is the driving factor this market.
              • which is stored is the driving factor this market.
              • managed is the driving factor this market.
              • and processed in real time. Therefore is the driving factor this market.
              • it is necessary for these enterprises to run their operations continuously and efficiently. The shutting down of an enterprise can result in losses worth billions of dollars to the company. Hence is the driving factor this market.
              • enterprises are implementing VDI solutions to keep track of the real-time status of components and environmental parameters.VDI offers an enhanced user experience compared to traditional desktop infrastructure. Benefits of VDI include application compatibility and authorization to access data and applications from anywhere. User access can also be changed through centralized management software. Additional endpoints can be rapidly deployed to save costs and provide better scalability compared to a traditional computer network.VDI offers easy maintenance where administrators can remove or change any software based on requirements. In addition is the driving factor this market.
              • in scenarios of system interruptions is the driving factor this market.
              • users can reboot to restore operations. Since the infrastructure is centralized is the driving factor this market.
              • maintenance time and cost are reduced as well is the driving factor this market.
              • and the global VDI market is expected to witness high growth during the forecast period. is the driving factor this market.

              The Virtual Desktop Infrastructure market vendors should focus on grabbing business opportunities from the On-premise VDI segment as it accounted for the largest market share in the base year.