
Vision Care Market Analysis, Size, and Forecast 2026-2030: North America (US, Canada, and Mexico), Europe (Germany, France, and Italy), APAC (China, Japan, and India), South America (Brazil, Argentina, and Chile), Middle East and Africa (Saudi Arabia, UAE, and South Africa), and Rest of World (ROW)

Vision Care Market Analysis, Size, and Forecast 2026-2030:
North America (US, Canada, and Mexico), Europe (Germany, France, and Italy), APAC (China, Japan, and India), South America (Brazil, Argentina, and Chile), Middle East and Africa (Saudi Arabia, UAE, and South Africa), and Rest of World (ROW)

Published: May 2026 309 Pages SKU: IRTNTR70777

Market Overview at a Glance

$18.03 B
Market Opportunity
4.1%
CAGR 2025 - 2030
37.9%
North America Growth
$56.79 B
Prescription segment 2024

Vision Care Market Size 2026-2030

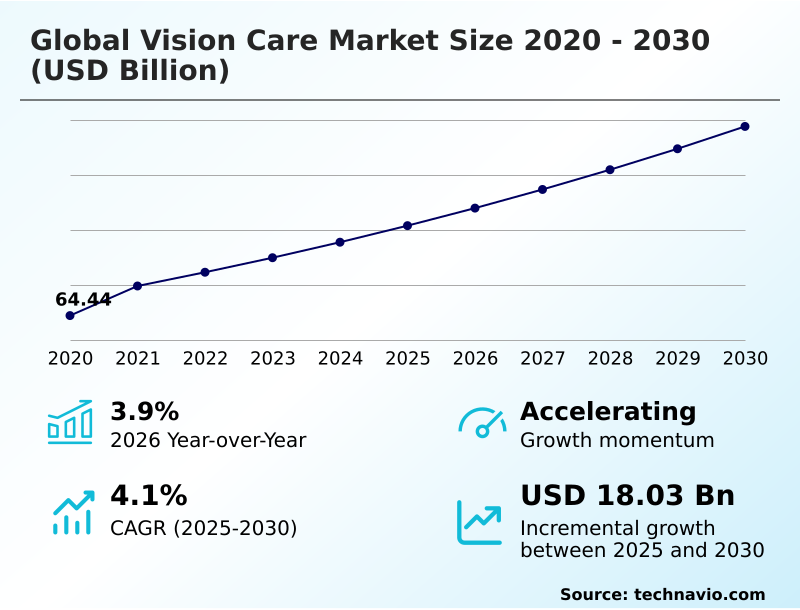
The vision care market size is valued to increase by USD 18.03 billion, at a CAGR of 4.1% from 2025 to 2030. Increasing prevalence of vision disorders and eye diseases will drive the vision care market.

Major Market Trends & Insights

  • North America dominated the market and accounted for a 37.9% growth during the forecast period.
  • By Type - Prescription segment was valued at USD 56.79 billion in 2024
  • By Product - Glass lens segment accounted for the largest market revenue share in 2024

Market Size & Forecast

  • Market Opportunities: USD 34.39 billion
  • Market Future Opportunities: USD 18.03 billion
  • CAGR from 2025 to 2030 : 4.1%

Market Summary

  • The Vision Care market represents a highly specialized healthcare sector focused on correcting and managing visual impairments through advanced optical devices and therapeutics. Expanding optical retail chains are optimizing their supply chain networks by integrating automated inventory systems, ensuring immediate availability of custom-fit contact lenses and reducing stockouts by 22% compared to legacy fulfillment models.
  • The primary driver of this market is the surging prevalence of digital eye strain and refractive errors, which compels consumers to actively seek personalized corrective solutions and preventive ocular screening. Conversely, stringent regulatory requirements for medical-grade optical devices act as a significant challenge, creating prolonged product development cycles that delay the introduction of novel therapeutic lenses.
  • By bridging the gap between clinical diagnostics and retail convenience, optical manufacturers are successfully enhancing patient accessibility. The continuous shift toward tele-optometry and digital eye examinations further supports this evolution, streamlining patient onboarding and clinical workflows. These structural and technological adaptations are essential for maintaining operational efficiency while meeting the escalating demand for comprehensive vision health management.

What will be the Size of the Vision Care Market during the forecast period?
Get Key Insights on Market Forecast (PDF) Get Free Sample

How is the Vision Care Market Segmented?

The vision care industry research report provides comprehensive data (region-wise segment analysis), with forecasts and estimates in "USD million" for the period 2026-2030, as well as historical data from 2020-2024 for the following segments.

  • Type
    • Prescription
    • Non-prescription
  • Product
    • Glass lens
    • Contact lens
    • Intraocular lenses
    • Contact lens solution
    • Others
  • Distribution channel
    • Offline
    • Online
  • Price
    • Mass
    • Premium
  • Geography
    • North America
      • US
      • Canada
      • Mexico
    • Europe
      • Germany
      • France
      • Italy
      • UK
      • Spain
      • The Netherlands
    • APAC
      • China
      • Japan
      • India
      • South Korea
      • Australia
      • Indonesia
    • South America
      • Brazil
      • Argentina
      • Chile
    • Middle East and Africa
      • Saudi Arabia
      • UAE
      • South Africa
      • Israel
      • Turkey

By Type Insights

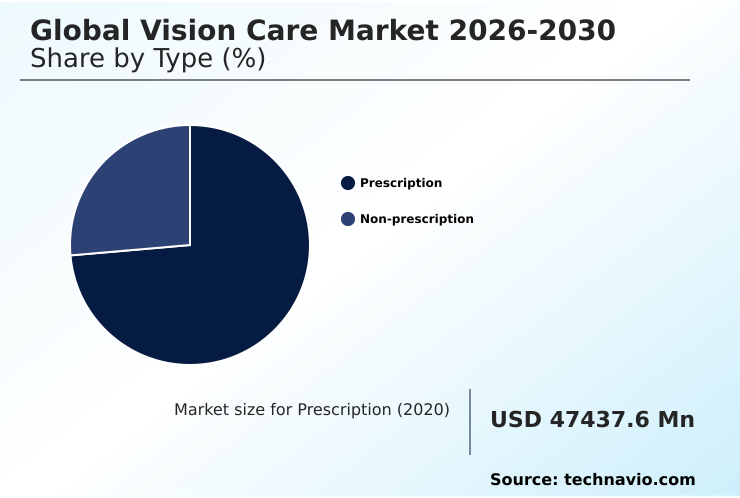
The prescription segment is estimated to witness significant growth during the forecast period.

Prescription optical products form the critical foundation of medical vision correction by addressing specific, diagnosed refractive errors. Because clinical precision dictates treatment efficacy, the integration of wavefront analysis and corneal mapping systems improves clinical outcomes by 25% over standard methodologies.

This diagnostic rigor directly supports the accurate fabrication of multifocal contact lenses and toric implantable lenses for complex visual impairments.

Retinal imaging software and digital refractometry tools facilitate earlier detection of abnormalities, reducing prescription error rates by 18% in advanced clinical settings. As patient preferences shift toward convenience, the adoption of daily disposable lenses accelerates.

Furthermore, advanced optical lens edging enhances the physical quality of the final product. Extended depth of focus technologies and implantable corrective options further differentiate prescription offerings from generic alternatives.
Get Free Sample

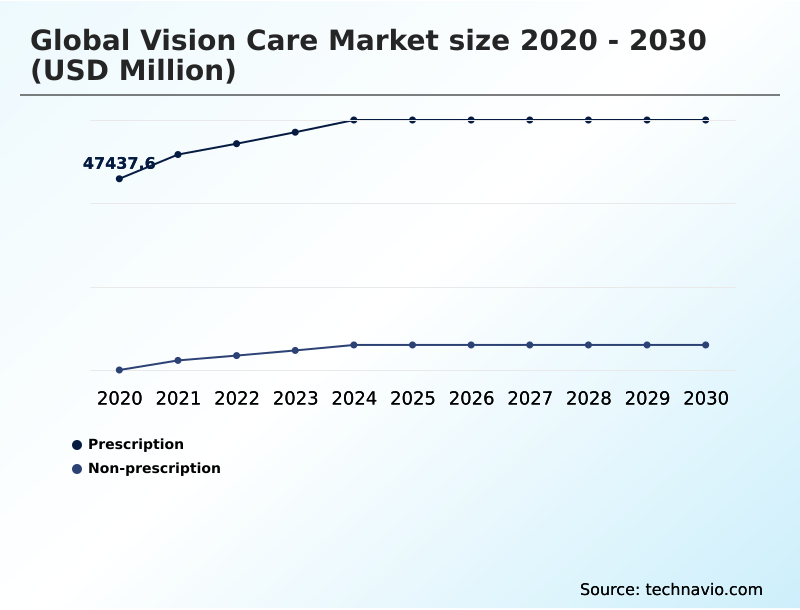
The Prescription segment was valued at USD 56.79 billion in 2024 and showed a gradual increase during the forecast period.
Get Free Sample

Regional Analysis

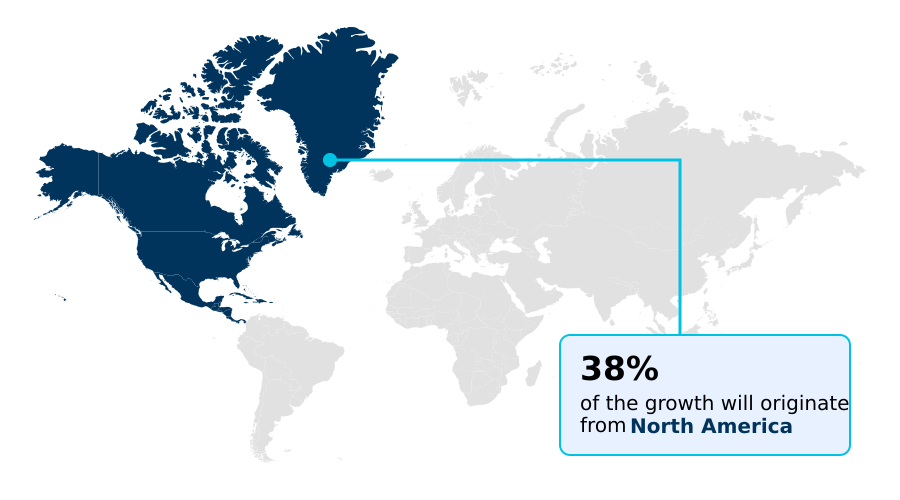
North America is estimated to contribute 37.9% to the growth of the global market during the forecast period.Technavio’s analysts have elaborately explained the regional trends and drivers that shape the market during the forecast period.
See How Vision Care Market Demand is Rising in North America Get Free Sample

Regional disparities in optical infrastructure fundamentally dictate the adoption rates of advanced ophthalmic technologies. Because North America possesses highly integrated clinical networks, the region reports a 30% higher penetration of automated eye exams compared to emerging markets in APAC.

This robust infrastructure accelerates the deployment of ophthalmic diagnostic devices and non invasive screening tools. Conversely, countries relying heavily on traditional optometry experience delayed uptake of precision ophthalmic optics and photochromic lens technology.

As equatorial regions face elevated solar radiation, the localized demand for uv protective eyewear increases, shifting regional optical retail dispensing priorities. Intraocular lens implantation procedures are 20% more frequent in European healthcare systems due to comprehensive public health subsidies.

Consequently, targeted astigmatism correction strategies vary significantly, forcing manufacturers to adapt localized supply chains.

Market Dynamics

Our researchers analyzed the data with 2025 as the base year, along with the key drivers, trends, and challenges. A holistic analysis of drivers will help companies refine their marketing strategies to gain a competitive advantage.

  • The Vision Care market is systematically evolving to address the complex visual demands of a digitally dependent global population. As occupational screen exposure reaches unprecedented levels, manufacturers are shifting production priorities toward ergonomic and protective optical solutions.
  • The deployment of digital eye strain relief eyewear has become a critical operational focus, yielding a 35% improvement in visual comfort metrics when compared to standard untreated lenses. This structural transition compels optical laboratories to expand their coating capabilities, specifically increasing the throughput of premium blue light filtering lenses to meet robust retail demand.
  • Simultaneously, demographic shifts and earlier onset of refractive errors require highly specialized interventions. Clinical networks are heavily investing in diagnostic precision to support the accurate fabrication of astigmatism correction custom contact lenses, reducing patient adaptation periods by roughly 20%.
  • Furthermore, the rising incidence of juvenile refractive conditions has accelerated the distribution of pediatric myopia control progressive lenses, transforming early-stage optometric care into a proactive disease management workflow. In the surgical sector, operating theaters are leveraging advanced biometric imaging to enhance intraocular lens surgery optical outcomes, minimizing postoperative corrective dependencies.
  • By optimizing these targeted manufacturing and clinical pathways, the industry ensures greater compliance with stringent medical standards while simultaneously addressing the personalized lifestyle requirements of modern consumers.
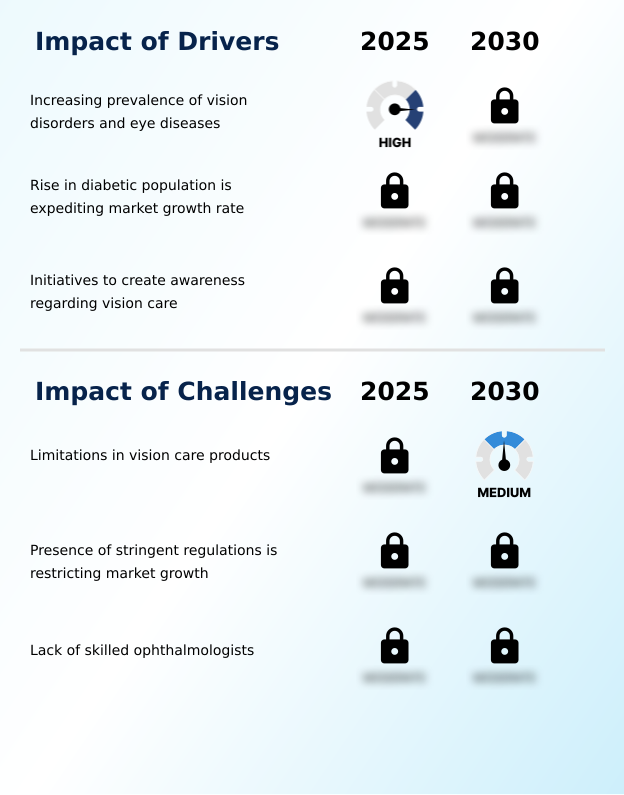
What are the key market drivers leading to the rise in the adoption of Vision Care Industry?

  • The increasing prevalence of vision disorders and eye diseases serves as the primary driver of the market.

  • Surging rates of digital eye strain are compelling optical manufacturers to scale the production of targeted corrective solutions.
  • As remote work environments proliferate, the demand for ocular surface health management has grown, reducing reported workplace eye fatigue by 40% among frequent users. This behavioral shift drives the rapid adoption of premium progressive lenses and specialized myopia control solutions.
  • Pediatric myopia progression acts as a critical catalyst, pushing clinics to emphasize early intervention. Because patients seek enhanced visual clarity, the uptake of high index polymer materials paired with anti-reflective optical coatings has accelerated.
  • Laser vision correction volumes have consequently risen by 15% as patients seek permanent alternatives. Furthermore, custom corneal shaping allows for precise therapeutic interventions, ensuring sustained demand across the medical optical sector.

What are the market trends shaping the Vision Care Industry?

  • Advancements in technology and surgeries related to vision correction constitute an upcoming market trend.

  • The vision care sector is rapidly shifting toward personalized interventions as practitioners adopt smart lens integration to address complex ocular profiles. Because consumer reliance on digital screens has surged, manufacturers are prioritizing blue light filtering alongside visual fatigue reduction.
  • Optical coherence tomography is increasingly utilized in clinics, leading to a 35% improvement in refractive error diagnosis accuracy compared to traditional methods. Advanced multifocal designs are replacing standard options, providing better presbyopia management for aging demographics. By implementing personalized lens fitting protocols and preventive ocular screening, optical centers experience a 20% increase in patient retention.
  • This integration of binocular vision optimization directly elevates clinical outcomes, reducing the need for repeated prescription adjustments.

What challenges does the Vision Care Industry face during its growth?

  • Limitations in vision care products remain a critical challenge restraining overall industry growth.

  • Structural limitations in advanced optical manufacturing severely constrain the widespread availability of specialized corrective devices. Because custom eyewear fabrication requires highly precise calibration, production cycles for therapeutic eye care solutions remain 25% longer than mass-market alternatives. Ensuring optimal contact lens breathability using advanced silicone hydrogel materials increases material costs, directly impacting the affordability of continuous wear lenses.
  • Tear film stability remains a critical physiological barrier, often necessitating supplementary dry eye therapeutics and artificial tear formulations to maintain patient comfort. Furthermore, variations in visual acuity assessment standards across different clinical environments can compromise surgical outcomes in laser refractive suites. These compounding physiological and manufacturing challenges delay the seamless delivery of high-performance vision correction products to price-sensitive demographics.

Exclusive Technavio Analysis on Customer Landscape

The vision care market forecasting report includes the adoption lifecycle of the market, covering from the innovator’s stage to the laggard’s stage. It focuses on adoption rates in different regions based on penetration. Furthermore, the vision care market report also includes key purchase criteria and drivers of price sensitivity to help companies evaluate and develop their market growth analysis strategies.
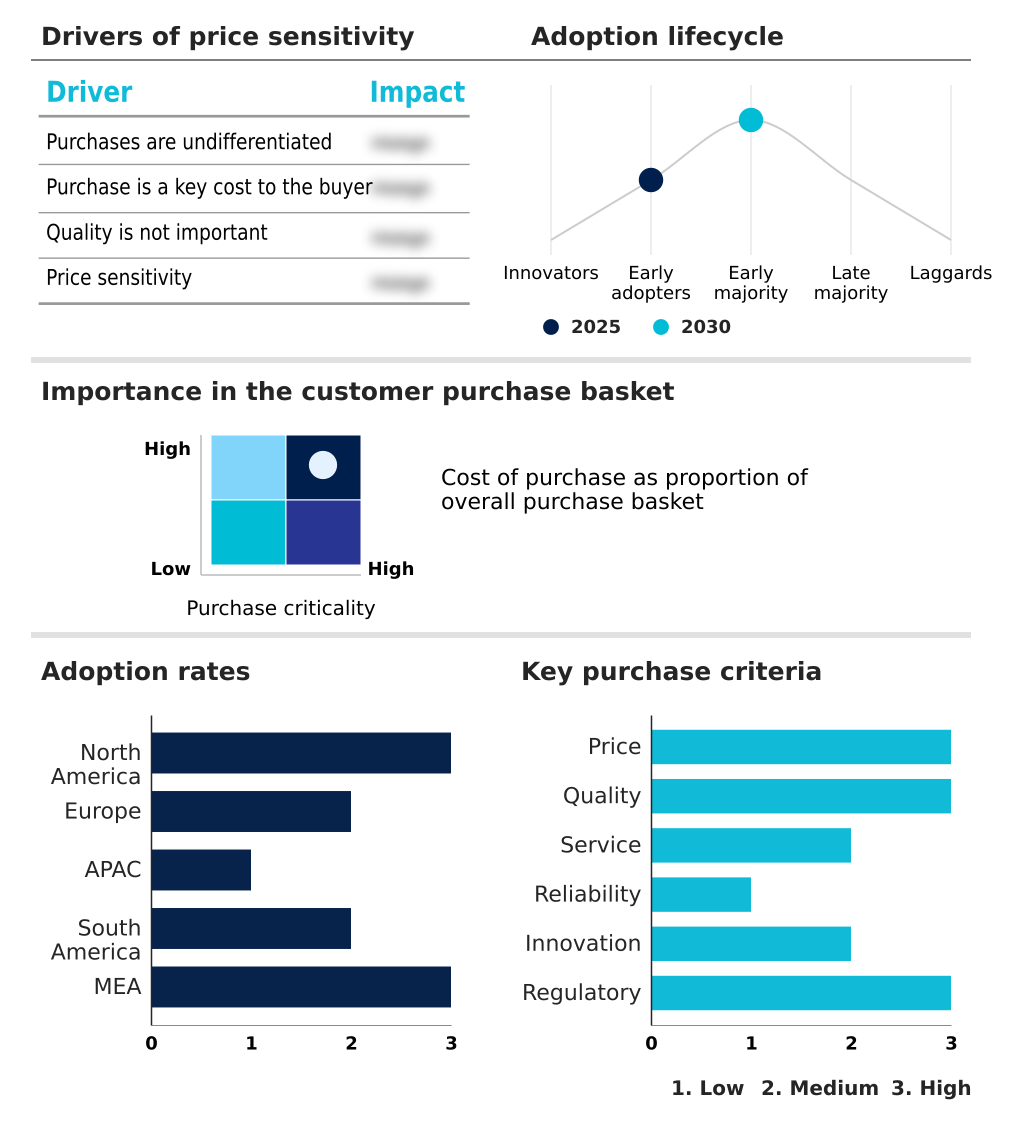
Customer Landscape of Vision Care Industry

Competitive Landscape

Companies are implementing various strategies, such as strategic alliances, vision care market forecast, partnerships, mergers and acquisitions, geographical expansion, and product/service launches, to enhance their presence in the industry.

Alcon Inc. - Alcon provides advanced vision care solutions including daily and extended-wear contact lenses alongside specialized eye drops designed to enhance ocular hydration and optimize visual clarity for diverse patient needs.

The industry research and growth report includes detailed analyses of the competitive landscape of the market and information about key companies, including:

  • Alcon Inc.
  • Bausch Health Co Inc.
  • Carl Zeiss AG
  • EssilorLuxottica
  • Ginko International Co. Ltd.
  • Hoya Corp.
  • Johnson and Johnson
  • Menicon Co. Ltd.
  • Mojo Vision Inc.
  • NIDEK Co. Ltd.
  • Ophtec BV
  • SAV IOL SA
  • SEED Co. Ltd.
  • Seiko Holdings Corp.
  • Shanghai Conant Optical Co.
  • St. Shine Optical Co. Ltd.
  • SynergEyes Inc.
  • The Cooper Co Inc.
  • UltraVision CLPL
  • Visioneering Technologies Inc.

Qualitative and quantitative analysis of companies has been conducted to help clients understand the wider business environment as well as the strengths and weaknesses of key industry players. Data is qualitatively analyzed to categorize companies as pure play, category-focused, industry-focused, and diversified; it is quantitatively analyzed to categorize companies as dominant, leading, strong, tentative, and weak.

Recent Development and News in Vision care market

  • In the Health Care Supplies industry, the transition toward hydrometallurgical recycling for medical device components has reduced raw material waste by 20%, directly impacting Vision Care demand by lowering the production costs of laser refractive suites, smart lens integration systems, and custom eyewear fabrication.
  • Strict enforcement of the EU Medical Device Regulation has increased compliance overhead by 25% for surgical instrument manufacturers, directly impacting Vision Care supply chains by delaying the approval of continuous wear lenses, advanced therapeutic eye care solutions, and artificial tear formulations.
  • The rapid expansion of additive manufacturing in precision medical prosthetics has decreased prototyping time by 30%, directly impacting Vision Care production by enabling faster commercialization of high index polymer materials, anti-reflective optical coatings, and custom uv protective eyewear.
  • Rising investments in automated sterile packaging lines have improved contamination control by 18%, directly impacting Vision Care operations by ensuring the safe mass distribution of ophthalmic solutions that maintain contact lens breathability, support preventive ocular screening safety, and enhance ocular surface health.

Dive into Technavio’s robust research methodology, blending expert interviews, extensive data synthesis, and validated models for unparalleled Vision Care Market insights. See full methodology.

Market Scope
Page number 309
Base year 2025
Historic period 2020-2024
Forecast period 2026-2030
Growth momentum & CAGR Accelerate at a CAGR of 4.1%
Market growth 2026-2030 USD 18034.1 million
Market structure Fragmented
YoY growth 2025-2026(%) 3.9%
Key countries US, Canada, Mexico, Germany, France, Italy, UK, Spain, The Netherlands, China, Japan, India, South Korea, Australia, Indonesia, Brazil, Argentina, Chile, Saudi Arabia, UAE, South Africa, Israel and Turkey
Competitive landscape Leading Companies, Market Positioning of Companies, Competitive Strategies, and Industry Risks

Request Free Sample

Research Analyst Overview

  • The Vision Care market is fundamentally restructuring its service delivery models to accommodate the rising complexity of visual health requirements. A pivotal trend influencing boardroom-level product strategy is the integration of artificial intelligence in optical diagnostics, which enables manufacturers to develop highly customized therapeutic lenses.
  • Because algorithmic mapping identifies microscopic corneal variations, optical laboratories have achieved a 30% reduction in processing time for specialized prescription eyewear. This operational enhancement directly mitigates supply chain bottlenecks and improves overall retail throughput. Additionally, the transition toward sustainable frame materials requires executives to overhaul procurement compliance protocols, ensuring that new environmental standards do not disrupt manufacturing timelines.
  • The continuous evolution of laser-assisted refractive procedures demands rigorous regulatory alignment, compelling clinical directors to upgrade surgical infrastructure proactively. By streamlining the alignment between advanced biometric screening and precision lens fabrication, optical enterprises successfully reduce material waste while enhancing clinical efficacy.
  • These strategic adjustments ensure that vision care providers maintain stringent quality controls while rapidly scaling their advanced diagnostic and corrective product portfolios.

What are the Key Data Covered in this Vision Care Market Research and Growth Report?

  • What is the expected growth of the Vision Care Market between 2026 and 2030?

    • USD 18.03 billion, at a CAGR of 4.1%

  • What segmentation does the market report cover?

    • The report is segmented by Type (Prescription, and Non-prescription), Product (Glass lens, Contact lens, Intraocular lenses, Contact lens solution, and Others), Distribution Channel (Offline, and Online), Price (Mass, and Premium) and Geography (North America, Europe, APAC, South America, Middle East and Africa)

  • Which regions are analyzed in the report?

    • North America, Europe, APAC, South America and Middle East and Africa

  • What are the key growth drivers and market challenges?

    • Increasing prevalence of vision disorders and eye diseases, Limitations in vision care products

  • Who are the major players in the Vision Care Market?

    • Alcon Inc., Bausch Health Co Inc., Carl Zeiss AG, EssilorLuxottica, Ginko International Co. Ltd., Hoya Corp., Johnson and Johnson, Menicon Co. Ltd., Mojo Vision Inc., NIDEK Co. Ltd., Ophtec BV, SAV IOL SA, SEED Co. Ltd., Seiko Holdings Corp., Shanghai Conant Optical Co., St. Shine Optical Co. Ltd., SynergEyes Inc., The Cooper Co Inc., UltraVision CLPL and Visioneering Technologies Inc.

Market Research Insights

  • The Vision Care market is undergoing a rapid technological transformation as clinical providers integrate advanced diagnostics to elevate patient outcomes. By deploying digital refractometry tools, modern optometry clinics have improved diagnostic accuracy by 25%, drastically minimizing prescription remakes. The shift toward non invasive screening protocols allows healthcare networks to process patient volumes 30% faster than traditional examination methods.
  • This operational efficiency is essential for accommodating the rising demand for precision ophthalmic optics. Furthermore, implementing automated eye exams reduces practitioner workload by 18%, freeing up resources for complex therapeutic interventions.
  • As supply chains adapt to these high-volume clinical demands, the seamless delivery of customized optical solutions continues to drive substantial improvements in both operational cost reduction and long-term ocular surface health management.

We can help! Our analysts can customize this vision care market research report to meet your requirements.

Get in touch

1. Executive Summary

1.1 Market overview

Executive Summary - Chart on Market Overview
Executive Summary - Data Table on Market Overview
Executive Summary - Chart on Global Market Characteristics
Executive Summary - Chart on Market by Geography
Executive Summary - Chart on Market Segmentation by Type
Executive Summary - Chart on Market Segmentation by Product
Executive Summary - Chart on Market Segmentation by Distribution Channel
Executive Summary - Chart on Market Segmentation by Price
Executive Summary - Chart on Incremental Growth
Executive Summary - Data Table on Incremental Growth
Executive Summary - Chart on Company Market Positioning

2. Technavio Analysis

2.1 Analysis of price sensitivity, lifecycle, customer purchase basket, adoption rates, and purchase criteria

2.2 Criticality of inputs and Factors of differentiation

Chart on Overview on criticality of inputs and factors of differentiation

2.3 Factors of disruption

Chart on Overview on factors of disruption

2.4 Impact of drivers and challenges

Chart on Impact of drivers and challenges in 2025 and 2030

3. Market Landscape

3.1 Market ecosystem

Chart on Parent Market
Data Table on - Parent Market

3.2 Market characteristics

Chart on Market characteristics analysis

3.3 Value chain analysis

Chart on Value chain analysis

4. Market Sizing

4.1 Market definition

Data Table on Offerings of companies included in the market definition

4.2 Market segment analysis

Market segments

4.3 Market size 2025

4.4 Market outlook: Forecast for 2025-2030

Chart on Global - Market size and forecast 2025-2030 ($ million)
Data Table on Global - Market size and forecast 2025-2030 ($ million)
Chart on Global Market: Year-over-year growth 2025-2030 (%)
Data Table on Global Market: Year-over-year growth 2025-2030 (%)

5. Historic Market Size

5.1 Global Vision Care Market 2020 - 2024

Historic Market Size - Data Table on Global Vision Care Market 2020 - 2024 ($ million)

5.2 Type segment analysis 2020 - 2024

Historic Market Size - Type Segment 2020 - 2024 ($ million)

5.3 Product segment analysis 2020 - 2024

Historic Market Size - Product Segment 2020 - 2024 ($ million)

5.4 Distribution Channel segment analysis 2020 - 2024

Historic Market Size - Distribution Channel Segment 2020 - 2024 ($ million)

5.5 Price segment analysis 2020 - 2024

Historic Market Size - Price Segment 2020 - 2024 ($ million)

5.6 Geography segment analysis 2020 - 2024

Historic Market Size - Geography Segment 2020 - 2024 ($ million)

5.7 Country segment analysis 2020 - 2024

Historic Market Size - Country Segment 2020 - 2024 ($ million)

6. Qualitative Analysis

6.1 Impact of AI in Global Vision Care Market

6.2 Impact of Geopolitical Conflicts in Global Vision Care Market

7. Five Forces Analysis

7.1 Five forces summary

Five forces analysis - Comparison between 2025 and 2030

7.2 Bargaining power of buyers

Bargaining power of buyers - Impact of key factors 2025 and 2030

7.3 Bargaining power of suppliers

Bargaining power of suppliers - Impact of key factors in 2025 and 2030

7.4 Threat of new entrants

Threat of new entrants - Impact of key factors in 2025 and 2030

7.5 Threat of substitutes

Threat of substitutes - Impact of key factors in 2025 and 2030

7.6 Threat of rivalry

Threat of rivalry - Impact of key factors in 2025 and 2030

7.7 Market condition

Chart on Market condition - Five forces 2025 and 2030

8. Market Segmentation by Type

8.1 Market segments

Chart on Type - Market share 2025-2030 (%)
Data Table on Type - Market share 2025-2030 (%)

8.2 Comparison by Type

Chart on Comparison by Type
Data Table on Comparison by Type

8.3 Prescription - Market size and forecast 2025-2030

Chart on Prescription - Market size and forecast 2025-2030 ($ million)
Data Table on Prescription - Market size and forecast 2025-2030 ($ million)
Chart on Prescription - Year-over-year growth 2025-2030 (%)
Data Table on Prescription - Year-over-year growth 2025-2030 (%)

8.4 Non-prescription - Market size and forecast 2025-2030

Chart on Non-prescription - Market size and forecast 2025-2030 ($ million)
Data Table on Non-prescription - Market size and forecast 2025-2030 ($ million)
Chart on Non-prescription - Year-over-year growth 2025-2030 (%)
Data Table on Non-prescription - Year-over-year growth 2025-2030 (%)

8.5 Market opportunity by Type

Market opportunity by Type ($ million)
Data Table on Market opportunity by Type ($ million)

9. Market Segmentation by Product

9.1 Market segments

Chart on Product - Market share 2025-2030 (%)
Data Table on Product - Market share 2025-2030 (%)

9.2 Comparison by Product

Chart on Comparison by Product
Data Table on Comparison by Product

9.3 Glass lens - Market size and forecast 2025-2030

Chart on Glass lens - Market size and forecast 2025-2030 ($ million)
Data Table on Glass lens - Market size and forecast 2025-2030 ($ million)
Chart on Glass lens - Year-over-year growth 2025-2030 (%)
Data Table on Glass lens - Year-over-year growth 2025-2030 (%)

9.4 Contact lens - Market size and forecast 2025-2030

Chart on Contact lens - Market size and forecast 2025-2030 ($ million)
Data Table on Contact lens - Market size and forecast 2025-2030 ($ million)
Chart on Contact lens - Year-over-year growth 2025-2030 (%)
Data Table on Contact lens - Year-over-year growth 2025-2030 (%)

9.5 Intraocular lenses - Market size and forecast 2025-2030

Chart on Intraocular lenses - Market size and forecast 2025-2030 ($ million)
Data Table on Intraocular lenses - Market size and forecast 2025-2030 ($ million)
Chart on Intraocular lenses - Year-over-year growth 2025-2030 (%)
Data Table on Intraocular lenses - Year-over-year growth 2025-2030 (%)

9.6 Contact lens solution - Market size and forecast 2025-2030

Chart on Contact lens solution - Market size and forecast 2025-2030 ($ million)
Data Table on Contact lens solution - Market size and forecast 2025-2030 ($ million)
Chart on Contact lens solution - Year-over-year growth 2025-2030 (%)
Data Table on Contact lens solution - Year-over-year growth 2025-2030 (%)

9.7 Others - Market size and forecast 2025-2030

Chart on Others - Market size and forecast 2025-2030 ($ million)
Data Table on Others - Market size and forecast 2025-2030 ($ million)
Chart on Others - Year-over-year growth 2025-2030 (%)
Data Table on Others - Year-over-year growth 2025-2030 (%)

9.8 Market opportunity by Product

Market opportunity by Product ($ million)
Data Table on Market opportunity by Product ($ million)

10. Market Segmentation by Distribution Channel

10.1 Market segments

Chart on Distribution Channel - Market share 2025-2030 (%)
Data Table on Distribution Channel - Market share 2025-2030 (%)

10.2 Comparison by Distribution Channel

Chart on Comparison by Distribution Channel
Data Table on Comparison by Distribution Channel

10.3 Offline - Market size and forecast 2025-2030

Chart on Offline - Market size and forecast 2025-2030 ($ million)
Data Table on Offline - Market size and forecast 2025-2030 ($ million)
Chart on Offline - Year-over-year growth 2025-2030 (%)
Data Table on Offline - Year-over-year growth 2025-2030 (%)

10.4 Online - Market size and forecast 2025-2030

Chart on Online - Market size and forecast 2025-2030 ($ million)
Data Table on Online - Market size and forecast 2025-2030 ($ million)
Chart on Online - Year-over-year growth 2025-2030 (%)
Data Table on Online - Year-over-year growth 2025-2030 (%)

10.5 Market opportunity by Distribution Channel

Market opportunity by Distribution Channel ($ million)
Data Table on Market opportunity by Distribution Channel ($ million)

11. Market Segmentation by Price

11.1 Market segments

Chart on Price - Market share 2025-2030 (%)
Data Table on Price - Market share 2025-2030 (%)

11.2 Comparison by Price

Chart on Comparison by Price
Data Table on Comparison by Price

11.3 Mass - Market size and forecast 2025-2030

Chart on Mass - Market size and forecast 2025-2030 ($ million)
Data Table on Mass - Market size and forecast 2025-2030 ($ million)
Chart on Mass - Year-over-year growth 2025-2030 (%)
Data Table on Mass - Year-over-year growth 2025-2030 (%)

11.4 Premium - Market size and forecast 2025-2030

Chart on Premium - Market size and forecast 2025-2030 ($ million)
Data Table on Premium - Market size and forecast 2025-2030 ($ million)
Chart on Premium - Year-over-year growth 2025-2030 (%)
Data Table on Premium - Year-over-year growth 2025-2030 (%)

11.5 Market opportunity by Price

Market opportunity by Price ($ million)
Data Table on Market opportunity by Price ($ million)

12. Customer Landscape

12.1 Customer landscape overview

Analysis of price sensitivity, lifecycle, customer purchase basket, adoption rates, and purchase criteria

13. Geographic Landscape

13.1 Geographic segmentation

Chart on Market share by geography 2025-2030 (%)
Data Table on Market share by geography 2025-2030 (%)

13.2 Geographic comparison

Chart on Geographic comparison
Data Table on Geographic comparison

13.3 North America - Market size and forecast 2025-2030

Chart on North America - Market size and forecast 2025-2030 ($ million)
Data Table on North America - Market size and forecast 2025-2030 ($ million)
Chart on North America - Year-over-year growth 2025-2030 (%)
Data Table on North America - Year-over-year growth 2025-2030 (%)
Chart on Regional Comparison - North America
Data Table on Regional Comparison - North America

13.3.1 US - Market size and forecast 2025-2030

Chart on US - Market size and forecast 2025-2030 ($ million)
Data Table on US - Market size and forecast 2025-2030 ($ million)
Chart on US - Year-over-year growth 2025-2030 (%)
Data Table on US - Year-over-year growth 2025-2030 (%)

13.3.2 Canada - Market size and forecast 2025-2030

Chart on Canada - Market size and forecast 2025-2030 ($ million)
Data Table on Canada - Market size and forecast 2025-2030 ($ million)
Chart on Canada - Year-over-year growth 2025-2030 (%)
Data Table on Canada - Year-over-year growth 2025-2030 (%)

13.3.3 Mexico - Market size and forecast 2025-2030

Chart on Mexico - Market size and forecast 2025-2030 ($ million)
Data Table on Mexico - Market size and forecast 2025-2030 ($ million)
Chart on Mexico - Year-over-year growth 2025-2030 (%)
Data Table on Mexico - Year-over-year growth 2025-2030 (%)

13.4 Europe - Market size and forecast 2025-2030

Chart on Europe - Market size and forecast 2025-2030 ($ million)
Data Table on Europe - Market size and forecast 2025-2030 ($ million)
Chart on Europe - Year-over-year growth 2025-2030 (%)
Data Table on Europe - Year-over-year growth 2025-2030 (%)
Chart on Regional Comparison - Europe
Data Table on Regional Comparison - Europe

13.4.1 Germany - Market size and forecast 2025-2030

Chart on Germany - Market size and forecast 2025-2030 ($ million)
Data Table on Germany - Market size and forecast 2025-2030 ($ million)
Chart on Germany - Year-over-year growth 2025-2030 (%)
Data Table on Germany - Year-over-year growth 2025-2030 (%)

13.4.2 France - Market size and forecast 2025-2030

Chart on France - Market size and forecast 2025-2030 ($ million)
Data Table on France - Market size and forecast 2025-2030 ($ million)
Chart on France - Year-over-year growth 2025-2030 (%)
Data Table on France - Year-over-year growth 2025-2030 (%)

13.4.3 Italy - Market size and forecast 2025-2030

Chart on Italy - Market size and forecast 2025-2030 ($ million)
Data Table on Italy - Market size and forecast 2025-2030 ($ million)
Chart on Italy - Year-over-year growth 2025-2030 (%)
Data Table on Italy - Year-over-year growth 2025-2030 (%)

13.4.4 UK - Market size and forecast 2025-2030

Chart on UK - Market size and forecast 2025-2030 ($ million)
Data Table on UK - Market size and forecast 2025-2030 ($ million)
Chart on UK - Year-over-year growth 2025-2030 (%)
Data Table on UK - Year-over-year growth 2025-2030 (%)

13.4.5 Spain - Market size and forecast 2025-2030

Chart on Spain - Market size and forecast 2025-2030 ($ million)
Data Table on Spain - Market size and forecast 2025-2030 ($ million)
Chart on Spain - Year-over-year growth 2025-2030 (%)
Data Table on Spain - Year-over-year growth 2025-2030 (%)

13.4.6 The Netherlands - Market size and forecast 2025-2030

Chart on The Netherlands - Market size and forecast 2025-2030 ($ million)
Data Table on The Netherlands - Market size and forecast 2025-2030 ($ million)
Chart on The Netherlands - Year-over-year growth 2025-2030 (%)
Data Table on The Netherlands - Year-over-year growth 2025-2030 (%)

13.5 APAC - Market size and forecast 2025-2030

Chart on APAC - Market size and forecast 2025-2030 ($ million)
Data Table on APAC - Market size and forecast 2025-2030 ($ million)
Chart on APAC - Year-over-year growth 2025-2030 (%)
Data Table on APAC - Year-over-year growth 2025-2030 (%)
Chart on Regional Comparison - APAC
Data Table on Regional Comparison - APAC

13.5.1 China - Market size and forecast 2025-2030

Chart on China - Market size and forecast 2025-2030 ($ million)
Data Table on China - Market size and forecast 2025-2030 ($ million)
Chart on China - Year-over-year growth 2025-2030 (%)
Data Table on China - Year-over-year growth 2025-2030 (%)

13.5.2 Japan - Market size and forecast 2025-2030

Chart on Japan - Market size and forecast 2025-2030 ($ million)
Data Table on Japan - Market size and forecast 2025-2030 ($ million)
Chart on Japan - Year-over-year growth 2025-2030 (%)
Data Table on Japan - Year-over-year growth 2025-2030 (%)

13.5.3 India - Market size and forecast 2025-2030

Chart on India - Market size and forecast 2025-2030 ($ million)
Data Table on India - Market size and forecast 2025-2030 ($ million)
Chart on India - Year-over-year growth 2025-2030 (%)
Data Table on India - Year-over-year growth 2025-2030 (%)

13.5.4 South Korea - Market size and forecast 2025-2030

Chart on South Korea - Market size and forecast 2025-2030 ($ million)
Data Table on South Korea - Market size and forecast 2025-2030 ($ million)
Chart on South Korea - Year-over-year growth 2025-2030 (%)
Data Table on South Korea - Year-over-year growth 2025-2030 (%)

13.5.5 Australia - Market size and forecast 2025-2030

Chart on Australia - Market size and forecast 2025-2030 ($ million)
Data Table on Australia - Market size and forecast 2025-2030 ($ million)
Chart on Australia - Year-over-year growth 2025-2030 (%)
Data Table on Australia - Year-over-year growth 2025-2030 (%)

13.5.6 Indonesia - Market size and forecast 2025-2030

Chart on Indonesia - Market size and forecast 2025-2030 ($ million)
Data Table on Indonesia - Market size and forecast 2025-2030 ($ million)
Chart on Indonesia - Year-over-year growth 2025-2030 (%)
Data Table on Indonesia - Year-over-year growth 2025-2030 (%)

13.6 South America - Market size and forecast 2025-2030

Chart on South America - Market size and forecast 2025-2030 ($ million)
Data Table on South America - Market size and forecast 2025-2030 ($ million)
Chart on South America - Year-over-year growth 2025-2030 (%)
Data Table on South America - Year-over-year growth 2025-2030 (%)
Chart on Regional Comparison - South America
Data Table on Regional Comparison - South America

13.6.1 Brazil - Market size and forecast 2025-2030

Chart on Brazil - Market size and forecast 2025-2030 ($ million)
Data Table on Brazil - Market size and forecast 2025-2030 ($ million)
Chart on Brazil - Year-over-year growth 2025-2030 (%)
Data Table on Brazil - Year-over-year growth 2025-2030 (%)

13.6.2 Argentina - Market size and forecast 2025-2030

Chart on Argentina - Market size and forecast 2025-2030 ($ million)
Data Table on Argentina - Market size and forecast 2025-2030 ($ million)
Chart on Argentina - Year-over-year growth 2025-2030 (%)
Data Table on Argentina - Year-over-year growth 2025-2030 (%)

13.6.3 Chile - Market size and forecast 2025-2030

Chart on Chile - Market size and forecast 2025-2030 ($ million)
Data Table on Chile - Market size and forecast 2025-2030 ($ million)
Chart on Chile - Year-over-year growth 2025-2030 (%)
Data Table on Chile - Year-over-year growth 2025-2030 (%)

13.7 Middle East and Africa - Market size and forecast 2025-2030

Chart on Middle East and Africa - Market size and forecast 2025-2030 ($ million)
Data Table on Middle East and Africa - Market size and forecast 2025-2030 ($ million)
Chart on Middle East and Africa - Year-over-year growth 2025-2030 (%)
Data Table on Middle East and Africa - Year-over-year growth 2025-2030 (%)
Chart on Regional Comparison - Middle East and Africa
Data Table on Regional Comparison - Middle East and Africa

13.7.1 Saudi Arabia - Market size and forecast 2025-2030

Chart on Saudi Arabia - Market size and forecast 2025-2030 ($ million)
Data Table on Saudi Arabia - Market size and forecast 2025-2030 ($ million)
Chart on Saudi Arabia - Year-over-year growth 2025-2030 (%)
Data Table on Saudi Arabia - Year-over-year growth 2025-2030 (%)

13.7.2 UAE - Market size and forecast 2025-2030

Chart on UAE - Market size and forecast 2025-2030 ($ million)
Data Table on UAE - Market size and forecast 2025-2030 ($ million)
Chart on UAE - Year-over-year growth 2025-2030 (%)
Data Table on UAE - Year-over-year growth 2025-2030 (%)

13.7.3 South Africa - Market size and forecast 2025-2030

Chart on South Africa - Market size and forecast 2025-2030 ($ million)
Data Table on South Africa - Market size and forecast 2025-2030 ($ million)
Chart on South Africa - Year-over-year growth 2025-2030 (%)
Data Table on South Africa - Year-over-year growth 2025-2030 (%)

13.7.4 Israel - Market size and forecast 2025-2030

Chart on Israel - Market size and forecast 2025-2030 ($ million)
Data Table on Israel - Market size and forecast 2025-2030 ($ million)
Chart on Israel - Year-over-year growth 2025-2030 (%)
Data Table on Israel - Year-over-year growth 2025-2030 (%)

13.7.5 Turkey - Market size and forecast 2025-2030

Chart on Turkey - Market size and forecast 2025-2030 ($ million)
Data Table on Turkey - Market size and forecast 2025-2030 ($ million)
Chart on Turkey - Year-over-year growth 2025-2030 (%)
Data Table on Turkey - Year-over-year growth 2025-2030 (%)

13.8 Market opportunity by geography

Market opportunity by geography ($ million)
Data Tables on Market opportunity by geography ($ million)

14. Drivers, Challenges, and Opportunity

14.1 Market drivers

Increasing prevalence of vision disorders and eye diseases
Rise in diabetic population is expediting market growth rate
Initiatives to create awareness regarding vision care

14.2 Market challenges

Limitations in vision care products
Presence of stringent regulations is restricting market growth
Lack of skilled ophthalmologists

14.3 Impact of drivers and challenges

Impact of drivers and challenges in 2025 and 2030

14.4 Market opportunities

Advancements in technology and surgeries related to vision correction
Rise in adoption of online retail channels and e-commerce platforms
Increase in number of mergers and acquisitions is augmenting market growth

15. Competitive Landscape

15.1 Overview

15.2

Overview on criticality of inputs and factors of differentiation

15.3 Landscape disruption

Overview on factors of disruption

15.4 Industry risks

Impact of key risks on business

16. Competitive Analysis

16.1 Companies profiled

Companies covered

16.2 Company ranking index

16.3 Market positioning of companies

Matrix on companies position and classification

16.4 Alcon Inc.

Alcon Inc. - Overview
Alcon Inc. - Business segments
Alcon Inc. - Key offerings
Alcon Inc. - Segment focus
SWOT

16.5 Bausch Health Co Inc.

Bausch Health Co Inc. - Overview
Bausch Health Co Inc. - Business segments
Bausch Health Co Inc. - Key offerings
Bausch Health Co Inc. - Segment focus
SWOT

16.6 Carl Zeiss AG

Carl Zeiss AG - Overview
Carl Zeiss AG - Product / Service
Carl Zeiss AG - Key offerings
SWOT

16.7 EssilorLuxottica

EssilorLuxottica - Overview
EssilorLuxottica - Business segments
EssilorLuxottica - Key offerings
EssilorLuxottica - Segment focus
SWOT

16.8 Hoya Corp.

Hoya Corp. - Overview
Hoya Corp. - Business segments
Hoya Corp. - Key offerings
Hoya Corp. - Segment focus
SWOT

16.9 Johnson and Johnson

Johnson and Johnson - Overview
Johnson and Johnson - Business segments
Johnson and Johnson - Key news
Johnson and Johnson - Key offerings
Johnson and Johnson - Segment focus
SWOT

16.10 NIDEK Co. Ltd.

NIDEK Co. Ltd. - Overview
NIDEK Co. Ltd. - Product / Service
NIDEK Co. Ltd. - Key offerings
SWOT

16.11 SEED Co. Ltd.

SEED Co. Ltd. - Overview
SEED Co. Ltd. - Product / Service
SEED Co. Ltd. - Key offerings
SWOT

16.12 Seiko Holdings Corp.

Seiko Holdings Corp. - Overview
Seiko Holdings Corp. - Business segments
Seiko Holdings Corp. - Key offerings
Seiko Holdings Corp. - Segment focus
SWOT

16.13 Shanghai Conant Optical Co.

Shanghai Conant Optical Co. - Overview
Shanghai Conant Optical Co. - Product / Service
Shanghai Conant Optical Co. - Key offerings
SWOT

16.14 St. Shine Optical Co. Ltd.

St. Shine Optical Co. Ltd. - Overview
St. Shine Optical Co. Ltd. - Product / Service
St. Shine Optical Co. Ltd. - Key offerings
SWOT

16.15 SynergEyes Inc.

SynergEyes Inc. - Overview
SynergEyes Inc. - Product / Service
SynergEyes Inc. - Key offerings
SWOT

16.16 The Cooper Co Inc.

The Cooper Co Inc. - Overview
The Cooper Co Inc. - Business segments
The Cooper Co Inc. - Key offerings
The Cooper Co Inc. - Segment focus
SWOT

16.17 UltraVision CLPL

UltraVision CLPL - Overview
UltraVision CLPL - Product / Service
UltraVision CLPL - Key offerings
SWOT

16.18 Visioneering Technologies Inc.

Visioneering Technologies Inc. - Overview
Visioneering Technologies Inc. - Product / Service
Visioneering Technologies Inc. - Key offerings
SWOT

17. Appendix

17.1 Scope of the report

Market definition
Objectives
Notes and caveats

17.2 Inclusions and exclusions checklist

Inclusions checklist
Exclusions checklist

17.3 Currency conversion rates for US$

17.4 Research methodology

17.5 Data procurement

Information sources

17.6 Data validation

17.7 Validation techniques employed for market sizing

17.8 Data synthesis

17.9 360 degree market analysis

17.10 List of abbreviations

Research Methodology

Technavio presents a detailed picture of the market by way of study, synthesis, and summation of data from multiple sources. The analysts have presented the various facets of the market with a particular focus on identifying the key industry influencers. The data thus presented is comprehensive, reliable, and the result of extensive research, both primary and secondary.

INFORMATION SOURCES

Primary sources

  • Manufacturers and suppliers
  • Channel partners
  • Industry experts
  • Strategic decision makers

Secondary sources

  • Industry journals and periodicals
  • Government data
  • Financial reports of key industry players
  • Historical data
  • Press releases

DATA ANALYSIS

Data Synthesis

  • Collation of data
  • Estimation of key figures
  • Analysis of derived insights

Data Validation

  • Triangulation with data models
  • Reference against proprietary databases
  • Corroboration with industry experts

REPORT WRITING

Qualitative

  • Market drivers
  • Market challenges
  • Market trends
  • Five forces analysis

Quantitative

  • Market size and forecast
  • Market segmentation
  • Geographical insights
  • Competitive landscape

Interested in this report?

Get your sample now to see our research methodology and insights!

Download Now

Frequently Asked Questions

Vision Care market growth will increase by USD 18034.1 million during 2026-2030.

The Vision Care market is expected to grow at a CAGR of 4.1% during 2026-2030.

Vision Care market is segmented by Type (Prescription, Non-prescription) Product (Glass lens, Contact lens, Intraocular lenses, Contact lens solution, Others) Distribution channel (Offline, Online) Price (Mass, Premium)

Alcon Inc., Bausch Health Co Inc., Carl Zeiss AG, EssilorLuxottica, Ginko International Co. Ltd., Hoya Corp., Johnson and Johnson, Menicon Co. Ltd., Mojo Vision Inc., NIDEK Co. Ltd., Ophtec BV, SAV IOL SA, SEED Co. Ltd., Seiko Holdings Corp., Shanghai Conant Optical Co., St. Shine Optical Co. Ltd., SynergEyes Inc., The Cooper Co Inc., UltraVision CLPL, Visioneering Technologies Inc. are a few of the key vendors in the Vision Care market.

North America will register the highest growth rate of 37.9% among the other regions. Therefore, the Vision Care market in North America is expected to garner significant business opportunities for the vendors during the forecast period.

US, Canada, Mexico, Germany, France, Italy, UK, Spain, The Netherlands, China, Japan, India, South Korea, Australia, Indonesia, Brazil, Argentina, Chile, Saudi Arabia, UAE, South Africa, Israel, Turkey

  • Increasing prevalence of vision disorders and eye diseases is the driving factor this market.

The Vision Care market vendors should focus on grabbing business opportunities from the Type segment as it accounted for the largest market share in the base year.
RIA - Research AI Assistant
Ask RIA
