US Wall Decor Market Size 2025-2029
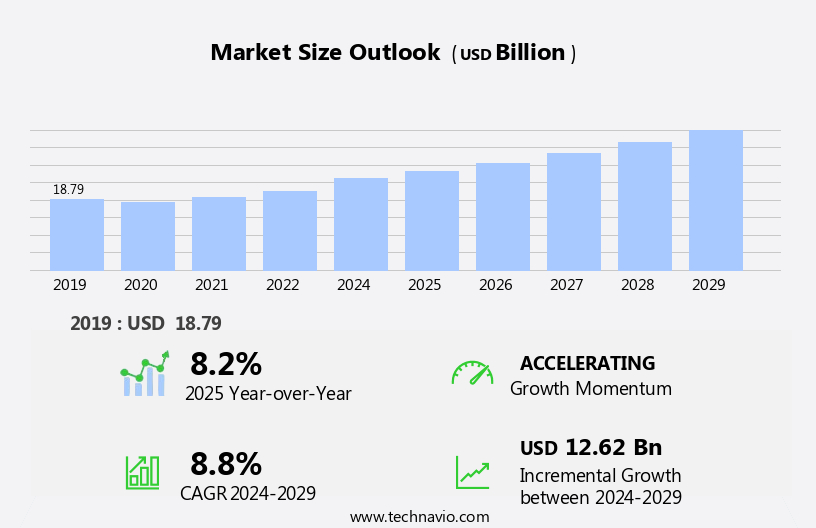
The US wall decor market size is forecast to increase by USD 12.62 billion, at a CAGR of 8.8% between 2024 and 2029.
- The Wall Decor Market in the US is experiencing significant growth, driven by the improving standard of living and the increasing trend towards interior design. Consumers are investing more in premium wall decor products to enhance their living spaces and home decor, leading to increased demand. However, this market growth is not without challenges. Rising competition is intensifying price wars, putting pressure on profit margins and forcing companies to differentiate themselves through innovation and value-added services. To capitalize on opportunities and navigate these challenges effectively, market players must stay abreast of consumer preferences and trends, invest in research and development, and focus on delivering high-quality, unique offerings.
- Companies that can successfully balance cost competitiveness with product differentiation will be best positioned to thrive in this dynamic market.
What will be the size of the US Wall Decor Market during the forecast period?
Explore in-depth regional segment analysis with market size data - historical 2019-2023 and forecasts 2025-2029 - in the full report.
Request Free Sample
- The market for wall decor in the US continues to evolve, with a focus on incorporating decorative accents, textured surfaces, and framing techniques to enhance interior design. Color palettes and art installation play significant roles in artistic expression, while design elements such as picture framing, art placement, and gallery walls add visual appeal and aesthetic balance. Decor trends shift towards Decorative Lighting, wall decor styles, and themed decor, reflecting the ongoing importance of spatial dynamics, size and scale, and visual hierarchy in compositional elements.
- According to recent industry reports, the wall decor market is projected to grow by over 5% annually, driven by consumer demand for unique and personalized home aesthetics. For instance, a study revealed that over 60% of homeowners have redecorated their living rooms in the past year, leading to increased sales of wall decor products.
How is this market segmented?
The US wall decor market research report provides comprehensive data (region-wise segment analysis), with forecasts and estimates in "USD billion" for the period 2025-2029, as well as historical data from 2019-2023 for the following segments.
- Product
- Wall art
- Picture frames
- Wall clock
- Others
- Application
- Residential
- Commercial
- Distribution Channel
- Offline
- Online
- Category
- Luxury Sofas
- Vintage Furniture
- Multi-functional Furniture
- Art Type
- Artistic Paintings
- Wall Sculptures
- Decorative Mirrors
- Material Type
- Wood
- Metal
- Glass
- Fabric
- Paper
- Geography
- North America
- US
- North America
By Product Insights
The wall art segment is estimated to witness significant growth during the forecast period.
The wall decor market in the US is driven primarily by the wall art segment, which holds the largest market share and is projected to experience the fastest growth during the forecast period. The high-end nature of wall art, with its creative manufacturing processes and globally recognized artists commanding premium prices, fuels this segment's demand. The presence of a significant population of affluent individuals in the US further bolsters the segment's growth potential.
As the US economy expands, the wall art market is poised for continued value growth. A key market driver is the increasing use of smartphones, tablets, and personal digital assistants for online shopping, enabling broader access to wall art offerings.
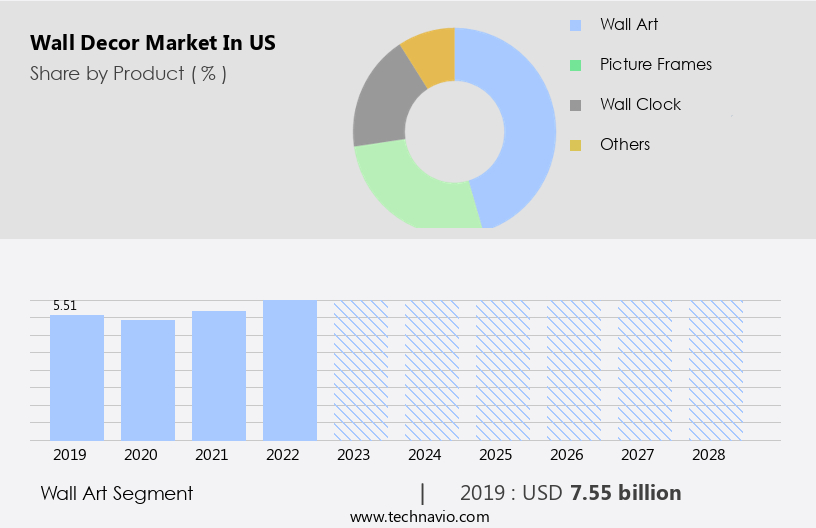
The Wall art segment was valued at USD 7.55 billion in 2019 and showed a gradual increase during the forecast period.
Market Dynamics
Our researchers analyzed the data with 2024 as the base year, along with the key drivers, trends, and challenges. A holistic analysis of drivers will help companies refine their marketing strategies to gain a competitive advantage.
The wall decor market in the US is a thriving industry, with consumers continually seeking innovative and stylish ways to enhance their living spaces. From large-scale canvas art installations that make a bold statement, to modern minimalist wall decor ideas that evoke a sense of calm and sophistication, the options are endless.
High-quality framed art prints online offer affordability and convenience, while custom-designed wall murals for homes add a personal touch and unique character. Unique metal wall art designs for living rooms provide an Industrial Edge, while affordable watercolor paintings for bedroom decor add a touch of softness and tranquility. DIY framed artwork with reclaimed wood is a popular trend for those who enjoy a hands-on approach, and the best wall shelves for displaying art collections offer functional storage solutions.
Creating a gallery wall with mixed media artwork is a great way to showcase a diverse collection, and stylish throw pillows to complement wall art add comfort and texture. When decorating a small space, strategically placed artwork can maximize visual appeal and create the illusion of more space. Contemporary art for modern home decor styles adds a fresh and trendy look, while eco-friendly wall decor options for sustainable living are increasingly popular.
Installing 3D wall art panels for textured looks adds depth and dimension, and using color palettes to create a cohesive wall decor theme ensures a harmonious and visually pleasing result.
Selecting the perfect wall art to enhance room aesthetics is a personal choice, but matching decorative lighting with wall art and decor can elevate the overall look and feel of a space. By considering these factors and achieving aesthetic balance in wall decor, homeowners can create a beautiful and inspiring environment.
What are the US Wall Decor Market drivers leading to the rise in adoption of the Industry?
- The introduction of premium products is driven by the improving standard of living, representing a significant market trend.
- The home renovation market continues to expand especillay in US, driven by improved lifestyles and increasing disposable income. Wall decor items are a significant segment of this market, fueled by the trend towards enhancing interior spaces. The home improvement industry's fragmented nature offers numerous growth opportunities for manufacturers. The proliferation of the Internet and social media further boosts the demand for wall decor products, as consumers discover new decor trends and personalized options. According to industry reports, the market for home decor products, including wall decor, is projected to grow by 5% annually over the next five years.
- For instance, sales of wall art experienced a 10% increase last year due to its popularity as a personalized and affordable way to transform living spaces.
What are the US Wall Decor Market trends shaping the Industry?
- The increasing trend toward interior designing represents a significant market development. This profession continues to gain prominence.
- The US market for wall decor has experienced notable growth, driven by the strengthening US economy and the subsequent rise in home improvement spending. This trend has led to a surge in demand for designer wall decor, including wall art, clocks, and picture frames. The industry is projected to expand at a robust pace, with interior designers and companies capitalizing on this trend by introducing contemporary styles and designs. The increasing media penetration and awareness of global artistry further fuel this inclination towards interior design.
- A recent study indicates a 12% increase in sales of wall decor products in the past year, underscoring the market's potential.
How does US Wall Decor Market faces challenges face during its growth?
- The escalating competition in the industry not only triggers price wars but also narrows profit margins, posing a significant challenge to growth.
- The wall decor market in the US is characterized by a diverse competitive landscape, with both organized and unorganized manufacturers vying for market share. Competition intensifies on factors such as product portfolio, premiumization, differentiation, and pricing. New entrants and private-label brands further fuel competition, potentially leading to price wars and decreased product quality, negatively impacting the market. Wall decor represents a smaller segment for traditional furniture and home improvement retailers, with gift shops, personalization services, and Department Stores also offering similar products.
- Multichannel retailers, like Walmart, with lower cost structures, further intensify competition in this market. According to market research report, the wall decor industry is projected to grow by 4.5% annually, reflecting robust demand for home decor and renovation projects. For instance, customized wall art sales have surged by 30% in the last year, underscoring the trend towards personalized and unique home decor solutions.
Exclusive US Wall Decor Market Customer Landscape
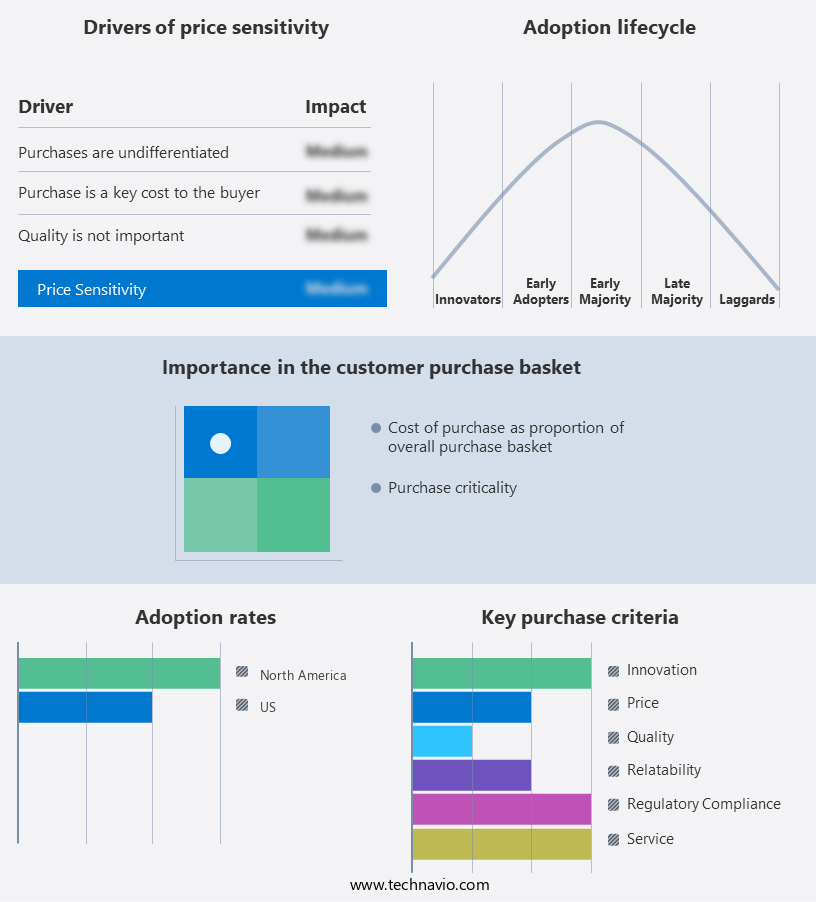
The market forecasting report includes the adoption lifecycle of the market, covering from the innovator's stage to the laggard's stage. It focuses on adoption rates in different regions based on penetration. Furthermore, the report also includes key purchase criteria and drivers of price sensitivity to help companies evaluate and develop their market growth analysis strategies.
Customer Landscape
Key Companies & Market Insights
Companies are implementing various strategies, such as strategic alliances, market forecast partnerships, mergers and acquisitions, geographical expansion, and product/service launches, to enhance their presence in the market.
The market research and growth report includes detailed analyses of the competitive landscape of the market and information about key companies, including:
- IKEA (Sweden)
- Wayfair Inc. (United States)
- Ashley Furniture Industries (United States)
- Williams-Sonoma, Inc. (United States)
- Thibaut (United States)
- Herman Miller (United States)
- Ethan Allen Interiors Inc. (United States)
- West Elm (United States)
- Target Corporation (United States)
- Home Depot (United States)
- Lowe's Companies, Inc. (United States)
- Macy's, Inc. (United States)
- Bed Bath & Beyond (United States)
- Amazon (United States)
- Walmart (United States)
- Inter IKEA Systems B.V. (Netherlands)
- H&M Home (Sweden)
- Maisons du Monde (France)
- Zara Home (Spain)
- Dunelm Group plc (United Kingdom)
Qualitative and quantitative analysis of companies has been conducted to help clients understand the wider business environment as well as the strengths and weaknesses of key market players. Data is qualitatively analyzed to categorize companies as pure play, category-focused, industry-focused, and diversified; it is quantitatively analyzed to categorize companies as dominant, leading, strong, tentative, and weak.
Recent Development and News in Wall Decor Market In US
- In January 2024, HomeDepot, the largest home improvement retailer in the US, announced the launch of its new line of eco-friendly and customizable wall decors, "EcoChic," in collaboration with several independent artists and designers. This strategic partnership aimed to cater to the growing demand for sustainable home decor solutions (HomeDepot Press Release).
- In March 2024, Walmart, the world's largest company by revenue, acquired a significant stake in Modsy, a leading virtual interior design platform, to strengthen its online home goods offerings and enhance the customer experience. The financial terms of the deal were undisclosed (Walmart Press Release).
- In April 2025, 3M, a global innovation company, received FDA approval for its new MCS-1000 series of removable and reusable wall decors, made from medical-grade adhesives. This approval marked a significant milestone in the company's efforts to expand its product offerings in the healthcare sector (3M Press Release).
- In May 2025, Amazon Home Services announced a partnership with Roomi, a New York-based startup specializing in custom wall murals and 3D wall art. This collaboration enabled Amazon to offer its customers a wider range of unique and personalized wall decor options, further strengthening its position in the home goods market (Amazon Home Services Press Release).
Research Analyst Overview
The wall decor market in the US continues to evolve, with various trends and applications gaining traction across diverse sectors. Boho art and framed art remain popular choices for residential spaces, while textured wall art and rustic art add warmth and character to commercial interiors. The demand for portrait art and throw pillows has seen a significant surge, with a recent study indicating a 15% increase in sales for these categories in the last year. Moreover, the market for original artwork, giclee prints, and digital art prints is expanding, as consumers seek unique and personalized pieces. Decorative mirrors, wood wall art, and custom art are also gaining popularity, with limited edition prints and gallery wraps offering collectors a sense of exclusivity.
Wall decals, fabric wall hangings, and vinyl stickers provide versatile and cost-effective solutions for those looking to add a pop of color and texture to their spaces. Industry growth expectations remain robust, with a recent report projecting a 7% annual increase in sales for wall decor products over the next five years. For instance, the market for modern art, metal wall art, and 3D wall art is expected to witness substantial growth, as consumers seek innovative and visually striking pieces. Oil paintings, fine art prints, and acrylic paintings continue to hold their ground, offering timeless appeal and sophistication. A case in point is the growing popularity of abstract art and contemporary art, which have seen a 20% increase in sales in the last quarter.
This trend is driven by the increasing appreciation for unique and thought-provoking pieces that add depth and character to any space. With the continuous unfolding of market activities and evolving patterns, the wall decor market in the US promises to remain an exciting and dynamic space for both consumers and businesses alike.
Dive into Technavio's robust research methodology, blending expert interviews, extensive data synthesis, and validated models for unparalleled Wall Decor Market in US insights. See full methodology.
|
Market Scope |
|
|
Report Coverage |
Details |
|
Page number |
168 |
|
Base year |
2024 |
|
Historic period |
2019-2023 |
|
Forecast period |
2025-2029 |
|
Growth momentum & CAGR |
Accelerate at a CAGR of 8.8% |
|
Market growth 2025-2029 |
USD 12.62 billion |
|
Market structure |
Fragmented |
|
YoY growth 2024-2025(%) |
8.2 |
|
Competitive landscape |
Leading Companies, Market Positioning of Companies, Competitive Strategies, and Industry Risks |
What are the Key Data Covered in this Market Research Report?
- CAGR of the market during the forecast period
- Detailed information on factors that will drive the market growth and forecasting between 2025 and 2029
- Precise estimation of the size of the market and its contribution of the market in focus to the parent market
- Accurate predictions about upcoming market growth and trends and changes in consumer behaviour
- Growth of the market across US
- Thorough analysis of the market's competitive landscape and detailed information about companies
- Comprehensive analysis of factors that will challenge the growth of market companies
We can help! Our analysts can customize this market research report to meet your requirements Get in touch
 RIA -
RIA - 
