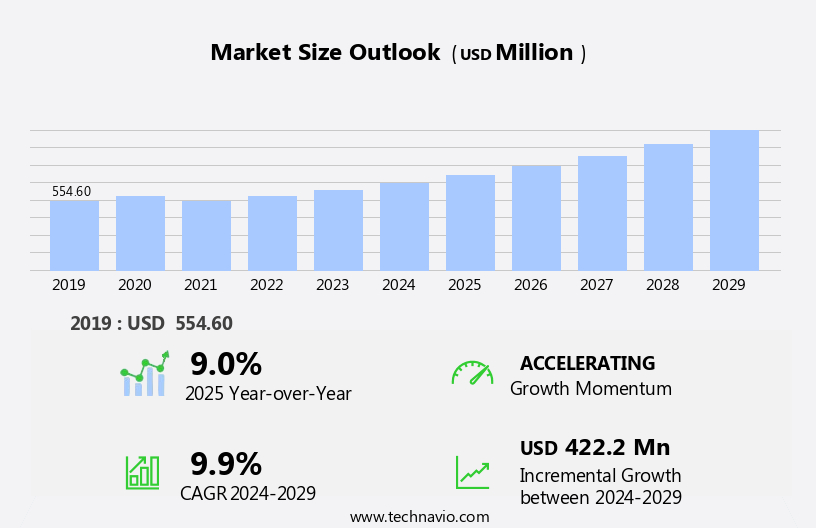
Wasabi Market Size and Forecast 2025-2029
The wasabi market size estimates the market to reach by USD 422.2 million, at a CAGR of 9.9% between 2024 and 2029.APAC is expected to account for 44% of the growth contribution to the global market during this period. In 2019, the sauce segment was valued at USD 287.60 million and has demonstrated steady growth since then.
|
Report Coverage |
Details |
|
Base year |
2024 |
|
Historic period |
2019-2023 |
|
Forecast period |
2025-2029 |
| Market structure | Fragmented |
|
Market growth 2025-2029 |
USD 422.2 million |
- The market is experiencing significant growth, driven by the increasing awareness of its health benefits. Consumers are recognizing the value of wasabi as a natural condiment, known for its antibacterial and anti-inflammatory properties. This trend is translating into rising sales, particularly in the online marketplace. However, the market faces challenges as well. Overuse of wasabi can lead to adverse effects, such as throat irritation and respiratory issues. This presents a potential obstacle for businesses looking to capitalize on the growing demand.
- To navigate this challenge, companies must focus on educating consumers about proper usage and offering alternative solutions for those sensitive to wasabi's potent effects. By addressing these trends and challenges, businesses can effectively tap into the market's potential and position themselves as leaders in the Wasabi industry.
What will be the Size of the Wasabi Market during the forecast period?
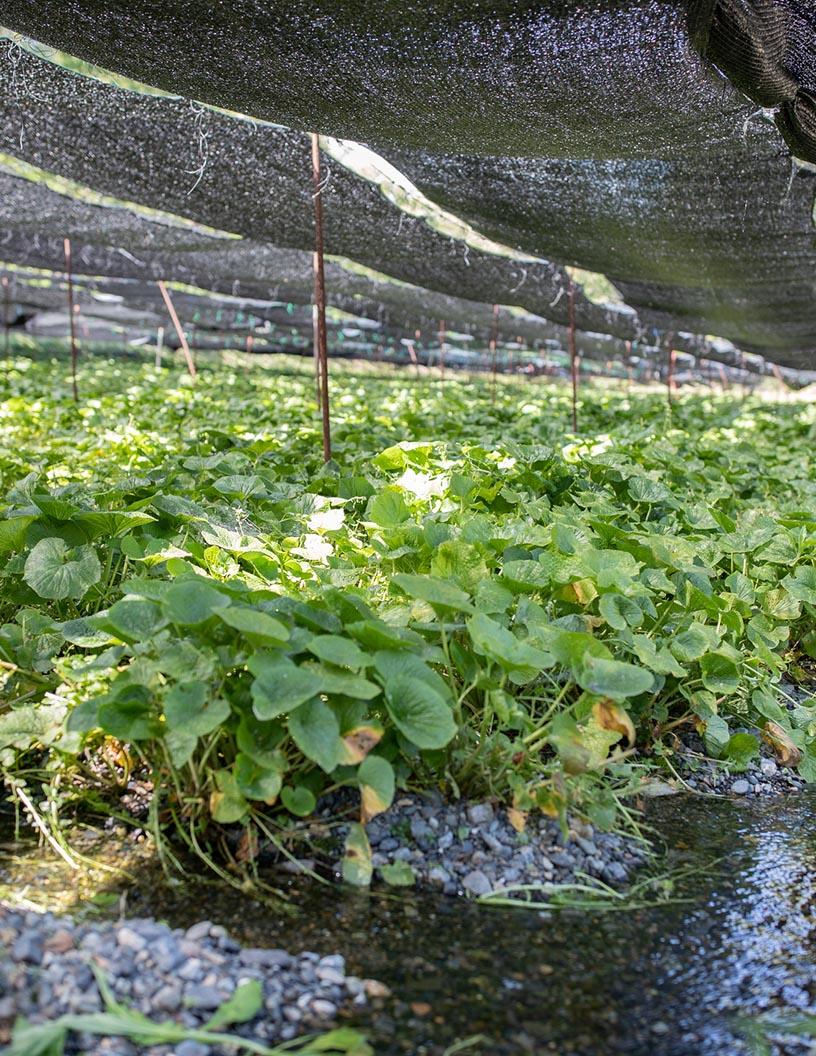
The market continues to evolve, driven by the growing demand for this pungent condiment in various sectors. Sustainable farming practices, such as organic production and precision agriculture, are gaining traction to meet this demand. Wasabi processing methods are also advancing, with a focus on optimizing isothiocyanate levels for enhanced flavor and preservation. Wasabi yield optimization is a critical aspect of the value chain, with farmers exploring new cultivation techniques and nutrient requirements to maximize production. Rhizome development and harvesting techniques are also under scrutiny to ensure optimal quality and consistency. The market pricing reflects the ongoing efforts to improve production efficiency and maintain high-quality standards.
For instance, a leading wasabi farm reported a 15% increase in sales due to the implementation of precision irrigation scheduling and post-harvest handling techniques. Industry growth expectations remain robust, with estimates suggesting a steady expansion of over 10% annually. The focus on wasabi's unique properties, such as its nutrient content and disease resistance, is fueling this growth. Genetic diversity and wasabi leaf physiology are also areas of active research, with potential to unlock new applications and markets. In conclusion, the market is characterized by continuous dynamism, with ongoing research and innovation shaping its various stages, from farming to processing and consumer preference. The commitment to sustainable practices and quality standards is a key driver of growth and differentiation in this competitive landscape.
How is this Wasabi Industry segmented?
The wasabi industry research report provides comprehensive data (region-wise segment analysis), with forecasts and estimates in "USD million" for the period 2025-2029, as well as historical data from 2019-2023 for the following segments.
- Type
- Sauce
- Powder
- Application
- Food and beverages
- Medical and nutraceuticals
- Packaging
- Bottles
- Tubes
- Pouches and Sachets
- Others
- Distribution Channel
- Online Retail
- Offline Retail
- Foodservice
- Geography
- North America
- US
- Canada
- Europe
- France
- Germany
- Russia
- UK
- APAC
- China
- India
- Japan
- South Korea
- Rest of World (ROW)
- North America
By Type Insights
The sauce segment is estimated to witness significant growth during the forecast period.
The market encompasses various stages, from sustainable farming to processing and consumer preference. Sustainable farming practices are essential for wasabi cultivation, ensuring optimal rhizome development and yield. Wasabi processing methods preserve isothiocyanate levels, a key component for wasabi's pungent flavor. Organic production and precision agriculture techniques are gaining popularity, enhancing the value chain and improving quality assessment. Wasabi's unique root morphology and nutrient requirements contribute to its distinct taste and consumer appeal. Cultivation techniques, such as irrigation scheduling and post-harvest handling, significantly impact wasabi yield optimization. Genetic diversity and disease resistance are crucial factors in maintaining a healthy wasabi crop.
The market pricing varies based on factors like organic production, processing methods, and consumer preferences. Wasabi sauce, the most common form, holds a significant market share. Consumers, particularly in the US, prefer wasabi sauce for its ability to add flavor without spoiling food's nutrients. The global trend of exploring diverse culinary experiences is driving the market's growth, with consumers incorporating wasabi into their cuisines. Innovations in wasabi processing and storage methods, such as advanced rhizome development techniques and post-harvest handling, are shaping the market's future. Overall, the market is evolving, with a focus on enhancing quality, sustainability, and consumer preferences.
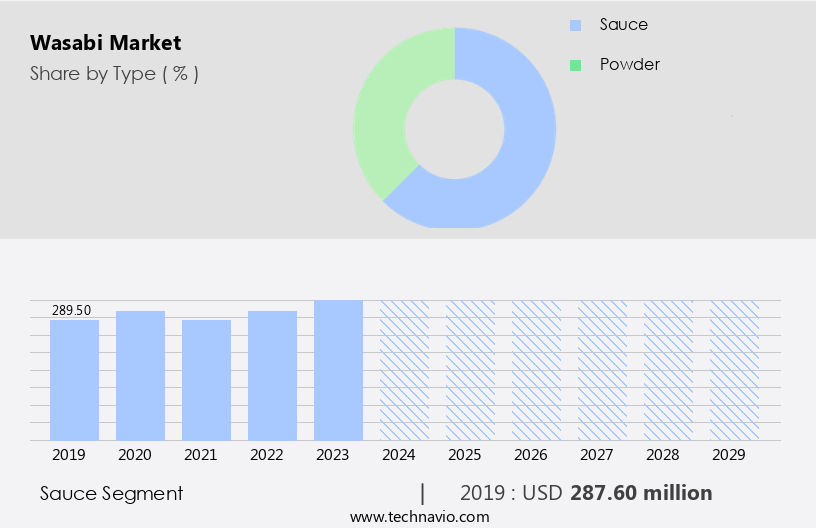
As of 2019, the Sauce segment estimated at USD 287.60 million, and it is forecast to see a moderate upward trend through the forecast period.
Regional Analysis
During the forecast period, APAC is projected to contribute 44% to the overall growth of the global market. Technavio's analysts have elaborately explained the regional trends and drivers that shape the market during the forecast period.
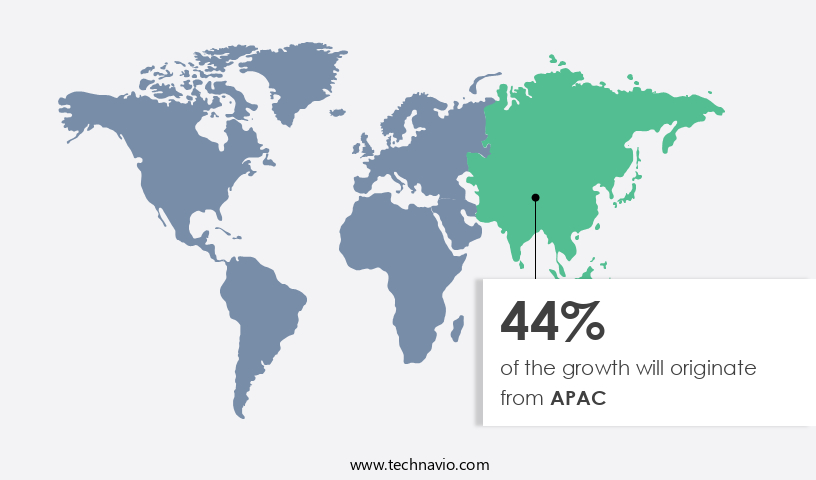
Wasabi, a pungent Japanese horseradish, is experiencing growth in the Asia Pacific (APAC) region due to increasing consumer preferences and sustainable farming practices. The market value chain encompasses cultivation techniques, nutrient requirements, and rhizome development, leading to optimal wasabi yield. Sustainable farming methods ensure the preservation of wasabi's unique characteristics, including isothiocyanate levels and root morphology. Processing methods maintain wasabi's quality, while organic production adheres to strict standards. Genetic diversity and disease resistance are crucial for wasabi cultivation in precision agriculture. Consumers' preferences for organic and locally sourced produce contribute to the market's growth. Irrigation scheduling and storage methods ensure optimal conditions for wasabi's rhizome development.
In 2024, Japan led APAC's wasabi consumption, followed by China and Australia. The region's economic growth and rising disposable income, particularly in China and India, will fuel the market's expansion. For instance, China's per capita income rose from USD 6,641 in 2020 to USD 12,614 in 2023. This income growth will lead to an increase in demand for high-quality wasabi during the forecast period.
Market Dynamics
Our researchers analyzed the data with 2024 as the base year, along with the key drivers, trends, and challenges. A holistic analysis of drivers will help companies refine their marketing strategies to gain a competitive advantage.
Growers are increasingly focused on optimizing irrigation for wasabi growth and studying the effects of temperature on wasabi pungency to boost product quality. Understanding microbial interactions in wasabi rhizosphere and using techniques for enhancing wasabi rhizome size contribute to yield improvements. Disease management includes managing fungal diseases in wasabi cultivation and biological control of wasabi pests and diseases. Environmental factors like the impact of shade on wasabi growth and development and impact of climate change on wasabi cultivation are also critical. Researchers are advancing genetic analysis of wasabi pungent compound and development of disease resistant wasabi varieties, while also exploring influence of soil nutrients on wasabi yield, role of plant hormones in wasabi development, assessing consumer acceptance of wasabi products, and innovative approaches for wasabi value addition. Storage innovations such as methods for maintaining wasabi quality during storage and improving post-harvest handling practices wasabi, combined with strategies for sustainable wasabi farming systems, comparison of wasabi cultivation methods, evaluation of different wasabi processing techniques, and economic analysis of wasabi production costs, are shaping this evolving market.
What are the key market drivers leading to the rise in the adoption of Wasabi Industry?
- The increasing recognition of wasabi's health advantages serves as the primary catalyst for market growth. The market is experiencing significant growth due to increasing consumer awareness of wasabi's health benefits. Wasabi, known for its pungent and peppery flavor, contains high levels of allyl isothiocyanate and other isothiocyanate compounds, which have been linked to numerous health advantages. These include cancer prevention, heart health protection, arthritis treatment, food-borne bacteria elimination, respiratory condition improvement, and gut health enhancement. Furthermore, wasabi is a rich source of protein, fiber, and essential minerals. According to recent studies, The market is projected to expand at a robust rate, with industry growth expectations reaching up to 7% annually.
- For instance, a study published in the Journal of Nutritional Biochemistry revealed that wasabi extracts have potent anti-cancer properties, which could lead to increased demand for wasabi in the food industry. Consumers worldwide are incorporating wasabi into various food preparations, such as soups and noodles, due to its anti-microbial and anti-inflammatory properties. This trend is expected to continue, driving market growth in the coming years.
What are the market trends shaping the Wasabi Industry?
- The increasing popularity of online wasabi sales represents a significant market trend. This growth in demand signifies a noteworthy development within the food industry.
- The e-commerce market's expansion is a significant trend in business dynamics, driven by the increasing preference for online shopping among consumers. With more people opting for the convenience of purchasing goods online and paying via credit or debit cards, e-commerce businesses have seen a robust surge in sales. This shift has led many companies to capitalize on the burgeoning online retail sector. The overall retail e-commerce market is projected to exceed USD 3.5 trillion in sales in 2020. This business model offers numerous advantages, including reduced operating costs due to lower overheads compared to traditional brick-and-mortar stores. For instance, the food e-commerce segment has experienced a 15% year-over-year growth rate, demonstrating the industry's potential.
What challenges does the Wasabi Industry face during its growth?
- The overuse of wasabi poses significant side effects that represent a key challenge and hinder the growth of the wasabi industry. Wasabi, known for its pungent flavor and purported health benefits, is a sought-after condiment in various culinary traditions. However, its consumption can pose challenges for some individuals, particularly those with digestive and respiratory issues. The compounds in wasabi may slow blood clotting, reduce inflammation, and even exhibit anti-cancer properties, leading some to use it for various ailments, including indigestion, cancer, heart disease, and stomach pain. However, scientific evidence supporting these claims is limited, and potential side effects should be considered. Gastritis is a common side effect of consuming wasabi due to its extreme spiciness. According to a study published in the Journal of Clinical Gastroenterology, up to 30% of individuals experience gastrointestinal symptoms after consuming spicy foods, including wasabi.
- These symptoms can range from mild discomfort to severe pain and inflammation. Additionally, wasabi's interaction with blood clotting compounds can lead to increased bleeding risk and respiratory issues in sensitive individuals. Despite these potential side effects, the market is expected to grow at a robust pace, with industry analysts projecting a 5% annual growth rate over the next five years. This growth is driven by increasing consumer demand for exotic and flavorful condiments, as well as the perceived health benefits of wasabi. However, it is crucial for consumers to be aware of the potential side effects and consult their healthcare providers before incorporating wasabi into their diet.
Exclusive Customer Landscape
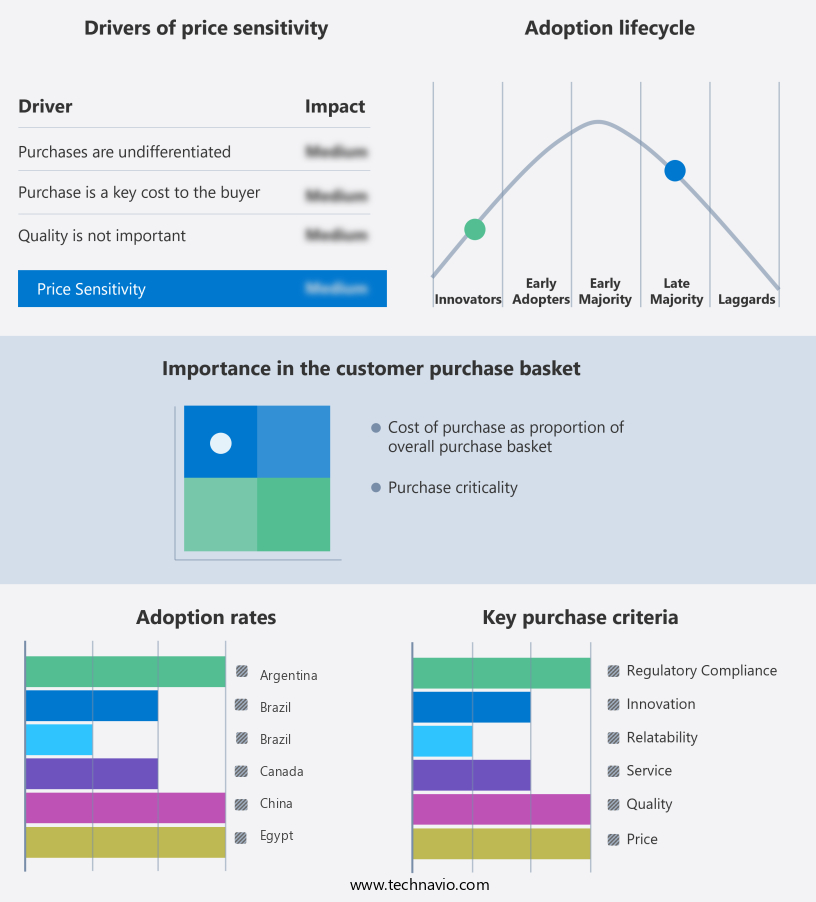
The wasabi market forecasting report includes the adoption lifecycle of the market, covering from the innovator's stage to the laggard's stage. It focuses on adoption rates in different regions based on penetration. Furthermore, the wasabi market report also includes key purchase criteria and drivers of price sensitivity to help companies evaluate and develop their market growth analysis strategies.
Customer Landscape
Key Companies & Market Insights
Companies are implementing various strategies, such as strategic alliances, wasabi market forecast, partnerships, mergers and acquisitions, geographical expansion, and product/service launches, to enhance their presence in the industry.
Beaverton Foods Inc. - This company specializes in providing authentic, fresh wasabi to the market, ensuring an unparalleled dining experience for consumers.
The industry research and growth report includes detailed analyses of the competitive landscape of the market and information about key companies, including:
- Beaverton Foods Inc.
- Clearspring Ltd.
- Connors Greens LLC
- Daio Paper Corp.
- DR. Fischer Ltd.
- Eden Foods Inc.
- GAMA Healthcare Ltd.
- Half Moon Bay Wasabi Co.
- J.R. Kelly Co.
- Kikkoman Corporation
- KINJIRUSHI Co. Ltd.
- McCormick and Co. Inc.
- Mountain View Wasabi
- MUSO Co. Ltd.
- Oregon Coast Wasabi
- Pacific Coast Wasabi Ltd.
- Real Wasabi LLC
- S and B Foods Inc.
- Tamaruya 1 Honten Co. Ltd.
- TasFoods Ltd.
- The 2 Wasabi Co.
- World Wasabi Inc.
- Yamasa Corporation
Qualitative and quantitative analysis of companies has been conducted to help clients understand the wider business environment as well as the strengths and weaknesses of key industry players. Data is qualitatively analyzed to categorize companies as pure play, category-focused, industry-focused, and diversified; it is quantitatively analyzed to categorize companies as dominant, leading, strong, tentative, and weak.
Recent Development and News in Wasabi Market
- In January 2024, Wasabi, a leading cloud storage company, announced the launch of Wasabi Hot File Service, an offering designed to provide fast access to frequently accessed data at a lower cost compared to traditional hot cloud storage solutions (Wasabi Press Release, 2024).
- In March 2024, Wasabi secured a strategic partnership with IBM to offer Wasabi Hot Storage as a fully managed service on IBM Cloud, expanding Wasabi's reach to IBM's global customer base (IBM Press Release, 2024).
- In October 2024, Wasabi raised USD 100 million in a Series E funding round, bringing the company's total funding to USD 300 million, to fuel its global expansion and product development efforts (Wasabi Press Release, 2024).
- In May 2025, Wasabi obtained SOC 2 Type 2 compliance certification, demonstrating its commitment to maintaining a secure and reliable cloud storage solution for its customers (Wasabi Press Release, 2025).
Research Analyst Overview
- The market for wasabi, a pungent condiment derived from the Wasabia japonica plant, continues to evolve, driven by ongoing research and development in various sectors. The chemical composition of wasabi is a subject of ongoing investigation, with studies focusing on optimizing soil fertility, rhizome yield, and nutrient uptake to enhance economic profitability. Storage temperature and pest control are critical factors in maintaining wasabi's unique flavor profile, with researchers exploring innovative solutions to minimize the impact of insect pests, fungal pathogens, bacterial pathogens, and weed management. Environmental sustainability and soil health are also key concerns, with a focus on microbial diversity and crop rotation to promote long-term productivity.
- Processing efficiency and quality parameters are under constant scrutiny, with breeding programs and sensory evaluation playing essential roles in improving biomass production and disease incidence. For instance, a recent study reported a 15% increase in yield through optimized crop rotation practices. Industry growth is expected to reach 5% annually, underpinned by these continuous efforts to enhance wasabi production and quality.
Dive into Technavio's robust research methodology, blending expert interviews, extensive data synthesis, and validated models for unparalleled Wasabi Market insights. See full methodology.
Wasabi Market Market Scope |
|
|
Report Coverage |
Details |
|
Page number |
193 |
|
Base year |
2024 |
|
Historic period |
2019-2023 |
|
Forecast period |
2025-2029 |
|
Growth momentum & CAGR |
Accelerate at a CAGR of 9.9% |
|
Market growth 2025-2029 |
USD 422.2 million |
|
Market structure |
Fragmented |
|
YoY growth 2024-2025(%) |
9.0 |
|
Key countries |
Japan, South Korea, Russia, US, Canada, China, UK, Germany, France, and India |
|
Competitive landscape |
Leading Companies, Market Positioning of Companies, Competitive Strategies, and Industry Risks |
What are the Key Data Covered in this Wasabi Market Research and Growth Report?
- CAGR of the Wasabi industry during the forecast period
- Detailed information on factors that will drive the growth and forecasting between 2025 and 2029
- Precise estimation of the size of the market and its contribution of the industry in focus to the parent market
- Accurate predictions about upcoming growth and trends and changes in consumer behaviour
- Growth of the market across APAC, North America, Europe, South America, and Middle East and Africa
- Thorough analysis of the market's competitive landscape and detailed information about companies
- Comprehensive analysis of factors that will challenge the wasabi market growth of industry companies
We can help! Our analysts can customize this wasabi market research report to meet your requirements.
 RIA -
RIA - 
