Washed Silica Sand Market Analysis North America, APAC, Europe, South America, Middle East and Africa - US, China, Italy, France, Turkey, India - Size and Forecast 2024-2028

Washed Silica Sand Market Analysis North America, APAC, Europe, South America, Middle East and Africa - US, China, Italy, France, Turkey, India - Size and Forecast 2024-2028

Published: Aug 2024 208 Pages SKU: IRTNTR80089

Market Overview at a Glance

$13.50 B
Market Opportunity
11.12%
CAGR
15.24
YoY growth 2023-2024(%)

Washed Silica Sand Market Size 2024-2028 

The washed silica sand market size is forecast to increase by USD 13.5 billion at a CAGR of 11.12% between 2023 and 2028.

  • The market is experiencing significant growth due to the increasing demand for high-purity silica sand in various industries such as glass, foundry, and hydrofracking. Technological advancements in sand washing and processing technologies are also driving market growth, enabling the production of higher quality sand with improved yield and reduced water consumption. However, transportation bottlenecks and rising fuel costs for the transportation of washed silica sand pose challenges to market growth.
  • To mitigate these challenges, market players are exploring alternative transportation methods and collaborating to optimize logistics and reduce costs. Overall, the market is expected to grow steadily due to these market trends and challenges.

What will be the Size of the Washed Silica Sand Market During the Forecast Period?

Washed Silica Sand Market Size

 Request Free Sample

  • The market encompasses the global demand for high-purity silica sand, primarily derived from quartz and other minerals such as cristobalite and tridymite. This market caters to various industries, including glass manufacturing for the production of glass vials, container glass, and specialty glass, as well as hydraulic fracturing for the oil and gas sector. In the construction industry, washed silica sand is utilized as a crucial component in concrete production and as a base material in foundry applications. Furthermore, the chemicals sector relies on washed silica sand for the production of silicon dioxide (SiO2) and other specialty chemicals. The electronics industry leverages washed silica sand in the manufacturing of semiconductors and fiberglass, while the solar industry employs it in photovoltaic panels.
  • Machinery manufacturing also utilizes washed silica sand as an abrasive in various processes. Overall, the market for washed silica sand exhibits steady growth, driven by the expanding demand from these diverse industries.

How is this Washed Silica Sand Industry segmented and which is the largest segment?

The washed silica sand industry research report provides comprehensive data (region-wise segment analysis), with forecasts and estimates in "USD million" for the period 2024-2028, as well as historical data from 2018-2022 for the following segments.

  • Application
    • Glass manufacturing
    • Foundry
    • Construction
    • Ceramics and refractories
    • Others
  • Method
    • Wet washing
    • Dry washing
    • Attrition scrubbing
    • Acid leaching
  • Geography
    • North America
      • US
    • APAC
      • China
      • India
    • Europe
      • France
      • Italy
    • South America
    • Middle East and Africa

By Application Insights

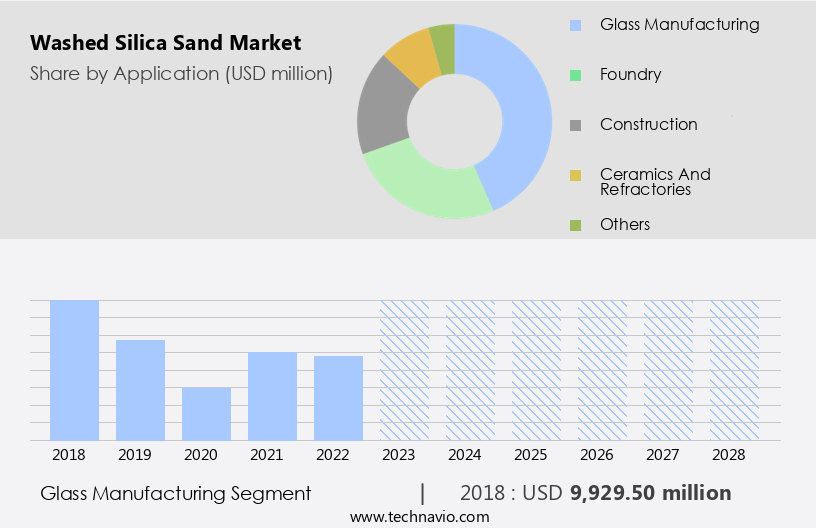
  • The glass manufacturing segment is estimated to witness significant growth during the forecast period.

Silica sand plays a crucial role in glass manufacturing due to its high silica content, uniform particle size distribution, and excellent chemical purity. The washing process enhances these properties by eliminating impurities such as clay, silt, and organic matter, ensuring the sand meets stringent industry standards. In glass production, washed silica sand is a vital raw material for various glass types, including flat glass for windows, doors, and mirrors, container glass, fiberglass, and specialty glass products. High-quality silica sand is essential for achieving optical clarity, uniform thickness, and desired properties in these glass applications.

Washed Silica Sand Market Size

Get a glance at the  Washed Silica Sand Industry report of share of various segments Request Free Sample

The Glass manufacturing segment was valued at USD 9.93 billion in 2018 and showed a gradual increase during the forecast period.

Regional Analysis

  • North America is estimated to contribute 50% to the growth of the global market during the forecast period.

Technavio's analysts have elaborately explained the regional trends and drivers that shape the market during the forecast period.

Washed Silica Sand Market Share by Geography

For more insights on the market share of various regions, Request Free Sample

Washed silica sand is extensively utilized in various industries, with North America being a significant consumer due to its adoption of unconventional oil and gas production methods. According to the United States Energy Information Administration (EIA), the US employed around 555 rotary rigs as of July 2023, with approximately 78% of these rigs dedicated to horizontal drilling in shale formations. This shift from conventional drilling represents a notable increase from the 2022 average of 476 rigs. Beyond energy production, washed silica sand is also essential in glass manufacturing, construction, foundry, chemicals, metals, ceramics, electronics, solar, machinery, and other applications. Industries using washed silica sand include sodalime glass, flat glass, automotive glass, solar glass, Glass Fibers, Glass Wool Insulation, Glass Containers, Glass vials, and various types of glass such as crystalline silica, quartz, cristobalite, and tridymite.

Additionally, it is used in fiberglass, container glass, and specialty glass production. Infrastructural activities and raw materials for glass production further contribute to the demand for washed silica sand. Despite its widespread use, exposure to crystalline silica, a primary component of washed silica sand, can lead to health concerns, including pneumoconiosis, lung cancer, and pulmonary tuberculosis. Proper safety measures and regulations are crucial in handling and using this material.

Market Dynamics

Our washed silica sand market researchers analyzed the data with 2023 as the base year, along with the key drivers, trends, and challenges. A holistic analysis of drivers will help companies refine their marketing strategies to gain a competitive advantage.

What are the key market drivers leading to the rise in the adoption of Washed Silica Sand Industry?

Increasing demand for high-purity silica sand is the key driver of the market.

  • The global market for washed silica sand has witnessed significant growth due to the increasing demand for high-purity silica sand in various industries. This trend can be attributed to several factors, including the expanding solar energy sector. High-purity silica sand is a crucial ingredient in the production of solar panels, as it is used to make solar glass, which is essential for the efficiency and performance of solar energy systems. Moreover, the semiconductor industry, which relies on ultra-pure silica for the production of solar cells, requires a consistent and high-quality supply of washed silica sand. The versatility of high-purity silica sand is also evident in its extensive use in the glass manufacturing industry.
  • It is used in the production of various types of glass, such as sodalime glass, flat glass, automotive glass, solar glass, Glass Fibers, Glass Wool Insulation, Glass Containers, and Glass vials. In addition to the glass industry, high-purity silica sand is also used in the production of concrete and cement, as well as in the foundry industry for the manufacture of metals and ceramics. The construction industry's growing demand for high-quality building materials further fuels the demand for high-purity silica sand. However, it is essential to note that the mining and processing of silica sand can pose health risks, such as the inhalation of crystalline silica, which can lead to respiratory diseases like pneumoconiosis, lung cancer, and pulmonary tuberculosis.
  • Therefore, safety measures must be implemented to mitigate these risks. In conclusion, the global market for washed silica sand is driven by its diverse applications across various industries, including solar energy, glass manufacturing, construction, foundry, and chemicals. The demand for high-purity silica sand is expected to continue growing, making it a critical component in the global market.

What are the market trends shaping the Washed Silica Sand Industry?

Technological advancements in sand washing and processing technologies is the upcoming market trend.

  • Washed silica sand is a crucial industrial material with wide applications in various sectors, including glass manufacturing, hydraulic fracturing, construction, foundry, chemicals, metals, ceramics, electronics, solar, machinery, and more. Technological advancements in sand washing and processing have significantly impacted The market, enhancing production efficiency, quality, and sustainability. Advanced screening and classification systems, such as vibrating screens and hydrocyclones, have revolutionized the industry. These technologies enable the separation of silica sand particles based on size and density, ensuring stringent quality standards and reducing environmental impacts. The use of natural sand, which contains impurities, has been gradually replaced by washed silica sand due to its superior properties.
  • In the glass industry, washed silica sand is a primary raw material for producing various types of glass, including sodalime glass, flat glass, automotive glass, solar glass, glass fibers, glass wool insulation, glass containers, and glass vials. The production of these glass products requires high-purity silica sand to ensure the desired properties, such as transparency, durability, and strength. Moreover, the use of washed silica sand extends beyond the glass industry. It is also essential in the production of concrete, cement, and mortar, as well as in the foundry industry for making metal castings. In the chemical industry, it is used as a raw material in the production of silicon, silicone, and other specialty chemicals.
  • In the solar industry, it is used in the production of solar panels, while in the machinery industry, it is used in the manufacturing of various types of machinery. The health risks associated with crystalline silica, including pneumoconiosis, lung cancer, and pulmonary tuberculosis, have led to stringent regulations regarding the handling and use of silica sand. The adoption of advanced sand washing and processing technologies has helped mitigate these risks and ensure a safer working environment. In conclusion, The market is driven by its diverse applications in various industries, including glass manufacturing, hydraulic fracturing, construction, foundry, chemicals, metals, ceramics, electronics, solar, machinery, and more.
  • Technological advancements in sand washing and processing have played a key role in enhancing efficiency, quality, and sustainability, while reducing environmental impacts and ensuring stringent quality standards.

What challenges does the Washed Silica Sand Industry face during its growth?

Transportation bottlenecks and rising fuel costs for transportation of washed silica sand is a key challenge affecting the industry growth.

  • Washed silica sand is a crucial raw material in various industries, including Glass, Hydraulic Fracturing, Construction, Foundry, Chemicals, Metals, Ceramics, Electronics, Solar, Machinery, and more. Its applications range from Glass production for sodalime glass, flat glass, automotive glass, solar glass, Glass Fibers, Glass Wool Insulation, Glass Containers, and Glass vials, to specialty glass uses in infrastructural activities. However, transportation bottlenecks and rising fuel costs pose significant challenges to The market. Insufficient capacity or efficiency in transportation infrastructure can lead to congestion and delays, causing increased transportation expenses and reducing overall profitability for producers. For instance, in regions with extensive washed silica sand deposits, such as the Midwest, limited rail and road infrastructure may struggle to accommodate the volume of washed silica sand shipments, resulting in delays and supply chain disruptions.
  • These challenges can hinder the growth of the market during the forecast period. Crystalline silica, the primary component of washed silica sand, is also a health concern, with exposure leading to respiratory diseases such as Pneumoconiosis, Lung cancer, and Pulmonary tuberculosis. Therefore, safety measures and regulations are essential to mitigate these risks. In summary, The market faces challenges from transportation bottlenecks and rising fuel costs, which can increase expenses and cause delays. Additionally, the health risks associated with crystalline silica require stringent safety measures and regulations. Despite these challenges, the market continues to grow due to the diverse applications of washed silica sand in various industries.

Exclusive Customer Landscape

The washed silica sand market forecasting report includes the adoption lifecycle of the market, covering from the innovator's stage to the laggard's stage. It focuses on adoption rates in different regions based on penetration. Furthermore, the washed silica sand market report also includes key purchase criteria and drivers of price sensitivity to help companies evaluate and develop their market growth analysis strategies.

Washed Silica Sand Market Share by Geography

 Customer Landscape

Key Companies & Market Insights

Companies are implementing various strategies, such as strategic alliances, washed silica sand market forecast, partnerships, mergers and acquisitions, geographical expansion, and product/service launches, to enhance their presence in the industry.

Adelaide Industrial Sands Pty Ltd. - The company specializes in providing a range of washed silica sand options, including Dried Silica Sand, Turf Sand, and Traction Sand. These products cater to various industries and applications, ensuring optimal performance and consistency. Dried Silica Sand is ideal for glassmaking and hydrofracking, while Turf Sand is suitable for sports fields and playgrounds. Traction Sand, on the other hand, is essential for ice and snow control. With a commitment to quality and customer satisfaction, the company delivers washed silica sand solutions that meet the highest industry standards.

The industry research and growth report includes detailed analyses of the competitive landscape of the market and information about key companies, including:

  • Adelaide Industrial Sands Pty Ltd.
  • Adwan Chemical Industries Co. Ltd.
  • Aggregate Industries UK Ltd.
  • ARIHANT MICRON.
  • Australian Silica Quartz Group Ltd.
  • Badger Mining Corp.
  • Bathgate Silica Sand Ltd.
  • Covia Holdings LLC
  • Deejay Enterprises Pvt Ltd.
  • Euroquarz GmbH
  • Karnataka Silicates
  • Kemerton Silica Sand Pty Ltd
  • Minerali Industriali Srl
  • Pattison Company, LLC
  • Preferred Proppants LLC
  • Quartz Works GmbH
  • SCR Sibelco NV
  • Southern Mineral Industries
  • TOCHU CORP.
  • VRX SILICA Ltd.

Qualitative and quantitative analysis of companies has been conducted to help clients understand the wider business environment as well as the strengths and weaknesses of key industry players. Data is qualitatively analyzed to categorize companies as pure play, category-focused, industry-focused, and diversified; it is quantitatively analyzed to categorize companies as dominant, leading, strong, tentative, and weak.

Research Analyst Overview

The market encompasses a diverse range of industries that utilize this essential raw material in their production processes. Silica sand, also known as quartz sand, is a naturally occurring substance composed primarily of silica particles. In its raw form, it may contain impurities and require washing to meet specifications for various applications. Washed silica sand plays a crucial role in several sectors, including glass manufacturing, construction, foundry, chemicals, metals, ceramics, electronics, solar, machinery, and more. Its versatility stems from the unique properties of silica, such as high melting point, excellent thermal conductivity, and resistance to chemical and thermal shock.

In the glass industry, washed silica sand is an indispensable raw material for producing various types of glass, including sodalime glass, flat glass, automotive glass, solar glass, glass fibers, glass wool insulation, glass containers, glass vials, and specialty glass. The glass manufacturing process involves heating the sand to high temperatures, melting it, and shaping it into desired forms. The construction sector relies on washed silica sand for the production of concrete and cement. As a primary ingredient, it enhances the strength and durability of these materials, making them suitable for various applications, from residential buildings to large-scale infrastructural projects.

The foundry industry utilizes washed silica sand as a molding material for casting metals. The sand acts as a protective coating for the molten metal, allowing it to cool and solidify into the desired shape. In the chemical industry, washed silica sand is used as a raw material in the production of various chemicals, such as silicon, silicones, and silicates. It is also used as a catalyst in various chemical reactions. In the ceramics industry, washed silica sand is used as a primary raw material for producing various types of ceramic products, including bricks, tiles, and tableware.

Its high melting point and thermal conductivity make it an ideal choice for producing high-quality ceramics. In the electronics industry, washed silica sand is used in the production of semiconductors and other electronic components due to its excellent insulating properties. It is also used in the production of solar panels, where it is used as a component in the photovoltaic cells. In the machinery industry, washed silica sand is used as an abrasive in various machining processes, such as grinding and polishing. It is also used in the production of sandblasting equipment and sandpaper. The market dynamics for washed silica sand are influenced by several factors, including supply and demand, price trends, technological advancements, and regulatory requirements.

The demand for washed silica sand is driven by the growth of various industries, such as construction, glass manufacturing, and electronics, which rely on it as a critical raw material. Despite its numerous applications, the production and use of washed silica sand pose health risks, primarily due to the presence of crystalline silica, which can cause respiratory diseases such as pneumoconiosis, lung cancer, and pulmonary tuberculosis. As a result, regulatory bodies have imposed strict guidelines on the mining, processing, and use of washed silica sand to minimize these risks. In conclusion, the market is a diverse and dynamic one, with applications spanning various industries, from glass manufacturing and construction to electronics and solar energy.

Its unique properties make it an essential raw material for producing high-quality products and meeting the demands of modern industries. However, the production and use of washed silica sand also pose health risks, necessitating strict regulatory oversight and continuous research into safer production methods and alternative raw materials.

Washed Silica Sand Market Scope

Report Coverage

Details

Page number

208

Base year

2023

Historic period

2018-2022

Forecast period

2024-2028

Growth momentum & CAGR

Decelerate at a CAGR of 11.12%

Market growth 2024-2028

USD 13501.8 million

Market structure

Fragmented

YoY growth 2023-2024(%)

15.24

Key countries

US, China, Italy, France, Turkey, and India

Competitive landscape

Leading Companies, Market Positioning of Companies, Competitive Strategies, and Industry Risks

Request Free Sample

What are the Key Data Covered in this Washed Silica Sand Market Research and Growth Report?

  • CAGR of the Washed Silica Sand industry during the forecast period
  • Detailed information on factors that will drive the Washed Silica Sand growth and forecasting between 2024 and 2028
  • Precise estimation of the size of the market and its contribution of the industry in focus to the parent market
  • Accurate predictions about upcoming growth and trends and changes in consumer behaviour
  • Growth of the market across North America, APAC, Europe, South America, and Middle East and Africa
  • Thorough analysis of the market's competitive landscape and detailed information about companies
  • Comprehensive analysis of factors that will challenge the washed silica sand market growth of industry companies

We can help! Our analysts can customize this washed silica sand market research report to meet your requirements.

Get in touch

1 Executive Summary

  • 1.1 Market overview
    • Executive Summary - Chart on Market Overview
    • Executive Summary - Data Table on Market Overview
    • Executive Summary - Chart on Global Market Characteristics
    • Executive Summary - Chart on Market by Geography
    • Executive Summary - Chart on Market Segmentation by Application
    • Executive Summary - Chart on Market Segmentation by Method
    • Executive Summary - Chart on Incremental Growth
    • Executive Summary - Data Table on Incremental Growth
    • Executive Summary - Chart on Company Market Positioning

2 Technavio Analysis

  • 2.1 Analysis of price sensitivity, lifecycle, customer purchase basket, adoption rates, and purchase criteria
    • Analysis of price sensitivity, lifecycle, customer purchase basket, adoption rates, and purchase criteria
  • 2.2 Criticality of inputs and Factors of differentiation
    • Overview on criticality of inputs and factors of differentiation
  • 2.3 Factors of disruption
    • Overview on factors of disruption
  • 2.4 Impact of drivers and challenges
    • Impact of drivers and challenges in 2023 and 2028

3 Market Landscape

  • 3.1 Market ecosystem
    • Parent Market
    • Data Table on - Parent Market
  • 3.2 Market characteristics
    • Market characteristics analysis
  • 3.3 Value chain analysis
    • Value Chain Analysis

4 Market Sizing

  • 4.1 Market definition
    • Offerings of companies included in the market definition
  • 4.2 Market segment analysis
    • Market segments
  • 4.3 Market size 2023
    • 4.4 Market outlook: Forecast for 2023-2028
      • Chart on Global - Market size and forecast 2023-2028 ($ million)
      • Data Table on Global - Market size and forecast 2023-2028 ($ million)
      • Chart on Global Market: Year-over-year growth 2023-2028 (%)
      • Data Table on Global Market: Year-over-year growth 2023-2028 (%)

    5 Historic Market Size

    • 5.1 Global Washed Silica Sand Market 2018 - 2022
      • Historic Market Size - Data Table on Global Washed Silica Sand Market 2018 - 2022 ($ million)
    • 5.2 Application segment analysis 2018 - 2022
      • Historic Market Size - Application Segment 2018 - 2022 ($ million)
    • 5.3 Method segment analysis 2018 - 2022
      • Historic Market Size - Method Segment 2018 - 2022 ($ million)
    • 5.4 Geography segment analysis 2018 - 2022
      • Historic Market Size - Geography Segment 2018 - 2022 ($ million)
    • 5.5 Country segment analysis 2018 - 2022
      • Historic Market Size - Country Segment 2018 - 2022 ($ million)

    6 Additional Value/Volume Data

    • 6.1 Global washed silica sand market by country 2023 - 2028 ($ million)
      • Market Size (value) - Data Table on Global washed silica sand market by Country 2023 - 2028 ($ million)

    7 Five Forces Analysis

    • 7.1 Five forces summary
      • Five forces analysis - Comparison between 2023 and 2028
    • 7.2 Bargaining power of buyers
      • Bargaining power of buyers - Impact of key factors 2023 and 2028
    • 7.3 Bargaining power of suppliers
      • Bargaining power of suppliers - Impact of key factors in 2023 and 2028
    • 7.4 Threat of new entrants
      • Threat of new entrants - Impact of key factors in 2023 and 2028
    • 7.5 Threat of substitutes
      • Threat of substitutes - Impact of key factors in 2023 and 2028
    • 7.6 Threat of rivalry
      • Threat of rivalry - Impact of key factors in 2023 and 2028
    • 7.7 Market condition
      • Chart on Market condition - Five forces 2023 and 2028

    8 Market Segmentation by Application

    • 8.1 Market segments
      • Chart on Application - Market share 2023-2028 (%)
      • Data Table on Application - Market share 2023-2028 (%)
    • 8.2 Comparison by Application
      • Chart on Comparison by Application
      • Data Table on Comparison by Application
    • 8.3 Glass manufacturing - Market size and forecast 2023-2028
      • Chart on Glass manufacturing - Market size and forecast 2023-2028 ($ million)
      • Data Table on Glass manufacturing - Market size and forecast 2023-2028 ($ million)
      • Chart on Glass manufacturing - Year-over-year growth 2023-2028 (%)
      • Data Table on Glass manufacturing - Year-over-year growth 2023-2028 (%)
    • 8.4 Foundry - Market size and forecast 2023-2028
      • Chart on Foundry - Market size and forecast 2023-2028 ($ million)
      • Data Table on Foundry - Market size and forecast 2023-2028 ($ million)
      • Chart on Foundry - Year-over-year growth 2023-2028 (%)
      • Data Table on Foundry - Year-over-year growth 2023-2028 (%)
    • 8.5 Construction - Market size and forecast 2023-2028
      • Chart on Construction - Market size and forecast 2023-2028 ($ million)
      • Data Table on Construction - Market size and forecast 2023-2028 ($ million)
      • Chart on Construction - Year-over-year growth 2023-2028 (%)
      • Data Table on Construction - Year-over-year growth 2023-2028 (%)
    • 8.6 Ceramics and refractories - Market size and forecast 2023-2028
      • Chart on Ceramics and refractories - Market size and forecast 2023-2028 ($ million)
      • Data Table on Ceramics and refractories - Market size and forecast 2023-2028 ($ million)
      • Chart on Ceramics and refractories - Year-over-year growth 2023-2028 (%)
      • Data Table on Ceramics and refractories - Year-over-year growth 2023-2028 (%)
    • 8.7 Others - Market size and forecast 2023-2028
      • Chart on Others - Market size and forecast 2023-2028 ($ million)
      • Data Table on Others - Market size and forecast 2023-2028 ($ million)
      • Chart on Others - Year-over-year growth 2023-2028 (%)
      • Data Table on Others - Year-over-year growth 2023-2028 (%)
    • 8.8 Market opportunity by Application
      • Market opportunity by Application ($ million)
      • Data Table on Market opportunity by Application ($ million)

    9 Market Segmentation by Method

    • 9.1 Market segments
      • Chart on Method - Market share 2023-2028 (%)
      • Data Table on Method - Market share 2023-2028 (%)
    • 9.2 Comparison by Method
      • Chart on Comparison by Method
      • Data Table on Comparison by Method
    • 9.3 Wet washing - Market size and forecast 2023-2028
      • Chart on Wet washing - Market size and forecast 2023-2028 ($ million)
      • Data Table on Wet washing - Market size and forecast 2023-2028 ($ million)
      • Chart on Wet washing - Year-over-year growth 2023-2028 (%)
      • Data Table on Wet washing - Year-over-year growth 2023-2028 (%)
    • 9.4 Dry washing - Market size and forecast 2023-2028
      • Chart on Dry washing - Market size and forecast 2023-2028 ($ million)
      • Data Table on Dry washing - Market size and forecast 2023-2028 ($ million)
      • Chart on Dry washing - Year-over-year growth 2023-2028 (%)
      • Data Table on Dry washing - Year-over-year growth 2023-2028 (%)
    • 9.5 Attrition scrubbing - Market size and forecast 2023-2028
      • Chart on Attrition scrubbing - Market size and forecast 2023-2028 ($ million)
      • Data Table on Attrition scrubbing - Market size and forecast 2023-2028 ($ million)
      • Chart on Attrition scrubbing - Year-over-year growth 2023-2028 (%)
      • Data Table on Attrition scrubbing - Year-over-year growth 2023-2028 (%)
    • 9.6 Acid leaching - Market size and forecast 2023-2028
      • Chart on Acid leaching - Market size and forecast 2023-2028 ($ million)
      • Data Table on Acid leaching - Market size and forecast 2023-2028 ($ million)
      • Chart on Acid leaching - Year-over-year growth 2023-2028 (%)
      • Data Table on Acid leaching - Year-over-year growth 2023-2028 (%)
    • 9.7 Market opportunity by Method
      • Market opportunity by Method ($ million)
      • Data Table on Market opportunity by Method ($ million)

    10 Customer Landscape

    • 10.1 Customer landscape overview
      • Analysis of price sensitivity, lifecycle, customer purchase basket, adoption rates, and purchase criteria

    11 Geographic Landscape

    • 11.1 Geographic segmentation
      • Chart on Market share by geography 2023-2028 (%)
      • Data Table on Market share by geography 2023-2028 (%)
    • 11.2 Geographic comparison
      • Chart on Geographic comparison
      • Data Table on Geographic comparison
    • 11.3 North America - Market size and forecast 2023-2028
      • Chart on North America - Market size and forecast 2023-2028 ($ million)
      • Data Table on North America - Market size and forecast 2023-2028 ($ million)
      • Chart on North America - Year-over-year growth 2023-2028 (%)
      • Data Table on North America - Year-over-year growth 2023-2028 (%)
    • 11.4 APAC - Market size and forecast 2023-2028
      • Chart on APAC - Market size and forecast 2023-2028 ($ million)
      • Data Table on APAC - Market size and forecast 2023-2028 ($ million)
      • Chart on APAC - Year-over-year growth 2023-2028 (%)
      • Data Table on APAC - Year-over-year growth 2023-2028 (%)
    • 11.5 Europe - Market size and forecast 2023-2028
      • Chart on Europe - Market size and forecast 2023-2028 ($ million)
      • Data Table on Europe - Market size and forecast 2023-2028 ($ million)
      • Chart on Europe - Year-over-year growth 2023-2028 (%)
      • Data Table on Europe - Year-over-year growth 2023-2028 (%)
    • 11.6 South America - Market size and forecast 2023-2028
      • Chart on South America - Market size and forecast 2023-2028 ($ million)
      • Data Table on South America - Market size and forecast 2023-2028 ($ million)
      • Chart on South America - Year-over-year growth 2023-2028 (%)
      • Data Table on South America - Year-over-year growth 2023-2028 (%)
    • 11.7 Middle East and Africa - Market size and forecast 2023-2028
      • Chart on Middle East and Africa - Market size and forecast 2023-2028 ($ million)
      • Data Table on Middle East and Africa - Market size and forecast 2023-2028 ($ million)
      • Chart on Middle East and Africa - Year-over-year growth 2023-2028 (%)
      • Data Table on Middle East and Africa - Year-over-year growth 2023-2028 (%)
    • 11.8 US - Market size and forecast 2023-2028
      • Chart on US - Market size and forecast 2023-2028 ($ million)
      • Data Table on US - Market size and forecast 2023-2028 ($ million)
      • Chart on US - Year-over-year growth 2023-2028 (%)
      • Data Table on US - Year-over-year growth 2023-2028 (%)
    • 11.9 China - Market size and forecast 2023-2028
      • Chart on China - Market size and forecast 2023-2028 ($ million)
      • Data Table on China - Market size and forecast 2023-2028 ($ million)
      • Chart on China - Year-over-year growth 2023-2028 (%)
      • Data Table on China - Year-over-year growth 2023-2028 (%)
    • 11.10 Italy - Market size and forecast 2023-2028
      • Chart on Italy - Market size and forecast 2023-2028 ($ million)
      • Data Table on Italy - Market size and forecast 2023-2028 ($ million)
      • Chart on Italy - Year-over-year growth 2023-2028 (%)
      • Data Table on Italy - Year-over-year growth 2023-2028 (%)
    • 11.11 Turkey - Market size and forecast 2023-2028
      • Chart on Turkey - Market size and forecast 2023-2028 ($ million)
      • Data Table on Turkey - Market size and forecast 2023-2028 ($ million)
      • Chart on Turkey - Year-over-year growth 2023-2028 (%)
      • Data Table on Turkey - Year-over-year growth 2023-2028 (%)
    • 11.12 France - Market size and forecast 2023-2028
      • Chart on France - Market size and forecast 2023-2028 ($ million)
      • Data Table on France - Market size and forecast 2023-2028 ($ million)
      • Chart on France - Year-over-year growth 2023-2028 (%)
      • Data Table on France - Year-over-year growth 2023-2028 (%)
    • 11.13 India - Market size and forecast 2023-2028
      • Chart on India - Market size and forecast 2023-2028 ($ million)
      • Data Table on India - Market size and forecast 2023-2028 ($ million)
      • Chart on India - Year-over-year growth 2023-2028 (%)
      • Data Table on India - Year-over-year growth 2023-2028 (%)
    • 11.14 Market opportunity by geography
      • Market opportunity by geography ($ million)
      • Data Tables on Market opportunity by geography ($ million)

    12 Drivers, Challenges, and Opportunity/Restraints

    • 12.1 Market drivers
      • 12.2 Market challenges
        • 12.3 Impact of drivers and challenges
          • Impact of drivers and challenges in 2023 and 2028
        • 12.4 Market opportunities/restraints

          13 Competitive Landscape

          • 13.1 Overview
            • 13.2 Competitive Landscape
              • Overview on criticality of inputs and factors of differentiation
            • 13.3 Landscape disruption
              • Overview on factors of disruption
            • 13.4 Industry risks
              • Impact of key risks on business

            14 Competitive Analysis

            • 14.1 Companies profiled
              • Companies covered
            • 14.2 Company ranking index
              • Company ranking index
            • 14.3 Market positioning of companies
              • Matrix on companies position and classification
            • 14.4 Adelaide Industrial Sands Pty Ltd.
              • Adelaide Industrial Sands Pty Ltd. - Overview
              • Adelaide Industrial Sands Pty Ltd. - Product / Service
              • Adelaide Industrial Sands Pty Ltd. - Key offerings
              • SWOT
            • 14.5 Adwan Chemical Industries Co. Ltd.
              • Adwan Chemical Industries Co. Ltd. - Overview
              • Adwan Chemical Industries Co. Ltd. - Product / Service
              • Adwan Chemical Industries Co. Ltd. - Key offerings
              • SWOT
            • 14.6 Aggregate Industries UK Ltd.
              • Aggregate Industries UK Ltd. - Overview
              • Aggregate Industries UK Ltd. - Product / Service
              • Aggregate Industries UK Ltd. - Key offerings
              • SWOT
            • 14.7 Australian Silica Quartz Group Ltd.
              • Australian Silica Quartz Group Ltd. - Overview
              • Australian Silica Quartz Group Ltd. - Product / Service
              • Australian Silica Quartz Group Ltd. - Key offerings
              • SWOT
            • 14.8 Badger Mining Corp.
              • Badger Mining Corp. - Overview
              • Badger Mining Corp. - Product / Service
              • Badger Mining Corp. - Key offerings
              • SWOT
            • 14.9 Covia Holdings LLC
              • Covia Holdings LLC - Overview
              • Covia Holdings LLC - Product / Service
              • Covia Holdings LLC - Key news
              • Covia Holdings LLC - Key offerings
              • SWOT
            • 14.10 Euroquarz GmbH
              • Euroquarz GmbH - Overview
              • Euroquarz GmbH - Product / Service
              • Euroquarz GmbH - Key offerings
              • SWOT
            • 14.11 Kemerton Silica Sand Pty Ltd
              • Kemerton Silica Sand Pty Ltd - Overview
              • Kemerton Silica Sand Pty Ltd - Product / Service
              • Kemerton Silica Sand Pty Ltd - Key offerings
              • SWOT
            • 14.12 Minerali Industriali Srl
              • Minerali Industriali Srl - Overview
              • Minerali Industriali Srl - Product / Service
              • Minerali Industriali Srl - Key offerings
              • SWOT
            • 14.13 Pattison Company, LLC
              • Pattison Company, LLC - Overview
              • Pattison Company, LLC - Product / Service
              • Pattison Company, LLC - Key offerings
              • SWOT
            • 14.14 Preferred Proppants LLC
              • Preferred Proppants LLC - Overview
              • Preferred Proppants LLC - Product / Service
              • Preferred Proppants LLC - Key offerings
              • SWOT
            • 14.15 Quartz Works GmbH
              • Quartz Works GmbH - Overview
              • Quartz Works GmbH - Product / Service
              • Quartz Works GmbH - Key offerings
              • SWOT
            • 14.16 SCR Sibelco NV
              • SCR Sibelco NV - Overview
              • SCR Sibelco NV - Product / Service
              • SCR Sibelco NV - Key news
              • SCR Sibelco NV - Key offerings
              • SWOT
            • 14.17 TOCHU CORP.
              • TOCHU CORP. - Overview
              • TOCHU CORP. - Product / Service
              • TOCHU CORP. - Key offerings
              • SWOT
            • 14.18 VRX SILICA Ltd.
              • VRX SILICA Ltd. - Overview
              • VRX SILICA Ltd. - Business segments
              • VRX SILICA Ltd. - Key offerings
              • VRX SILICA Ltd. - Segment focus
              • SWOT

            15 Appendix

            • 15.1 Scope of the report
              • 15.2 Inclusions and exclusions checklist
                • Inclusions checklist
                • Exclusions checklist
              • 15.3 Currency conversion rates for US$
                • Currency conversion rates for US$
              • 15.4 Research methodology
                • Research methodology
              • 15.5 Data procurement
                • Information sources
              • 15.6 Data validation
                • Data validation
              • 15.7 Validation techniques employed for market sizing
                • Validation techniques employed for market sizing
              • 15.8 Data synthesis
                • Data synthesis
              • 15.9 360 degree market analysis
                • 360 degree market analysis
              • 15.10 List of abbreviations
                • List of abbreviations

              Research Methodology

              Technavio presents a detailed picture of the market by way of study, synthesis, and summation of data from multiple sources. The analysts have presented the various facets of the market with a particular focus on identifying the key industry influencers. The data thus presented is comprehensive, reliable, and the result of extensive research, both primary and secondary.

              INFORMATION SOURCES

              Primary sources

              • Manufacturers and suppliers
              • Channel partners
              • Industry experts
              • Strategic decision makers

              Secondary sources

              • Industry journals and periodicals
              • Government data
              • Financial reports of key industry players
              • Historical data
              • Press releases

              DATA ANALYSIS

              Data Synthesis

              • Collation of data
              • Estimation of key figures
              • Analysis of derived insights

              Data Validation

              • Triangulation with data models
              • Reference against proprietary databases
              • Corroboration with industry experts

              REPORT WRITING

              Qualitative

              • Market drivers
              • Market challenges
              • Market trends
              • Five forces analysis

              Quantitative

              • Market size and forecast
              • Market segmentation
              • Geographical insights
              • Competitive landscape

              Interested in this report?

              Get your sample now to see our research methodology and insights!

              Download Now

              Frequently Asked Questions

              Washed Silica Sand market growth will increase by 13501.8 million during 2024-2028.

              The Washed Silica Sand market is expected to grow at a CAGR of 11.12% during 2024-2028.

              Washed Silica Sand market is segmented by Application( Glass manufacturing, Foundry, Construction, Ceramics and refractories, Others) Method( Wet washing, Dry washing, Attrition scrubbing, Acid leaching)

              Adelaide Industrial Sands Pty Ltd., Adwan Chemical Industries Co. Ltd., Aggregate Industries UK Ltd., ARIHANT MICRON., Australian Silica Quartz Group Ltd., Badger Mining Corp., Bathgate Silica Sand Ltd., Covia Holdings LLC, Deejay Enterprises Pvt Ltd., Euroquarz GmbH, Karnataka Silicates, Kemerton Silica Sand Pty Ltd, Minerali Industriali Srl, Pattison Company, LLC, Preferred Proppants LLC, Quartz Works GmbH, SCR Sibelco NV, Southern Mineral Industries, TOCHU CORP., VRX SILICA Ltd. are a few of the key vendors in the Washed Silica Sand market.

              North America will register the highest growth rate of 49.8% among the other regions. Therefore, the Washed Silica Sand market in North America is expected to garner significant business opportunities for the vendors during the forecast period.

              US, China, Italy, France, Turkey, India

              • Increasing demand for high-purity silica sandThe global washed silica sand market has experienced an increasing demand for high-purity silica sand due to its versatile applications across various industries. The rise in demand can be attributed to several factors driving the need for high-purity silica sand is the driving factor this market.
              • making it a critical component in the global market.One major driver of the increasing demand for high-purity silica sand is its pivotal role in the burgeoning solar energy industry. With the rapid expansion of solar photovoltaic (PV) technology is the driving factor this market.
              • high-purity silica sand is essential for the production of solar panels. The semiconductor industry is the driving factor this market.
              • which relies on ultra-pure silica for the production of solar cells is the driving factor this market.
              • demands a consistent and high-quality supply of washed silica sand to ensure the efficiency and performance of solar energy systems. As the global transition toward renewable energy sources accelerates is the driving factor this market.
              • the demand for high-purity silica sand is expected to remain robust in support of the solar energy sector.Additionally is the driving factor this market.
              • the electronics and semiconductor industry continues to drive the demand for high-purity silica sand. With applications in the manufacturing of integrated circuits is the driving factor this market.
              • optical fibers is the driving factor this market.
              • and other high-tech electronic components is the driving factor this market.
              • the semiconductor industry relies on ultra-clean silica as a critical raw material. The stringent purity requirements of these industries necessitate the use of washed silica sand to meet the exacting standards for semiconductor production is the driving factor this market.
              • ensuring the reliability and performance of electronic devices. Moreover is the driving factor this market.
              • the pharmaceutical and biotechnology sectors are increasingly relying on high-purity silica sand for various applications is the driving factor this market.
              • including drug development is the driving factor this market.
              • chromatography is the driving factor this market.
              • and pharmaceutical compounding. The pharmaceutical industry demands ultra-pure silica for its inert and high-surface area properties is the driving factor this market.
              • essential for drug purification and formulation processes. As the global healthcare sector expands and advances is the driving factor this market.
              • the demand for high-purity silica sand in pharmaceutical and biotechnology applications is expected to grow is the driving factor this market.
              • further boosting its significance in the washed silica sand. Thus is the driving factor this market.
              • such factors are expected to propel the growth of the market in focus during the forecast period. is the driving factor this market.

              The Washed Silica Sand market vendors should focus on grabbing business opportunities from the Glass manufacturing segment as it accounted for the largest market share in the base year.