Water Aeration Systems Market Size 2025-2029
The water aeration systems market size is forecast to increase by USD 4.69 billion at a CAGR of 5.4% between 2024 and 2029.
- Water aeration systems have witnessed significant growth in recent years, driven by the increasing demand from aquaculture. The integration of Internet of Things into water treatment infrastructure is another key trend, enabling remote monitoring and optimization.
- However, the high maintenance requirements for these systems pose a challenge, as regular upkeep is essential to ensure optimal performance and prevent potential system failures. Proper maintenance includes checking and cleaning filters, adjusting air diffusers, and monitoring system pressure. As the market continues to evolve, addressing these challenges and leveraging emerging technologies will be crucial for market participants to remain competitive.
What will be the Size of the Water Aeration Systems Market During the Forecast Period?

- The market encompasses technologies and solutions designed to enhance the dissolved oxygen levels in bodies of water, promoting healthy aquatic ecosystems and facilitating effective water treatment processes. Key market drivers include lake destratification, oxygenation barges, and secondary treatment applications. Dissolved gases, such as carbon dioxide, radon, methane, hydrogen sulfide, and volatile organic compounds, are often targeted for reduction through these systems. Freshwater scarcity and the growing demand for wastewater treatment solutions have fueled market growth.
- Furthermore, gravel bed aerators, spray systems, slot tray aerators, cascade aerators, and inclined apron aerators are common types employed in various applications. Installation costs and energy efficiency remain critical factors influencing market trends. The market is expected to continue expanding, driven by the need for sustainable water management solutions and increasing awareness of the environmental benefits of water aeration technologies.
How is this Water Aeration Systems Industry segmented and which is the largest segment?
The industry research report provides comprehensive data (region-wise segment analysis), with forecasts and estimates in "USD billion" for the period 2025-2029, as well as historical data from 2019-2023 for the following segments.
- Type
- Subsurface aerators
- Surface aerators
- Hybrid aerators
- End-user
- Municipalities
- Industrial
- Others
- Technology
- Fine bubble aeration
- Coarse bubble aeration
- Mechanical aeration
- Jet aeration
- Others
- Geography
- APAC
- China
- India
- Japan
- South Korea
- North America
- Canada
- US
- Europe
- Germany
- UK
- France
- Italy
- Middle East and Africa
- South America
- APAC
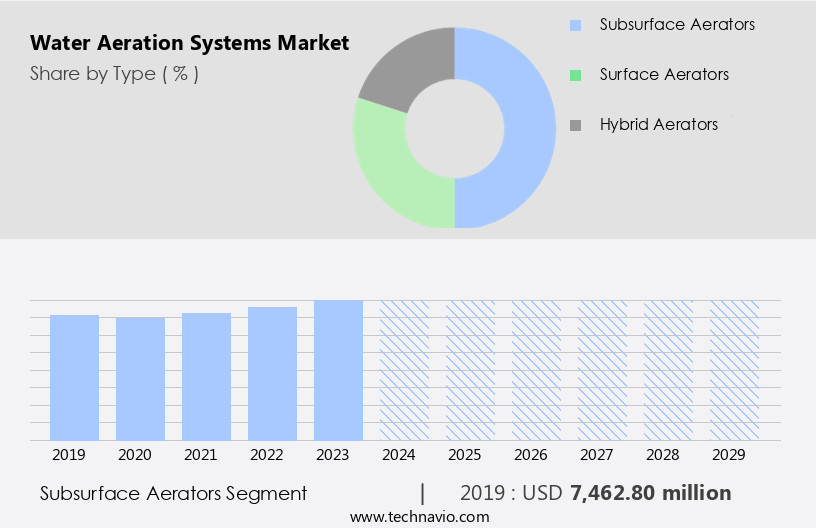
By Type Insights
The subsurface aerators segment is estimated to witness significant growth during the forecast period. Subsurface water aeration systems provide an effective solution for enhancing oxygen levels and improving water quality in ponds, particularly in deeper areas where surface aeration may not reach. These systems utilize a shore-based air compressor to supply oxygen through a hose to a diffuser resting on the pond bottom. The number of diffuser modules can range from one to four, connected to the compressor via weighted tubing. The compressor pumps air to the pond bottom, ensuring adequate oxygen levels during warmer months. This method is ideal for maintaining a natural pond appearance while promoting a healthier ecosystem.
Get a glance at the share of various segments. Request Free Sample
The subsurface aerators segment was valued at USD 7.46 billion in 2019 and showed a gradual increase during the forecast period.
Regional Analysis
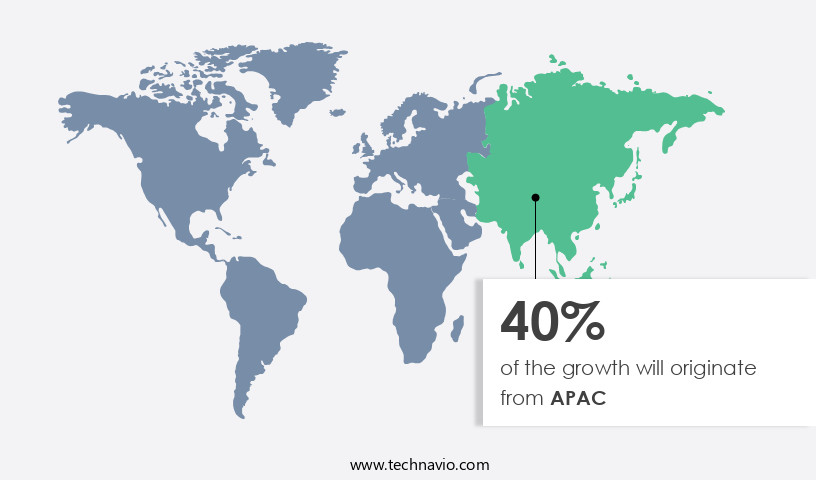
APAC is estimated to contribute 40% to the growth of the global market during the forecast period. Technavio's analysts have elaborately explained the regional trends and drivers that shape the market during the forecast period.
For more insights on the market share of various regions, Request Free Sample
The Asia Pacific region's population growth and urbanization have intensified the demand for clean water and sanitation services, leading to an expansion of municipal water and wastewater treatment infrastructure. Governments in APAC countries are prioritizing investments in water infrastructure to address water scarcity, pollution, and public health challenges. National initiatives, sanitation programs, and urban development plans are driving significant funding for water and wastewater treatment projects, creating opportunities for water aeration systems suppliers.
For instance, in March 2024, the Brihanmumbai Municipal Corporation in Mumbai, India, awarded a contract to Welspun Enterprises for a 2,000 million liter daily water treatment plant. They play a crucial role in lake destratification, oxygenation, and water treatment, enhancing dissolved gases such as oxygen while reducing carbon dioxide, radon, methane, hydrogen sulfide, and volatile organic compounds. Water aeration systems are integral to addressing freshwater scarcity and wastewater treatment, with various technologies including gravel bed aerators, spray systems, slot tray aerators, cascade aerators, and inclined apron aerators.
Market Dynamics
Our researchers analyzed the data with 2024 as the base year, along with the key drivers, trends, and challenges. A holistic analysis of drivers will help companies refine their marketing strategies to gain a competitive advantage.
What are the key market drivers leading to the rise In the adoption of Water Aeration Systems Industry?
Rising demand for water aeration systems from the aquaculture industry is the key driver of the market.
- Water aeration systems have gained significant traction in various industries due to their ability to enhance water quality and promote the growth of aquatic organisms. In the context of aquaculture, these systems play a crucial role in preventing harmful algae blooms, improving poor water quality, and regulating fluctuating temperatures. Aquaculture, which involves the farming of fish, crustaceans, mollusks, and aquatic plants, is a growing industry driven by increasing health awareness and population growth. The demand for protein-rich aquaculture products, which are rich in vitamins, minerals, and omega-3 fatty acids, has been on the rise as more people seek nutritious food sources. Water aeration systems are employed to maintain optimal water conditions for aquatic organisms. These systems introduce dissolved gases, such as oxygen, into the water to support aquatic life. They also help reduce the presence of harmful gases, such as carbon dioxide, radon, methane, and hydrogen sulfide, as well as volatile organic compounds. Two common types are surface water aeration and subsurface water aeration.
- Similarly, surface water aeration systems, such as spray systems, gravel bed aerators, and cascade aerators, work by introducing oxygen to the water surface. In contrast, subsurface water aeration systems, like inclined apron aerators and slot tray aerators, inject oxygen into the water below the surface. Both types of systems have their advantages and are used depending on the specific needs of the aquaculture operation. The installation cost can vary depending on the size and complexity of the project. Despite the initial investment, the benefits of improved water quality and increased productivity make them a valuable investment for the aquaculture industry.
What are the market trends shaping the Water Aeration Systems Industry?
Integration of IoT with water treatment infrastructure is the upcoming market trend.
- The market is witnessing significant growth due to the increasing focus on Lake Destratification and Water Treatment Aeration. They play a crucial role in enhancing the dissolved gases, such as oxygen, carbon dioxide, radon, methane, and hydrogen sulfide, in water bodies. This, in turn, helps in reducing Volatile Organic Compounds (VOCs) and improving water quality. Secondary treatment processes in Wastewater treatment plants also rely heavily on water aeration systems. These systems aid In the efficient removal of impurities and the promotion of beneficial microorganisms. The implementation of IoT-based technologies is a major trend In the market, enabling real-time monitoring and optimization of water treatment processes.
- Installation costs and the choice between Surfacewater aeration and Subsurface water aeration systems are key considerations for market participants. Gravel bed aerators, Spray systems, Slot tray aerators, Cascade aerators, and Inclined apron aerators are some of the popular types. Health awareness and the need for sustainable water treatment solutions are also driving market growth. IoT sensors are increasingly being used In the wastewater industry to monitor water quality and regulate water flows, making water treatment plants more efficient and responsive. Digitalization and the optimization of operations are essential for reducing water wastage and minimizing the use of chemical treatments. The market is expected to continue its growth trajectory during the forecast period.
What challenges does the Water Aeration Systems Industry face during its growth?
High maintenance requirements are a key challenge affecting the industry's growth.
- Water aeration systems play a crucial role in enhancing the efficiency of water treatment processes, particularly In the area of lake destratification and wastewater treatment. These systems facilitate the introduction of dissolved gases, such as oxygen, into bodies of water to promote the breakdown of organic matter and reduce the presence of harmful gases like carbon dioxide, radon, methane, hydrogen sulfide, and volatile organic compounds. However, high maintenance requirements pose a challenge to the growth of the market. Surface water aeration systems, for instance, consume substantial energy and incur significant maintenance expenses due to their numerous mechanical parts in direct contact with the waste stream.
- As treatment vessel depth increases, the mechanical system's efficacy declines, leading to dead spots where untreated sludge accumulates. Moreover, aerosol thickens, binds, hardens, and tends to get deposited on water aeration systems, causing clogging, a phenomenon known as scaling. This reduces the equipment's lifespan and leads to decreased performance and increased energy consumption. Secondary treatment processes, such as those using gravel bed aerators, spray systems, slot tray aerators, cascade aerators, and inclined apron aerators, also face challenges due to high installation costs and health awareness concerns. Despite these challenges, the demand continues to grow due to freshwater scarcity and the need for effective water treatment solutions.
Exclusive Customer Landscape
The market forecasting report includes the adoption lifecycle of the market, market growth and forecasting, covering from the innovator's stage to the laggard's stage. It focuses on adoption rates in different regions based on penetration. Furthermore, the market report also includes key purchase criteria and drivers of price sensitivity to help companies evaluate and develop their market growth analysis strategies.

Customer Landscape
Key Companies & Market Insights
Companies are implementing various strategies, such as strategic alliances, market forecast, partnerships, mergers and acquisitions, geographical expansion, and product/service launches, to enhance their presence In the industry.
Distington Engineers and Consultants Pvt. Ltd. - The company offers water aeration systems.
The industry research and growth report includes detailed analyses of the competitive landscape of the market and information about key companies, including:
- Distington Engineers and Consultants Pvt. Ltd.
- Henan Eco Environmental Protection Equipment Co. Ltd.
- Hydro Logic
- JC France Industrie
- Kasco Marine
- Newterra Ltd.
- Otterbine Barebo Inc.
- Sagar Aquaculture Pvt. Ltd.
- Sansar Green Technologies Ltd. P
- Smith and Loveless Inc.
- Sree Tech Enviro Products
- Stamford Scientific International Inc.
- Sulzer Ltd.
- Toshio Technology Pvt. Ltd.
- Ultra Span Sdn Bhd
- Veolia
- Vertex Aquatic Solutions
- WesTech Engineering LLC
- Xylem Inc.
Qualitative and quantitative analysis of companies has been conducted to help clients understand the wider business environment as well as the strengths and weaknesses of key industry players. Data is qualitatively analyzed to categorize companies as pure play, category-focused, industry-focused, and diversified; it is quantitatively analyzed to categorize companies as dominant, leading, strong, tentative, and weak.
Research Analyst Overview
Water aeration systems play a crucial role in maintaining the health and quality of various bodies of water, including freshwater lakes and wastewater treatment facilities. These systems enhance the dissolution of gases, such as oxygen, into the water, promoting a balanced ecosystem and ensuring the reduction of harmful compounds. Water aeration is an essential process for lake destratification, which helps prevent the accumulation of nutrients and toxins In the water. By introducing oxygen into the water, aeration systems facilitate the metabolic processes of aquatic organisms, enabling them to thrive and maintain water quality. In the context of wastewater treatment, water aeration is a vital component of secondary treatment processes. The introduction of oxygen into wastewater facilitates the growth of microorganisms responsible for breaking down organic matter, ultimately resulting in cleaner water. The importance extends beyond ecological considerations. With increasing health awareness and freshwater scarcity, the demand for efficient and cost-effective water treatment solutions has grown significantly. They offer a viable solution, as they can reduce the need for chemical treatments and improve the overall efficiency of water treatment processes.
Moreover, two primary types are surface water aeration and subsurface water aeration. Surface water aeration systems, such as spray systems and cascade aerators, introduce oxygen into the water through the surface, while subsurface water aeration systems, like gravel bed aerators and inclined apron aerators, introduce oxygen into the water through the bottom. The choice between surface and subsurface aeration systems depends on various factors, including the specific water quality requirements, the size of the body of water, and the installation cost. Surface aeration systems are often more cost-effective for smaller bodies of water, while subsurface aeration systems are more suitable for larger bodies of water or those with specific water quality challenges. They also help mitigate the presence of harmful gases, such as carbon dioxide, methane, radon, and hydrogen sulfide, in the water. These gases can pose health risks and contribute to the degradation of water quality. By introducing oxygen into the water, aeration systems help reduce the concentration of these gases, ensuring a healthier and more sustainable water ecosystem.
Furthermore, water aeration systems play a crucial role In the reduction of volatile organic compounds (VOCs) in water. VOCs are a significant contributor to water pollution and can pose health risks. By promoting the growth of microorganisms responsible for breaking down VOCs, they help improve water quality and ensure a healthier environment. In summary, they are an essential component of maintaining the health and quality of various bodies of water. By introducing oxygen into the water, these systems facilitate the growth of beneficial microorganisms, reduce the presence of harmful gases and pollutants, and ultimately contribute to a more sustainable and healthier water ecosystem. The choice between surface and subsurface aeration systems depends on various factors, including water quality requirements, body of water size, and installation cost. With increasing awareness of the importance of water quality and the growing scarcity of freshwater resources, the demand for efficient and cost-effective water aeration solutions is expected to continue growing.
|
Market Scope |
|
|
Report Coverage |
Details |
|
Page number |
227 |
|
Base year |
2024 |
|
Historic period |
2019-2023 |
|
Forecast period |
2025-2029 |
|
Growth momentum & CAGR |
Accelerate at a CAGR of 5.4% |
|
Market growth 2025-2029 |
USD 4.69 billion |
|
Market structure |
Fragmented |
|
YoY growth 2024-2025(%) |
5.0 |
|
Key countries |
US, China, India, Germany, UK, Japan, South Korea, France, Canada, and Italy |
|
Competitive landscape |
Leading Companies, Market Positioning of Companies, Competitive Strategies, and Industry Risks |
What are the Key Data Covered in this Market Research and Growth Report?
- CAGR of the industry during the forecast period
- Detailed information on factors that will drive the growth and forecasting between 2025 and 2029
- Precise estimation of the size of the market and its contribution of the industry in focus to the parent market
- Accurate predictions about upcoming growth and trends and changes in consumer behaviour
- Growth of the market across APAC, North America, Europe, Middle East and Africa, and South America
- Thorough analysis of the market's competitive landscape and detailed information about companies
- Comprehensive analysis of factors that will challenge the market growth of industry companies
We can help! Our analysts can customize this market research report to meet your requirements.