Water Purifiers Market Analysis, Size, and Forecast 2024-2028: North America (US and Canada), Europe (France, Germany, and UK), Middle East and Africa (UAE), APAC (Australia, China, India, and Japan), South America (Brazil), and Rest of World (ROW)

Water Purifiers Market Analysis, Size, and Forecast 2024-2028:
North America (US and Canada), Europe (France, Germany, and UK), Middle East and Africa (UAE), APAC (Australia, China, India, and Japan), South America (Brazil), and Rest of World (ROW)

Published: Mar 2024 179 Pages SKU: IRTNTR77744

Market Overview at a Glance

$19.78 B
Market Opportunity
9.73%
CAGR
8.88
YoY growth 2023-2024(%)

Water Purifiers Market Size 2024-2028

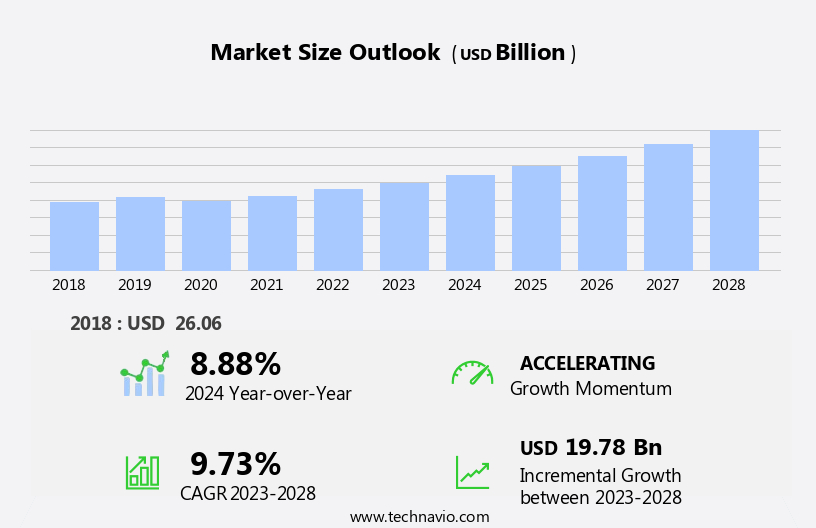
The water purifiers market size is forecast to increase by USD 19.78 billion at a CAGR of 9.73% between 2023 and 2028.

  • The market is driven by the rising incidence of waterborne diseases, which underscores the growing need for clean and safe drinking water. According to the World Health Organization, diarrheal diseases caused by contaminated water kill an estimated 502,000 children under five years old each year. This alarming statistic highlights the urgent demand for water purification solutions. Another key driver is the continuous launch of innovative water purifiers, with companies introducing advanced technologies such as reverse osmosis, UV filtration, and ion exchange to cater to consumers' evolving preferences. However, the market faces challenges as well. The low replacement cycle of water purifiers, which is typically every three to five years, limits the growth potential for manufacturers.
  • Additionally, the high initial investment required for purchasing water purifiers may deter some consumers from making a purchase, particularly in developing countries. Companies in the market must navigate these challenges by offering affordable financing options, extended warranties, and after-sales services to incentivize repeat purchases. To capitalize on opportunities, market players should also focus on expanding their product portfolios to cater to diverse consumer segments and geographies.

What will be the Size of the Water Purifiers Market during the forecast period?

Water Purifiers Market Size

 Request Free Sample

  • The market continues to evolve, driven by the persistent water quality issues and the increasing water crisis in urban areas. Pesticides and water pollution remain significant concerns, leading to the demand for advanced filtration technologies. One such innovation is the Elegant Black Edition RO water purifier, which effectively removes chlorine impurities, minerals, and dissolved solids. However, maintenance costs are a critical factor, with consumers seeking filter media that offer optimal energy levels and extended life. Smart water purifiers, equipped with smart sensors and UV filters, are gaining popularity in both residential and commercial sectors. These feature-rich purifiers enhance skin health and provide pure drinking water for daily activities, including cooking and bathing.
  • Urbanization and increased population have led to a rapid development of the market, with emerging countries adopting water filtration systems to address waterborne diseases such as cryptosporidium and giardia. The market dynamics are further influenced by government programs, purchasing power, and consumer health concerns. End-users demand purifiers that decontaminate water from heavy metals, metabolites, and dangerous bacteria. Point-of-entry filters and gravity filters offer cost-effective solutions, while cloud ro and reverse osmosis systems cater to those seeking cutting-edge technology and advanced purification techniques. The market's continuous unfolding is shaped by various factors, including the evolving water crisis, consumer preferences, and technological advancements.The ongoing need for clean water in daily life, from cooking to bathing, ensures the market's dynamic nature will persist.

How is this Water Purifiers Industry segmented?

The water purifiers industry research report provides comprehensive data (region-wise segment analysis), with forecasts and estimates in "USD billion" for the period 2024-2028, as well as historical data from 2018-2022 for the following segments.

  • End-user
    • Residential
    • Commercial
  • Technology
    • Reverse osmosis (RO)
    • Ultraviolet (UV)
    • Ultrafiltration (UF)
    • Gravity-based
    • Others
  • Distribution Channel
    • Online Retail
    • Offline Retail
    • Direct Sales
  • Product Type
    • Countertop
    • Wall-Mounted
    • Under-Sink
  • Geography
    • North America
      • US
      • Canada
    • Europe
      • France
      • Germany
      • UK
    • Middle East and Africa
      • UAE
    • APAC
      • Australia
      • China
      • India
      • Japan
    • South America
      • Brazil
    • Rest of World (ROW)

By End-user Insights

The residential segment is estimated to witness significant growth during the forecast period.

In today's world, ensuring access to clean and safe drinking water is a significant concern for both residential and commercial consumers. Waterborne diseases and contaminants, including pollutants, viruses, heavy metals, pesticides, and dissolved solids, have become a major health concern, especially in rapidly developing economies with high population densities, such as China and India. The increasing awareness of these issues has led to a surge in demand for water purifiers. Residential consumers, particularly those in urban areas, are investing in water purifiers to eliminate impurities and enhance their living standards. In India, for instance, the annual economic cost of waterborne diseases is estimated to be USD 600 million.

As a result, consumers are adopting residential water purifiers as a reliable source of pure drinking water. Moreover, the commercial sector is also recognizing the importance of clean water for daily activities, such as cooking and bathing. Commercial customers, including schools, hospitals, and offices, are installing water purifiers to provide clean water for their employees and clients. Water filtration technologies, such as Ultra-violet, Reverse Osmosis, and Gravity filters, have gained popularity due to their effectiveness in removing impurities. Smart water purifiers, equipped with smart sensors and a Cloud app, enable users to transmit findings, adjust settings, and notify them of maintenance needs.

Government programs and initiatives aimed at improving water quality and infrastructure are also driving the market for water purifiers. For example, Point-of-Entry filters are being installed in public buildings and housing complexes to ensure clean water at the water entry point. Urbanization and the resulting challenges in water infrastructure, such as aging pipes and pollution, have further boosted the demand for water purifiers. The maintenance cycle and costs of these devices are also becoming more affordable, making them accessible to a broader consumer base. In conclusion, the market for water purifiers is expected to grow significantly during the forecast period due to increasing health concerns, urbanization, and the need for clean water in daily activities.

Water filtration technologies, smart purifiers, and Point-of-Use filters are expected to be the key product types driving the market. The adoption of cutting-edge technology, such as UV filters and RO water purifiers, is also expected to enhance the overall market growth.

Water Purifiers Market Size

Request Free Sample

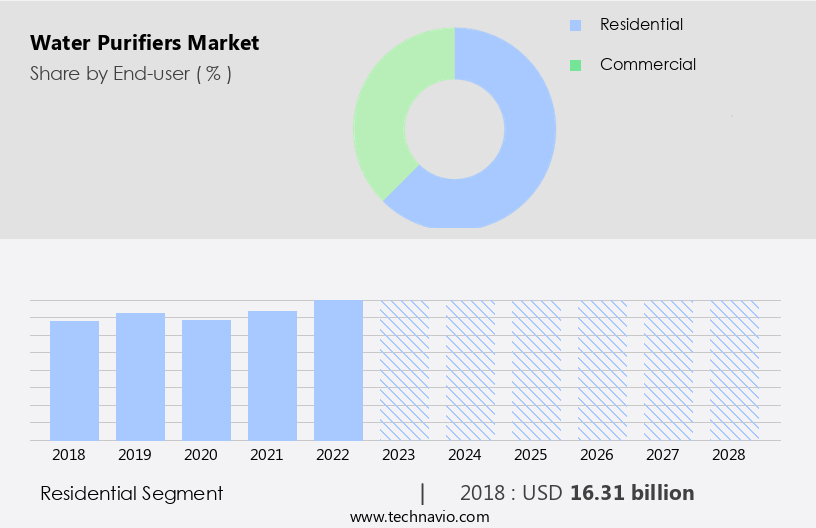
The Residential segment was valued at USD 16.31 billion in 2018 and showed a gradual increase during the forecast period.
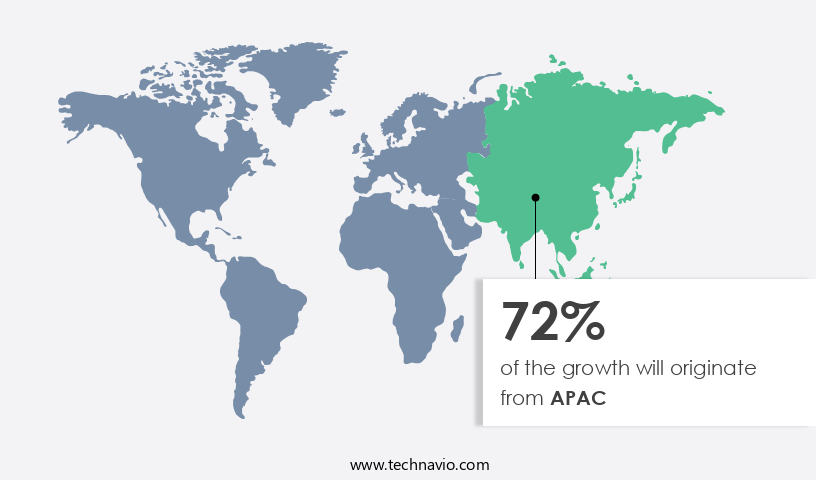
Regional Analysis

APAC is estimated to contribute 72% to the growth of the global market during the forecast period.Technavio's analysts have elaborately explained the regional trends and drivers that shape the market during the forecast period.

Water Purifiers Market Share by Geography

 Request Free Sample

The market in Asia Pacific is projected to expand substantially during the forecast period, driven by the heightened health concerns and increasing living standards in the region. China and India, with their large populations, account for a significant portion of the demand. Waterborne diseases, such as those caused by pollutants like pesticides, heavy metals, and harmful bacteria like Cryptosporidium and Giardia, are prevalent in many parts of Asia Pacific. According to estimates, over 35-37 million Indians fall ill from waterborne diseases each year, and approximately 1-2 million children die from diarrhea. As purchasing power increases in emerging economies like India, the demand for water purifiers has surged.

Water filtration technologies, including Ultra-violet (UV) and Reverse Osmosis (RO), have gained popularity due to their ability to remove dissolved solids, chlorine impurities, and microorganisms like viruses and bacteria. Commercial customers, particularly in the commercial sector, are increasingly investing in water purifying systems to ensure clean water for daily activities like cooking and bathing. Smart water purifiers, equipped with features like smart sensors and cloud apps, allow users to transmit findings, adjust settings, and notify them when maintenance is due. Government programs and initiatives aimed at improving water quality and addressing water crises have also contributed to the market's growth.

Point-of-entry filters, which treat water at the main water entry point, and Point-of-use filters, which treat water at the point of use, are popular options for both residential and commercial customers. Gravity filters and RO filters are commonly used filtration techniques. The market for water purifiers is rapidly developing, with companies like Pentair PLC offering feature-rich, elegant Black Edition RO water purifiers and UV water purifiers for pure drinking water. The market's growth is further fueled by the increasing urbanization and the need for clean water in urban areas. Water recycling and decontamination technologies are also gaining traction as potential solutions to address water scarcity and pollution issues.

Market Dynamics

Our researchers analyzed the data with 2023 as the base year, along with the key drivers, trends, and challenges. A holistic analysis of drivers will help companies refine their marketing strategies to gain a competitive advantage.

What are the key market drivers leading to the rise in the adoption of Water Purifiers Industry?

  • The escalating prevalence of waterborne diseases serves as the primary catalyst for market growth in this sector. 
  • Access to clean and safe drinking water is a pressing concern as urbanization increases and contaminated sources harbor pathogens, leading to waterborne diseases. The Centers for Disease Control and Prevention (CDC) reports that 17 waterborne pathogens are responsible for 7.2 million cases, 120,000 hospitalizations, and 6,600 deaths, as well as USD3 billion in healthcare costs annually in the US. Globally, the World Health Organization (WHO) estimates that microbiologically contaminated water causes approximately 505,000 diarrheic deaths each year. UV water purifiers and reverse osmosis (RO) filters are effective purification techniques for addressing health concerns.
  • UV water purifiers eliminate dangerous bacteria, such as Giardia and cryptosporidium, while RO filters remove heavy metals and chlorine. In the residential sector, point-of-use filters notify users when it's time for replacement, ensuring clean water for daily activities. In emerging countries, these filters offer a solution to waterborne disease risks, enhancing overall health and wellbeing.

What are the market trends shaping the Water Purifiers Industry?

  • The market trend mandates the continuous launch of innovative water purifiers. Two-line response: 1. Water purifier manufacturers are expected to persistently introduce new and advanced products to cater to the evolving consumer demands. 2. This trend signifies the growing importance of ensuring access to clean and safe water through technological advancements.
  • The market is experiencing significant growth due to technological innovations and increasing consumer awareness of the importance of clean water. Advanced filtration technologies, such as Ultra-violet (UV) and activated carbon filters, effectively remove pollutants like dissolved solids, viruses, and bacteria. Smart water purifiers with features like smart sensors and adjustable settings cater to diverse consumer needs and preferences. Commercial sector growth, driven by government programs and commercial customers, is also contributing to market expansion. The focus on energy efficiency, customization, and eco-friendly designs aligns with modern living standards.
  • Recent product launches, like Panasonic's latest water purifiers, showcase these advancements, offering increased tap water purification capacity and user-friendly designs. The market is expected to continue growing during the forecast period, driven by these trends and consumer demand.

What challenges does the Water Purifiers Industry face during its growth?

  • The low replacement cycle of water purifiers poses a significant challenge to the industry's growth by requiring frequent replacements and increasing operational costs. 
  • Water purifiers have become essential appliances in both residential and commercial settings due to growing concerns over water quality. The water crisis, caused by pesticides, water pollution, and other impurities, has led to an increased demand for water filtration systems. The market for water purifiers is driven by the need to protect against waterborne diseases, reduce weight, and ensure optimal energy levels. High-quality RO water purifiers effectively remove Chlorine impurities and minerals, providing clean drinking water. However, the market growth may be hindered by the low replacement cycle of water purifiers. The long lifespan of these appliances, coupled with minimal maintenance costs, results in extended purchase intervals.
  • This reduces the frequency of new sales and slows down market expansion. Despite this challenge, manufacturers continue to innovate, introducing elegant designs like the Black Edition, to cater to consumer preferences. Filter media, such as activated carbon and UV technology, are used to remove metabolites and Cryptosporidium, ensuring water remains safe for consumption. As population growth continues, the demand for water purifiers is expected to increase, providing opportunities for market expansion.

Exclusive Customer Landscape

The water purifiers market forecasting report includes the adoption lifecycle of the market, covering from the innovator's stage to the laggard's stage. It focuses on adoption rates in different regions based on penetration. Furthermore, the water purifiers market report also includes key purchase criteria and drivers of price sensitivity to help companies evaluate and develop their market growth analysis strategies.

Water Purifiers Market Share by Geography

 Customer Landscape

Key Companies & Market Insights

Companies are implementing various strategies, such as strategic alliances, water purifiers market forecast, partnerships, mergers and acquisitions, geographical expansion, and product/service launches, to enhance their presence in the industry.

3M Co. - This company introduces advanced water purification solutions, including the 3M smart drinking water purifier. Employing impact technology, this device effectively eliminates bacteria without water waste. By prioritizing efficiency and sustainability, it sets a new standard in water purification.

The industry research and growth report includes detailed analyses of the competitive landscape of the market and information about key companies, including:

  • 3M Co.
  • A. O. Smith Corp.
  • Advent International Corp.
  • AQUA RO WATER SOLUTIONS
  • AquaSafe Water Solutions
  • Aquatec Plus
  • Axel Johnson Inc
  • Blue Star Ltd.
  • BRITA SE
  • Culligan International Co.
  • General Electric Co.
  • Havells India Ltd.
  • Helen of Troy Ltd.
  • Honeywell International Inc.
  • ispring water system LLC
  • KENT RO Systems Ltd.
  • LG Electronics Inc.
  • Panasonic Holdings Corp.
  • Tata Sons Pvt. Ltd.
  • Unilever PLC

Qualitative and quantitative analysis of companies has been conducted to help clients understand the wider business environment as well as the strengths and weaknesses of key industry players. Data is qualitatively analyzed to categorize companies as pure play, category-focused, industry-focused, and diversified; it is quantitatively analyzed to categorize companies as dominant, leading, strong, tentative, and weak.

Recent Development and News in Water Purifiers Market

  • In February 2024, Bluewater, a leading water purification technology company, introduced the new "Bluewater Pro" series, integrating advanced UV-C technology to eliminate bacteria and viruses, marking a significant advancement in residential water purification systems (Bluewater Press Release, 2024).
  • In August 2025, Veolia Water Technologies, a global water solutions provider, announced a strategic partnership with Microsoft to develop intelligent water management systems, leveraging Microsoft's Azure IoT and AI technologies, aiming to optimize water treatment processes and improve operational efficiency (Veolia Water Technologies Press Release, 2025).
  • In November 2024, Evoqua Water Technologies completed the acquisition of GE Water & Process Technologies, significantly expanding its portfolio and strengthening its position as a global leader in water and wastewater treatment solutions (Evoqua Water Technologies Press Release, 2024).
  • In March 2025, the Indian government launched the "Jal Shakti Abhiyan: Catch the Rain" campaign, focusing on rainwater harvesting and water conservation, creating new opportunities for water purification companies to expand their presence in the Indian market (Ministry of Jal Shakti Press Release, 2025).

Research Analyst Overview

In the dynamic the market, maintenance cycles for flagship products are gaining importance as emerging economies rapidly develop and notify users of potential filter replacements. Reverse osmosis filtration, a cutting-edge technology, is increasingly preferred due to its effectiveness against waterborne diseases. Smart purifiers, with cloud apps and adjustable settings, cater to the growing demand for easy-to-use, feature-rich solutions. Increased population and living standards drive market development potential.

Government programs aiming to provide clean water further fuel the demand. Smart sensors ensure efficient operation and enhance user experience. With purchasing power on the rise, this sector presents significant opportunities for businesses.

Dive into Technavio's robust research methodology, blending expert interviews, extensive data synthesis, and validated models for unparalleled Water Purifiers Market insights. See full methodology.

Market Scope

Report Coverage

Details

Page number

179

Base year

2023

Historic period

2018-2022

Forecast period

2024-2028

Growth momentum & CAGR

Accelerate at a CAGR of 9.73%

Market growth 2024-2028

USD 19.78 billion

Market structure

Fragmented

YoY growth 2023-2024(%)

8.88

Key countries

US, China, Germany, Japan, UK, Australia, India, France, Brazil, Canada, Brazil, UAE, Australia, Rest of World (ROW), and Saudi Arabia

Competitive landscape

Leading Companies, Market Positioning of Companies, Competitive Strategies, and Industry Risks

Request Free Sample

What are the Key Data Covered in this Water Purifiers Market Research and Growth Report?

  • CAGR of the Water Purifiers industry during the forecast period
  • Detailed information on factors that will drive the growth and forecasting between 2024 and 2028
  • Precise estimation of the size of the market and its contribution of the industry in focus to the parent market
  • Accurate predictions about upcoming growth and trends and changes in consumer behaviour
  • Growth of the market across APAC, Europe, North America, South America, and Middle East and Africa
  • Thorough analysis of the market's competitive landscape and detailed information about companies
  • Comprehensive analysis of factors that will challenge the water purifiers market growth of industry companies

We can help! Our analysts can customize this water purifiers market research report to meet your requirements.

Get in touch

1 Executive Summary

  • 1.1 Market overview
    • Exhibit 01: Executive Summary – Chart on Market Overview
    • Exhibit 02: Executive Summary – Data Table on Market Overview
    • Exhibit 03: Executive Summary – Chart on Global Market Characteristics
    • Exhibit 04: Executive Summary – Chart on Market by Geography
    • Exhibit 05: Executive Summary – Chart on Market Segmentation by End-user
    • Exhibit 06: Executive Summary – Chart on Market Segmentation by Technology
    • Exhibit 07: Executive Summary – Chart on Incremental Growth
    • Exhibit 08: Executive Summary – Data Table on Incremental Growth
    • Exhibit 09: Executive Summary – Chart on Vendor Market Positioning

2 Market Landscape

  • 2.1 Market ecosystem
    • Exhibit 10: Parent market
    • Exhibit 11: Market Characteristics

3 Market Sizing

  • 3.1 Market definition
    • Exhibit 12: Offerings of vendors included in the market definition
  • 3.2 Market segment analysis
    • Exhibit 13: Market segments
  • 3.3 Market size 2023
    • 3.4 Market outlook: Forecast for 2023-2028
      • Exhibit 14: Chart on Global - Market size and forecast 2023-2028 ($ billion)
      • Exhibit 15: Data Table on Global - Market size and forecast 2023-2028 ($ billion)
      • Exhibit 16: Chart on Global Market: Year-over-year growth 2023-2028 (%)
      • Exhibit 17: Data Table on Global Market: Year-over-year growth 2023-2028 (%)

    4 Historic Market Size

    • 4.1 Global water purifiers market 2018 - 2022
      • Exhibit 18: Historic Market Size – Data Table on global water purifiers market 2018 - 2022 ($ billion)
    • 4.2 End-user Segment Analysis 2018 - 2022
      • Exhibit 19: Historic Market Size – End-user Segment 2018 - 2022 ($ billion)
    • 4.3 Technology Segment Analysis 2018 - 2022
      • Exhibit 20: Historic Market Size – Technology Segment 2018 - 2022 ($ billion)
    • 4.4 Geography Segment Analysis 2018 - 2022
      • Exhibit 21: Historic Market Size – Geography Segment 2018 - 2022 ($ billion)
    • 4.5 Country Segment Analysis 2018 - 2022
      • Exhibit 22: Historic Market Size – Country Segment 2018 - 2022 ($ billion)

    5 Five Forces Analysis

    • 5.1 Five forces summary
      • Exhibit 23: Five forces analysis - Comparison between 2023 and 2028
    • 5.2 Bargaining power of buyers
      • Exhibit 24: Chart on Bargaining power of buyers – Impact of key factors 2023 and 2028
    • 5.3 Bargaining power of suppliers
      • Exhibit 25: Bargaining power of suppliers – Impact of key factors in 2023 and 2028
    • 5.4 Threat of new entrants
      • Exhibit 26: Threat of new entrants – Impact of key factors in 2023 and 2028
    • 5.5 Threat of substitutes
      • Exhibit 27: Threat of substitutes – Impact of key factors in 2023 and 2028
    • 5.6 Threat of rivalry
      • Exhibit 28: Threat of rivalry – Impact of key factors in 2023 and 2028
    • 5.7 Market condition
      • Exhibit 29: Chart on Market condition - Five forces 2023 and 2028

    6 Market Segmentation by End-user

    • 6.1 Market segments
      • Chart on End-user - Market share (2023-2028) (%)
      • Data Table on End-user - Market share (2023-2028) (%)
    • 6.2 Comparison by End-user
      • Chart on Comparison by End-user
      • Data Table on Comparison by End-user
    • 6.3 Residential - Market size and forecast (2023-2028)
      • Chart on Residential - Market size and forecast (2023-2028) ($ billion)
      • Data Table on Residential - Market size and forecast (2023-2028) ($ billion)
      • Chart on Residential - Year-over-year growth (2023-2028) (%)
      • Data Table on Residential - Year-over-year growth (2023-2028) (%)
    • 6.4 Commercial - Market size and forecast (2023-2028)
      • Chart on Commercial - Market size and forecast (2023-2028) ($ billion)
      • Data Table on Commercial - Market size and forecast (2023-2028) ($ billion)
      • Chart on Commercial - Year-over-year growth (2023-2028) (%)
      • Data Table on Commercial - Year-over-year growth (2023-2028) (%)
    • 6.5 Market opportunity by End-user
      • Market opportunity by End-user ($ billion)
      • Data Table on Market opportunity by End-user ($ billion)

    7 Market Segmentation by Technology

    • 7.1 Market segments
      • Chart on Technology - Market share (2023-2028) (%)
      • Data Table on Technology - Market share (2023-2028) (%)
    • 7.2 Comparison by Technology
      • Chart on Comparison by Technology
      • Data Table on Comparison by Technology
    • 7.3 Reverse osmosis (RO) - Market size and forecast (2023-2028)
      • Chart on Reverse osmosis (RO) - Market size and forecast (2023-2028) ($ billion)
      • Data Table on Reverse osmosis (RO) - Market size and forecast (2023-2028) ($ billion)
      • Chart on Reverse osmosis (RO) - Year-over-year growth (2023-2028) (%)
      • Data Table on Reverse osmosis (RO) - Year-over-year growth (2023-2028) (%)
    • 7.4 Ultraviolet (UV) - Market size and forecast (2023-2028)
      • Chart on Ultraviolet (UV) - Market size and forecast (2023-2028) ($ billion)
      • Data Table on Ultraviolet (UV) - Market size and forecast (2023-2028) ($ billion)
      • Chart on Ultraviolet (UV) - Year-over-year growth (2023-2028) (%)
      • Data Table on Ultraviolet (UV) - Year-over-year growth (2023-2028) (%)
    • 7.5 Ultrafiltration (UF) - Market size and forecast (2023-2028)
      • Chart on Ultrafiltration (UF) - Market size and forecast (2023-2028) ($ billion)
      • Data Table on Ultrafiltration (UF) - Market size and forecast (2023-2028) ($ billion)
      • Chart on Ultrafiltration (UF) - Year-over-year growth (2023-2028) (%)
      • Data Table on Ultrafiltration (UF) - Year-over-year growth (2023-2028) (%)
    • 7.6 Gravity-based - Market size and forecast (2023-2028)
      • Chart on Gravity-based - Market size and forecast (2023-2028) ($ billion)
      • Data Table on Gravity-based - Market size and forecast (2023-2028) ($ billion)
      • Chart on Gravity-based - Year-over-year growth (2023-2028) (%)
      • Data Table on Gravity-based - Year-over-year growth (2023-2028) (%)
    • 7.7 Others - Market size and forecast (2023-2028)
      • Chart on Others - Market size and forecast (2023-2028) ($ billion)
      • Data Table on Others - Market size and forecast (2023-2028) ($ billion)
      • Chart on Others - Year-over-year growth (2023-2028) (%)
      • Data Table on Others - Year-over-year growth (2023-2028) (%)
    • 7.8 Market opportunity by Technology
      • Market opportunity by Technology ($ billion)
      • Data Table on Market opportunity by Technology ($ billion)

    8 Market Segmentation by Distribution Channel

    • 8.1 Market segments
      • Chart on Distribution Channel - Market share (2023-2028) (%)
      • Data Table on Distribution Channel - Market share (2023-2028) (%)
    • 8.2 Comparison by Distribution Channel
      • Chart on Comparison by Distribution Channel
      • Data Table on Comparison by Distribution Channel
    • 8.3 Online Retail - Market size and forecast (2023-2028)
      • Chart on Online Retail - Market size and forecast (2023-2028) ($ billion)
      • Data Table on Online Retail - Market size and forecast (2023-2028) ($ billion)
      • Chart on Online Retail - Year-over-year growth (2023-2028) (%)
      • Data Table on Online Retail - Year-over-year growth (2023-2028) (%)
    • 8.4 Offline Retail - Market size and forecast (2023-2028)
      • Chart on Offline Retail - Market size and forecast (2023-2028) ($ billion)
      • Data Table on Offline Retail - Market size and forecast (2023-2028) ($ billion)
      • Chart on Offline Retail - Year-over-year growth (2023-2028) (%)
      • Data Table on Offline Retail - Year-over-year growth (2023-2028) (%)
    • 8.5 Direct Sales - Market size and forecast (2023-2028)
      • Chart on Direct Sales - Market size and forecast (2023-2028) ($ billion)
      • Data Table on Direct Sales - Market size and forecast (2023-2028) ($ billion)
      • Chart on Direct Sales - Year-over-year growth (2023-2028) (%)
      • Data Table on Direct Sales - Year-over-year growth (2023-2028) (%)
    • 8.6 Market opportunity by Distribution Channel
      • Market opportunity by Distribution Channel ($ billion)
      • Data Table on Market opportunity by Distribution Channel ($ billion)

    9 Market Segmentation by Product Type

    • 9.1 Market segments
      • Chart on Product Type - Market share (2023-2028) (%)
      • Data Table on Product Type - Market share (2023-2028) (%)
    • 9.2 Comparison by Product Type
      • Chart on Comparison by Product Type
      • Data Table on Comparison by Product Type
    • 9.3 Countertop - Market size and forecast (2023-2028)
      • Chart on Countertop - Market size and forecast (2023-2028) ($ billion)
      • Data Table on Countertop - Market size and forecast (2023-2028) ($ billion)
      • Chart on Countertop - Year-over-year growth (2023-2028) (%)
      • Data Table on Countertop - Year-over-year growth (2023-2028) (%)
    • 9.4 Wall-Mounted - Market size and forecast (2023-2028)
      • Chart on Wall-Mounted - Market size and forecast (2023-2028) ($ billion)
      • Data Table on Wall-Mounted - Market size and forecast (2023-2028) ($ billion)
      • Chart on Wall-Mounted - Year-over-year growth (2023-2028) (%)
      • Data Table on Wall-Mounted - Year-over-year growth (2023-2028) (%)
    • 9.5 Under-Sink - Market size and forecast (2023-2028)
      • Chart on Under-Sink - Market size and forecast (2023-2028) ($ billion)
      • Data Table on Under-Sink - Market size and forecast (2023-2028) ($ billion)
      • Chart on Under-Sink - Year-over-year growth (2023-2028) (%)
      • Data Table on Under-Sink - Year-over-year growth (2023-2028) (%)
    • 9.6 Market opportunity by Product Type
      • Market opportunity by Product Type ($ billion)
      • Data Table on Market opportunity by Product Type ($ billion)

    8 Customer Landscape

    • 8.1 Customer landscape overview
      • Exhibit 70: Analysis of price sensitivity, lifecycle, customer purchase basket, adoption rates, and purchase criteria

    9 Geographic Landscape

    • 9.1 Geographic segmentation
      • Exhibit 71: Chart on Market share by geography 2023-2028 (%)
      • Exhibit 72: Data Table on Market share by geography 2023-2028 (%)
    • 9.2 Geographic comparison
      • Exhibit 73: Chart on Geographic comparison
      • Exhibit 74: Data Table on Geographic comparison
    • 9.3 APAC - Market size and forecast 2023-2028
      • Exhibit 75: Chart on APAC - Market size and forecast 2023-2028 ($ billion)
      • Exhibit 76: Data Table on APAC - Market size and forecast 2023-2028 ($ billion)
      • Exhibit 77: Chart on APAC - Year-over-year growth 2023-2028 (%)
      • Exhibit 78: Data Table on APAC - Year-over-year growth 2023-2028 (%)
    • 9.4 Europe - Market size and forecast 2023-2028
      • Exhibit 79: Chart on Europe - Market size and forecast 2023-2028 ($ billion)
      • Exhibit 80: Data Table on Europe - Market size and forecast 2023-2028 ($ billion)
      • Exhibit 81: Chart on Europe - Year-over-year growth 2023-2028 (%)
      • Exhibit 82: Data Table on Europe - Year-over-year growth 2023-2028 (%)
    • 9.5 North America - Market size and forecast 2023-2028
      • Exhibit 83: Chart on North America - Market size and forecast 2023-2028 ($ billion)
      • Exhibit 84: Data Table on North America - Market size and forecast 2023-2028 ($ billion)
      • Exhibit 85: Chart on North America - Year-over-year growth 2023-2028 (%)
      • Exhibit 86: Data Table on North America - Year-over-year growth 2023-2028 (%)
    • 9.6 South America - Market size and forecast 2023-2028
      • Exhibit 87: Chart on South America - Market size and forecast 2023-2028 ($ billion)
      • Exhibit 88: Data Table on South America - Market size and forecast 2023-2028 ($ billion)
      • Exhibit 89: Chart on South America - Year-over-year growth 2023-2028 (%)
      • Exhibit 90: Data Table on South America - Year-over-year growth 2023-2028 (%)
    • 9.7 Middle East and Africa - Market size and forecast 2023-2028
      • Exhibit 91: Chart on Middle East and Africa - Market size and forecast 2023-2028 ($ billion)
      • Exhibit 92: Data Table on Middle East and Africa - Market size and forecast 2023-2028 ($ billion)
      • Exhibit 93: Chart on Middle East and Africa - Year-over-year growth 2023-2028 (%)
      • Exhibit 94: Data Table on Middle East and Africa - Year-over-year growth 2023-2028 (%)
    • 9.8 China - Market size and forecast 2023-2028
      • Exhibit 95: Chart on China - Market size and forecast 2023-2028 ($ billion)
      • Exhibit 96: Data Table on China - Market size and forecast 2023-2028 ($ billion)
      • Exhibit 97: Chart on China - Year-over-year growth 2023-2028 (%)
      • Exhibit 98: Data Table on China - Year-over-year growth 2023-2028 (%)
    • 9.9 India - Market size and forecast 2023-2028
      • Exhibit 99: Chart on India - Market size and forecast 2023-2028 ($ billion)
      • Exhibit 100: Data Table on India - Market size and forecast 2023-2028 ($ billion)
      • Exhibit 101: Chart on India - Year-over-year growth 2023-2028 (%)
      • Exhibit 102: Data Table on India - Year-over-year growth 2023-2028 (%)
    • 9.10 Japan - Market size and forecast 2023-2028
      • Exhibit 103: Chart on Japan - Market size and forecast 2023-2028 ($ billion)
      • Exhibit 104: Data Table on Japan - Market size and forecast 2023-2028 ($ billion)
      • Exhibit 105: Chart on Japan - Year-over-year growth 2023-2028 (%)
      • Exhibit 106: Data Table on Japan - Year-over-year growth 2023-2028 (%)
    • 9.11 US - Market size and forecast 2023-2028
      • Exhibit 107: Chart on US - Market size and forecast 2023-2028 ($ billion)
      • Exhibit 108: Data Table on US - Market size and forecast 2023-2028 ($ billion)
      • Exhibit 109: Chart on US - Year-over-year growth 2023-2028 (%)
      • Exhibit 110: Data Table on US - Year-over-year growth 2023-2028 (%)
    • 9.12 Germany - Market size and forecast 2023-2028
      • Exhibit 111: Chart on Germany - Market size and forecast 2023-2028 ($ billion)
      • Exhibit 112: Data Table on Germany - Market size and forecast 2023-2028 ($ billion)
      • Exhibit 113: Chart on Germany - Year-over-year growth 2023-2028 (%)
      • Exhibit 114: Data Table on Germany - Year-over-year growth 2023-2028 (%)
    • 9.13 Market opportunity by geography
      • Exhibit 115: Market opportunity by geography ($ billion)
      • Exhibit 116: Data Tables on Market opportunity by geography ($ billion)
    • 11.14 UK - Market size and forecast (2023-2028)
      • Chart on UK - Market size and forecast (2023-2028) ($ billion)
      • Data Table on UK - Market size and forecast (2023-2028) ($ billion)
      • Chart on UK - Year-over-year growth (2023-2028) (%)
      • Data Table on UK - Year-over-year growth (2023-2028) (%)
    • 11.15 France - Market size and forecast (2023-2028)
      • Chart on France - Market size and forecast (2023-2028) ($ billion)
      • Data Table on France - Market size and forecast (2023-2028) ($ billion)
      • Chart on France - Year-over-year growth (2023-2028) (%)
      • Data Table on France - Year-over-year growth (2023-2028) (%)
    • 11.16 Canada - Market size and forecast (2023-2028)
      • Chart on Canada - Market size and forecast (2023-2028) ($ billion)
      • Data Table on Canada - Market size and forecast (2023-2028) ($ billion)
      • Chart on Canada - Year-over-year growth (2023-2028) (%)
      • Data Table on Canada - Year-over-year growth (2023-2028) (%)
    • 11.17 Brazil - Market size and forecast (2023-2028)
      • Chart on Brazil - Market size and forecast (2023-2028) ($ billion)
      • Data Table on Brazil - Market size and forecast (2023-2028) ($ billion)
      • Chart on Brazil - Year-over-year growth (2023-2028) (%)
      • Data Table on Brazil - Year-over-year growth (2023-2028) (%)
    • 11.18 UAE - Market size and forecast (2023-2028)
      • Chart on UAE - Market size and forecast (2023-2028) ($ billion)
      • Data Table on UAE - Market size and forecast (2023-2028) ($ billion)
      • Chart on UAE - Year-over-year growth (2023-2028) (%)
      • Data Table on UAE - Year-over-year growth (2023-2028) (%)
    • 11.19 Australia - Market size and forecast (2023-2028)
      • Chart on Australia - Market size and forecast (2023-2028) ($ billion)
      • Data Table on Australia - Market size and forecast (2023-2028) ($ billion)
      • Chart on Australia - Year-over-year growth (2023-2028) (%)
      • Data Table on Australia - Year-over-year growth (2023-2028) (%)
    • 11.20 Saudi Arabia - Market size and forecast (2023-2028)
      • Chart on Saudi Arabia - Market size and forecast (2023-2028) ($ billion)
      • Data Table on Saudi Arabia - Market size and forecast (2023-2028) ($ billion)
      • Chart on Saudi Arabia - Year-over-year growth (2023-2028) (%)
      • Data Table on Saudi Arabia - Year-over-year growth (2023-2028) (%)
    • 11.21 Rest of World (ROW) - Market size and forecast (2023-2028)
      • Chart on Rest of World (ROW) - Market size and forecast (2023-2028) ($ billion)
      • Data Table on Rest of World (ROW) - Market size and forecast (2023-2028) ($ billion)
      • Chart on Rest of World (ROW) - Year-over-year growth (2023-2028) (%)
      • Data Table on Rest of World (ROW) - Year-over-year growth (2023-2028) (%)

    10 Drivers, Challenges, and Trends

    • 10.1 Market drivers
      • 10.2 Market challenges
        • 10.3 Impact of drivers and challenges
          • Exhibit 117: Impact of drivers and challenges in 2023 and 2028
        • 10.4 Market trends

          11 Vendor Landscape

          • 11.1 Overview
            • 11.2 Vendor landscape
              • Exhibit 118: Overview on Criticality of inputs and Factors of differentiation
            • 11.3 Landscape disruption
              • Exhibit 119: Overview on factors of disruption
            • 11.4 Industry risks
              • Exhibit 120: Impact of key risks on business

            12 Vendor Analysis

            • 12.1 Vendors covered
              • Exhibit 121: Vendors covered
            • 12.2 Market positioning of vendors
              • Exhibit 122: Matrix on vendor position and classification
            • 12.3 3M Co.
              • Exhibit 123: 3M Co. - Overview
              • Exhibit 124: 3M Co. - Business segments
              • Exhibit 125: 3M Co. - Key news
              • Exhibit 126: 3M Co. - Key offerings
              • Exhibit 127: 3M Co. - Segment focus
            • 12.4 A. O. Smith Corp.
              • Exhibit 128: A. O. Smith Corp. - Overview
              • Exhibit 129: A. O. Smith Corp. - Business segments
              • Exhibit 130: A. O. Smith Corp. - Key offerings
              • Exhibit 131: A. O. Smith Corp. - Segment focus
            • 12.5 Advent International Corp.
              • Exhibit 132: Advent International Corp. - Overview
              • Exhibit 133: Advent International Corp. - Product / Service
              • Exhibit 134: Advent International Corp. - Key offerings
            • 12.6 Axel Johnson Inc
              • Exhibit 135: Axel Johnson Inc - Overview
              • Exhibit 136: Axel Johnson Inc - Product / Service
              • Exhibit 137: Axel Johnson Inc - Key offerings
            • 12.7 Blue Star Ltd.
              • Exhibit 138: Blue Star Ltd. - Overview
              • Exhibit 139: Blue Star Ltd. - Business segments
              • Exhibit 140: Blue Star Ltd. - Key offerings
              • Exhibit 141: Blue Star Ltd. - Segment focus
            • 12.8 Culligan International Co.
              • Exhibit 142: Culligan International Co. - Overview
              • Exhibit 143: Culligan International Co. - Product / Service
              • Exhibit 144: Culligan International Co. - Key offerings
            • 12.9 Havells India Ltd.
              • Exhibit 145: Havells India Ltd. - Overview
              • Exhibit 146: Havells India Ltd. - Business segments
              • Exhibit 147: Havells India Ltd. - Key offerings
              • Exhibit 148: Havells India Ltd. - Segment focus
            • 12.10 Helen of Troy Ltd.
              • Exhibit 149: Helen of Troy Ltd. - Overview
              • Exhibit 150: Helen of Troy Ltd. - Business segments
              • Exhibit 151: Helen of Troy Ltd. - Key offerings
              • Exhibit 152: Helen of Troy Ltd. - Segment focus
            • 12.11 Honeywell International Inc.
              • Exhibit 153: Honeywell International Inc. - Overview
              • Exhibit 154: Honeywell International Inc. - Business segments
              • Exhibit 155: Honeywell International Inc. - Key news
              • Exhibit 156: Honeywell International Inc. - Key offerings
              • Exhibit 157: Honeywell International Inc. - Segment focus
            • 12.12 ispring water system LLC
              • Exhibit 158: ispring water system LLC - Overview
              • Exhibit 159: ispring water system LLC - Product / Service
              • Exhibit 160: ispring water system LLC - Key offerings
            • 12.13 KENT RO Systems Ltd.
              • Exhibit 161: KENT RO Systems Ltd. - Overview
              • Exhibit 162: KENT RO Systems Ltd. - Product / Service
              • Exhibit 163: KENT RO Systems Ltd. - Key offerings
            • 12.14 LG Electronics Inc.
              • Exhibit 164: LG Electronics Inc. - Overview
              • Exhibit 165: LG Electronics Inc. - Product / Service
              • Exhibit 166: LG Electronics Inc. - Key offerings
            • 12.15 Panasonic Holdings Corp.
              • Exhibit 167: Panasonic Holdings Corp. - Overview
              • Exhibit 168: Panasonic Holdings Corp. - Business segments
              • Exhibit 169: Panasonic Holdings Corp. - Key news
              • Exhibit 170: Panasonic Holdings Corp. - Key offerings
              • Exhibit 171: Panasonic Holdings Corp. - Segment focus
            • 12.16 Tata Sons Pvt. Ltd.
              • Exhibit 172: Tata Sons Pvt. Ltd. - Overview
              • Exhibit 173: Tata Sons Pvt. Ltd. - Business segments
              • Exhibit 174: Tata Sons Pvt. Ltd. - Key news
              • Exhibit 175: Tata Sons Pvt. Ltd. - Key offerings
              • Exhibit 176: Tata Sons Pvt. Ltd. - Segment focus
            • 12.17 Unilever PLC
              • Exhibit 177: Unilever PLC - Overview
              • Exhibit 178: Unilever PLC - Business segments
              • Exhibit 179: Unilever PLC - Key news
              • Exhibit 180: Unilever PLC - Key offerings
              • Exhibit 181: Unilever PLC - Segment focus

            13 Appendix

            • 13.1 Scope of the report
              • 13.2 Inclusions and exclusions checklist
                • Exhibit 182: Inclusions checklist
                • Exhibit 183: Exclusions checklist
              • 13.3 Currency conversion rates for US$
                • Exhibit 184: Currency conversion rates for US$
              • 13.4 Research methodology
                • Exhibit 185: Research methodology
                • Exhibit 186: Validation techniques employed for market sizing
                • Exhibit 187: Information sources
              • 13.5 List of abbreviations
                • Exhibit 188: List of abbreviations

              Research Methodology

              Technavio presents a detailed picture of the market by way of study, synthesis, and summation of data from multiple sources. The analysts have presented the various facets of the market with a particular focus on identifying the key industry influencers. The data thus presented is comprehensive, reliable, and the result of extensive research, both primary and secondary.

              INFORMATION SOURCES

              Primary sources

              • Manufacturers and suppliers
              • Channel partners
              • Industry experts
              • Strategic decision makers

              Secondary sources

              • Industry journals and periodicals
              • Government data
              • Financial reports of key industry players
              • Historical data
              • Press releases

              DATA ANALYSIS

              Data Synthesis

              • Collation of data
              • Estimation of key figures
              • Analysis of derived insights

              Data Validation

              • Triangulation with data models
              • Reference against proprietary databases
              • Corroboration with industry experts

              REPORT WRITING

              Qualitative

              • Market drivers
              • Market challenges
              • Market trends
              • Five forces analysis

              Quantitative

              • Market size and forecast
              • Market segmentation
              • Geographical insights
              • Competitive landscape

              Interested in this report?

              Get your sample now to see our research methodology and insights!

              Download Now

              Frequently Asked Questions

              Water Purifiers market growth will increase by $ 19.78 bn during 2024-2028.

              The Water Purifiers market is expected to grow at a CAGR of 9.73% during 2024-2028.

              Water Purifiers market is segmented by End-user( Residential, Commercial) Technology( Reverse osmosis (RO), Ultraviolet (UV), Ultrafiltration (UF), Gravity-based, Others)

              3M Co., A. O. Smith Corp., Advent International Corp., AQUA RO WATER SOLUTIONS, AquaSafe Water Solutions, Aquatec Plus, Axel Johnson Inc, Blue Star Ltd., BRITA SE, Culligan International Co., General Electric Co., Havells India Ltd., Helen of Troy Ltd., Honeywell International Inc., ispring water system LLC, KENT RO Systems Ltd., LG Electronics Inc., Panasonic Holdings Corp., Tata Sons Pvt. Ltd., Unilever PLC are a few of the key vendors in the Water Purifiers market.

              APAC will register the highest growth rate of 72% among the other regions. Therefore, the Water Purifiers market in APAC is expected to garner significant business opportunities for the vendors during the forecast period.

              US, China, Germany, Japan, UK, Australia, India, France, Brazil, Canada, Brazil, UAE, Australia, Rest of World (ROW), Saudi Arabia

              • Rising incidence of waterborne diseasesWith an increasing global population and urbanization is the driving factor this market.
              • access to clean and safe drinking water has become a critical concern. Contaminated water sources often harbor pathogens is the driving factor this market.
              • leading to the spread of waterborne diseases such as cholera is the driving factor this market.
              • dysentery is the driving factor this market.
              • and gastroenteritis. According to the Centers for Disease Control and Prevention (CDC) is the driving factor this market.
              • 17 pathogens that are spread by water are responsible for 7.2 million cases of waterborne disease annually is the driving factor this market.
              • 120 is the driving factor this market.
              • 000 hospitalizations is the driving factor this market.
              • and 6 is the driving factor this market.
              • 600 deaths in the US every year. Moreover is the driving factor this market.
              • waterborne disease causes $3 billion in healthcare costs in the US every year. According to the World Health Organization (WHO) report is the driving factor this market.
              • microbiologically contaminated drinking water can transmit diseases such as diarrhea is the driving factor this market.
              • cholera is the driving factor this market.
              • dysentery is the driving factor this market.
              • typhoid is the driving factor this market.
              • and polio and is estimated to cause roughly 505 is the driving factor this market.
              • 000 diarrheic deaths per year globally. Most hospitalizations and deaths related to waterborne diseases were caused by biofilm-associated pathogens is the driving factor this market.
              • costing the US healthcare system $2.39 billion annually. Growing awareness of the health risks associated with consuming contaminated water is prompting individuals to seek reliable water purification solutions. Water purifiers act as a preventive measure against waterborne diseases is the driving factor this market.
              • contributing to improved public health. Rapid urbanization can strain existing water infrastructure is the driving factor this market.
              • leading to the contamination of water supplies. As more people reside in densely populated urban areas is the driving factor this market.
              • the risk of waterborne diseases increases is the driving factor this market.
              • necessitating the use of water purifiers for household protection. Industrial and environmental pollution can introduce harmful chemicals and microorganisms into water sources. Water purifiers equipped with advanced filtration technologies address these concerns is the driving factor this market.
              • providing a defense against pollutants that may cause waterborne illnesses. Vulnerable populations is the driving factor this market.
              • such as children is the driving factor this market.
              • the elderly is the driving factor this market.
              • and individuals with weakened immune systems is the driving factor this market.
              • are more susceptible to waterborne diseases. Water purifiers offer a targeted solution to protect these groups from the severe health consequences associated with contaminated water. Thus is the driving factor this market.
              • increasing consumer awareness of water quality issues and the potential health risks associated with contaminated water fuel the demand for water purifiers and is the driving factor this market.
              • in turn is the driving factor this market.
              • will boost the growth of the global water purifiers market during the forecast period. is the driving factor this market.

              The Water Purifiers market vendors should focus on grabbing business opportunities from the Residential segment as it accounted for the largest market share in the base year.