
Water Soluble Fertilizers Market Size 2025-2029
The water soluble fertilizers market size is forecast to increase by USD 3.5 billion, at a CAGR of 6.4% between 2024 and 2029.
- The market is experiencing significant growth due to increasing demand from developing countries. This trend is driven by the expanding agricultural sector in these regions, as water-soluble fertilizers offer faster nutrient absorption and higher crop yields. Another key driver is the adoption of precision farming techniques, which rely on water-soluble fertilizers for efficient nutrient application and improved crop health. However, the market faces challenges, including health concerns regarding the use of these fertilizers. The potential health risks associated with exposure to certain chemicals in water-soluble fertilizers have raised awareness among farmers and regulators, necessitating stricter regulations and safety measures.
- Companies in the market must address these challenges by investing in research and development of safer, more sustainable alternatives to ensure long-term growth and success.
What will be the Size of the Water Soluble Fertilizers Market during the forecast period?

Explore in-depth regional segment analysis with market size data - historical 2019-2023 and forecasts 2025-2029 - in the full report.
Request Free Sample
The water-soluble fertilizers market continues to evolve, driven by the ongoing quest for nutrient efficiency and sustainable agriculture practices. This dynamic market is characterized by the integration of advanced technologies, such as smart farming and precision agriculture, into fertilizer application methods. Nutrient efficiency is a key focus, with an emphasis on optimizing NPK ratios through plant tissue analysis and soil testing. Quality control is paramount, with stringent safety standards and regulatory compliance shaping market activities. Environmental impact is another critical factor, leading to the development of eco-friendly fertilizer blends, such as organic and slow-release options. Granular and controlled-release fertilizers are gaining popularity due to their ability to enhance root development and improve crop nutrition.
Product innovation is a continuous process, with companies investing in research and development to create new formulations and delivery systems. Water management is a growing concern, with the development of fertilizers that minimize water usage and reduce environmental impact. Shelf life and retail sales are also essential considerations, with pricing strategies and supply chain management playing key roles in market success. Fertilizer application methods are evolving, with foliar feeding and bulk blending gaining traction. Inorganic fertilizers continue to dominate the market, but the trend towards organic and sustainable options is on the rise. Nutrient deficiency remains a challenge, necessitating ongoing research and development to address this issue.
The market's continuous dynamism is reflected in the evolving patterns of crop nutrition and soil health. As the market unfolds, companies must remain agile and adapt to changing consumer preferences, regulatory requirements, and technological advancements to remain competitive.
How is this Water Soluble Fertilizers Industry segmented?
The water soluble fertilizers industry research report provides comprehensive data (region-wise segment analysis), with forecasts and estimates in "USD million" for the period 2025-2029, as well as historical data from 2019-2023 for the following segments.
- Type
- Fertigation
- Foliar
- Application
- Nitrogenous
- Potassic
- Phosphatic
- Crop Type
- Field crop
- Horticulture crop
- Turf and ornaments
- Others
- Geography
- North America
- US
- Canada
- Europe
- France
- Germany
- Italy
- Spain
- UK
- APAC
- China
- India
- South America
- Brazil
- Rest of World (ROW)
- North America
By Type Insights
The fertigation segment is estimated to witness significant growth during the forecast period.
Water soluble fertilizers hold significant importance in modern agriculture, particularly in fertigation processes that combine fertilization and irrigation. These fertilizers offer uniform nutrient distribution and improved absorption rates, controlling the absorption pace for optimal plant growth. By minimizing nutrient loss and reducing soil erosion, water soluble fertilizers promote labor cost savings and conserve water. Fertigation applications primarily utilize urea, ammonium nitrate, ammonia, potassium chloride, monoammonium phosphate (MAP), and di-ammonium phosphate (DAP). Nutrient efficiency is a crucial factor driving the market for water soluble fertilizers. Smart farming practices, such as precision agriculture and soil testing, necessitate the use of these fertilizers to ensure nutrient balance and optimize crop yield.
Regulatory compliance and safety standards are essential considerations, with quality control measures ensuring environmental impact is minimized. Product development focuses on nutrient uptake enhancement, yield improvement, and custom blending to cater to specific crop requirements. Inorganic fertilizers, slow-release fertilizers, and organic fertilizers each have their unique advantages, with granular fertilizers and controlled-release fertilizers offering extended nutrient availability. Pricing strategies, bulk blending, and retail sales are essential components of the market, with foliar feeding and fertilizer application techniques influencing nutrient uptake. Nutrient deficiency prevention and root development are essential aspects of crop nutrition, with leaf chlorophyll analysis and plant tissue testing providing valuable insights.
Environmental regulations and sustainability are key factors shaping the market, with an emphasis on chelated micronutrients, soil health, and product innovation. Water management and crop nutrition are interconnected, with wholesale sales and supply chain management playing vital roles in ensuring the availability and affordability of these essential agricultural inputs.
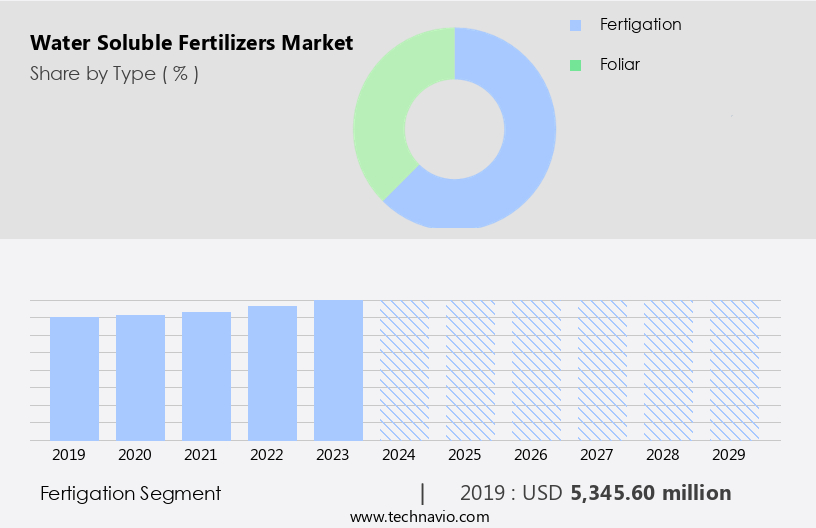
The Fertigation segment was valued at USD 5.35 billion in 2019 and showed a gradual increase during the forecast period.
Regional Analysis
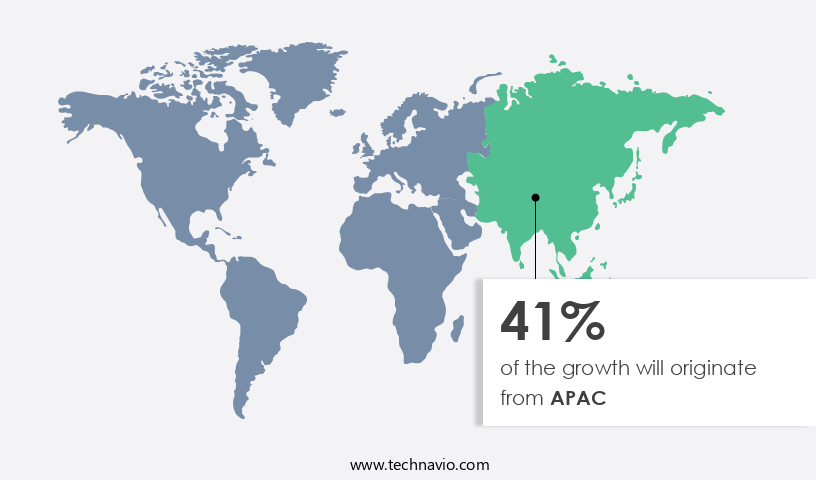
APAC is estimated to contribute 41% to the growth of the global market during the forecast period. Technavio's analysts have elaborately explained the regional trends and drivers that shape the market during the forecast period.
In Europe, the water soluble fertilizer market experiences significant demand, particularly for nitrogenous fertilizers such as urea and nitrates, in countries like Spain, Ukraine, Germany, Russia, and the UK. Wheat and maize remain major consumers of these fertilizers. The need to enhance crop quality and yield has fueled the increase in demand for specialty fertilizers. This trend is anticipated to continue, driving market growth throughout the forecast period. However, the impact of changing climatic conditions on fertilizer demand is complex. Favorable weather in certain areas has boosted production, while unfavorable conditions in others have posed challenges.
Nutrient efficiency is a critical concern in modern agriculture, leading to the adoption of smart farming practices and precision agriculture. Soil testing and plant tissue analysis are essential components of these approaches, ensuring optimal nutrient uptake and application. Regulatory compliance is another significant factor influencing market dynamics. Safety standards for fertilizer handling and application are stringent, requiring adherence to environmental regulations. Product development focuses on innovations such as controlled-release fertilizers, slow-release fertilizers, and organic fertilizers, which improve nutrient efficiency and reduce environmental impact. Custom blending and bulk blending cater to the diverse nutrient requirements of various crops.
Fertilizer application strategies, including foliar feeding and liquid fertilizers, are gaining popularity due to their effectiveness and ease of use. Pricing strategies, including retail sales and wholesale sales, play a crucial role in market competitiveness. Inorganic fertilizers continue to dominate the market, but organic fertilizers are gaining ground due to their sustainability and environmental benefits. Quality control and shelf life are essential considerations for manufacturers and retailers alike. Root development is a key aspect of crop nutrition, and fertilizers play a significant role in promoting healthy root growth. Leaf chlorophyll levels are indicators of plant health and can be influenced by fertilizer application.
Nutrient deficiencies can lead to reduced yields and lower crop quality, emphasizing the importance of proper fertilizer application and nutrient uptake. Environmental impact and soil health are increasingly important concerns in agriculture. Chelated micronutrients and fertilizer blending are solutions that address these issues while maintaining crop nutrition. Water management is a critical component of sustainable agriculture, and fertilizers play a role in optimizing water usage. In conclusion, the water soluble fertilizer market in Europe is driven by the need to improve crop quality and yield, nutrient efficiency, and regulatory compliance. Market trends include the adoption of smart farming practices, precision agriculture, and the use of controlled-release, slow-release, and organic fertilizers.
Factors such as pricing strategies, root development, leaf chlorophyll, nutrient deficiencies, environmental impact, and soil health are essential considerations for market participants.
Market Dynamics
Our researchers analyzed the data with 2024 as the base year, along with the key drivers, trends, and challenges. A holistic analysis of drivers will help companies refine their marketing strategies to gain a competitive advantage.
What are the key market drivers leading to the rise in the adoption of Water Soluble Fertilizers Industry?
- Developing countries' rising demand significantly drives the market's growth.
- Water soluble fertilizers have gained significant traction in the global agricultural industry due to their ability to promote plant growth and enhance nutrient uptake. The increasing focus on precision agriculture and supply chain management has fueled the demand for these fertilizers. Soil testing is a crucial aspect of modern farming practices, and water soluble fertilizers offer the advantage of easy application and quick absorption. The agricultural sectors in countries like China, India, Brazil, Indonesia, and Pakistan are expanding to meet the growing food requirements, leading to an increased demand for water soluble fertilizers. Technology-driven irrigation systems, such as micro drip irrigation, are gaining popularity due to their water-saving capabilities and precision.
- This trend is expected to further boost the demand for water soluble fertilizers. Custom blending and foliar feeding are other applications of water soluble fertilizers that are gaining popularity among farmers. Inorganic fertilizers, which are a type of water soluble fertilizers, provide essential nutrients to plants in a readily available form. Retail sales of water soluble fertilizers are also expected to increase due to their convenience and ease of use. Overall, the market for water soluble fertilizers is expected to grow significantly in the coming years, driven by the demand for high-quality fertilizers and the adoption of technology in agriculture.
What are the market trends shaping the Water Soluble Fertilizers Industry?
- Precision farming, characterized by the use of advanced technology to optimize agricultural production, is becoming an indispensable market trend. Adhering to this trend, professionals in the agricultural industry are increasingly embracing precision farming techniques to enhance efficiency and improve crop yields.
- Water soluble fertilizers play a crucial role in precision farming, a modern agricultural technique that optimizes resource usage and reduces costs. By applying these fertilizers with precision, farmers can control nutrient levels and enhance crop yields. The global market for water soluble fertilizers is experiencing growth due to the increasing adoption of precision farming. This farming method is gaining popularity due to its cost-effectiveness and applicability to limited arable land. Moreover, water soluble fertilizers offer yield improvement and contribute to better soil health. Safety standards and nutrient deficiency concerns are critical factors influencing pricing strategies in the market.
- Bulk blending and the use of chelated micronutrients are essential techniques to ensure optimal nutrient availability and safety. Slow-release fertilizers are another significant trend in the market, as they offer sustained nutrient supply and reduce the need for frequent applications. Product development is a key focus area for market participants, with an emphasis on creating formulations tailored to specific crop requirements and environmental conditions. The demand for water soluble fertilizers is expected to increase in developing countries, including China, India, and Bangladesh, due to their large agricultural sectors and growing focus on precision farming. Overall, the market presents significant opportunities for growth, driven by the increasing adoption of precision farming and the need for efficient nutrient management.
What challenges does the Water Soluble Fertilizers Industry face during its growth?
- The use of water-soluble fertilizers in the industry raises significant health concerns, posing a substantial challenge to its growth.
- Water soluble fertilizers are essential for enhancing crop nutrition, yet their use raises concerns regarding quality control, environmental impact, and health risks. These fertilizers contain various chemicals that, while improving agricultural productivity, can pose health hazards when consumed through contaminated water or food. Chemicals such as cadmium, aluminum, copper, and lead, which take a long time to degrade, can lead to severe health issues including hypertension, skin diseases, kidney failure, and mental retardation. Furthermore, the application of chemical fertilizers can increase the risks of cancer, including leukemia, large intestine cancer, and prostate cancer. To mitigate these risks, it is crucial to ensure strict quality control measures during the production process of water soluble fertilizers.
- Environmental regulations play a significant role in limiting the use of harmful chemicals and promoting the adoption of organic fertilizers. Product innovation in the form of granular fertilizers, which reduce the risk of contamination, and advanced water management techniques, such as drip irrigation, can also help minimize the environmental impact of fertilizer use. Shelf life is another critical factor to consider, as prolonged storage can lead to the degradation of fertilizer quality and potential health risks. By focusing on these areas, the market for water soluble fertilizers can continue to provide essential nutrients to crops while minimizing the associated risks.
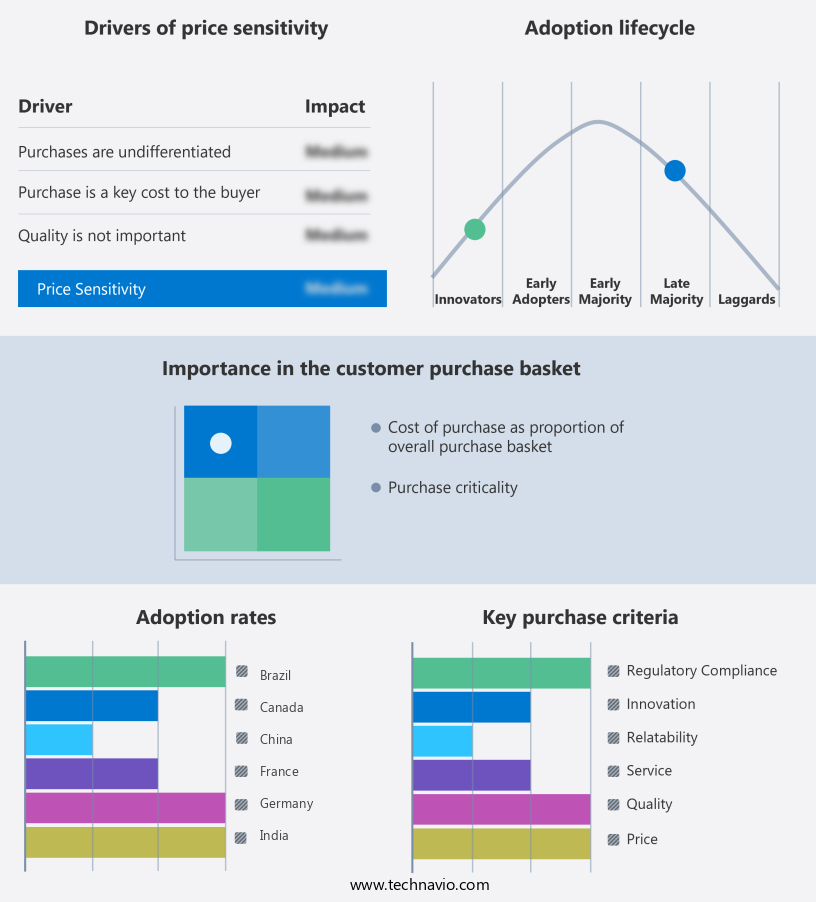
Exclusive Customer Landscape
The water soluble fertilizers market forecasting report includes the adoption lifecycle of the market, covering from the innovator's stage to the laggard's stage. It focuses on adoption rates in different regions based on penetration. Furthermore, the water soluble fertilizers market report also includes key purchase criteria and drivers of price sensitivity to help companies evaluate and develop their market growth analysis strategies.
Customer Landscape
Key Companies & Market Insights
Companies are implementing various strategies, such as strategic alliances, water soluble fertilizers market forecast, partnerships, mergers and acquisitions, geographical expansion, and product/service launches, to enhance their presence in the industry.
Captain Polyplast Ltd. - The company specializes in producing water-soluble fertilizers, including Jeevika brand offerings, delivering essential nutrients to crops effectively and efficiently.
The industry research and growth report includes detailed analyses of the competitive landscape of the market and information about key companies, including:
- Captain Polyplast Ltd.
- CF Industries Holdings Inc.
- Cifo Srl
- Compagnie Financiere et de Participations Roullier
- EID Parry India Ltd.
- Green Has Italia SPA
- Grupa Azoty SA
- Gujarat State Fertilizers and Chemicals Ltd.
- Haifa Negev technologies Ltd.
- Indian Farmers Fertiliser Cooperative Ltd.
- Industries Qatar Q.P.S.C
- Israel Chemicals Ltd.
- KS Aktiengesellschaft
- Nutrien Ltd.
- Sinochem Group Co. Ltd.
- SQM S.A.
- The Mosaic Co.
- Uralchem JSC
- Yara International ASA
- Zuari Agro Chemicals Ltd.
Qualitative and quantitative analysis of companies has been conducted to help clients understand the wider business environment as well as the strengths and weaknesses of key industry players. Data is qualitatively analyzed to categorize companies as pure play, category-focused, industry-focused, and diversified; it is quantitatively analyzed to categorize companies as dominant, leading, strong, tentative, and weak.
Recent Development and News in Water Soluble Fertilizers Market
- In January 2024, Yara International, a leading global fertilizer company, announced the launch of its new water-soluble fertilizer product, YaraMate N, designed for efficient nutrient uptake and improved crop yield (Yara International Press Release, 2024).
- In March 2024, Haifa Group, a leading water-soluble fertilizer manufacturer, entered into a strategic partnership with AgroStar, India's largest agtech company, to expand its reach in the Indian market and enhance its digital sales channels (Haifa Group Press Release, 2024).
- In April 2025, The Mosaic Company, a leading global producer of concentrated phosphate and potash fertilizers, completed the acquisition of ICL Fertilizers' water-soluble fertilizer business, significantly expanding its product portfolio and market share in this segment (The Mosaic Company Press Release, 2025).
- In May 2025, the European Commission approved the use of certain water-soluble fertilizers containing ammonium nitrate and ammonium sulfate, paving the way for their wider adoption in European agriculture (European Commission Press Release, 2025).
Research Analyst Overview
- The water-soluble fertilizers market experiences dynamic growth as farmers seek to enhance soil fertility and optimize nutrient management. Soil amendments play a crucial role in improving soil structure and pH levels, while precision farming technology, such as GIS mapping and remote sensing, enables efficient irrigation techniques like drip and spray systems. Irrigation methods like subsurface and NPK analysis ensure water-use efficiency and nutrient availability. Consumer preferences prioritize responsible sourcing, product guarantees, and environmental stewardship. Brands prioritize sustainability practices, including drought tolerance, disease resistance, and pest resistance, to reduce their carbon footprint and meet customer expectations.
- Weed control and plant stress management are also essential, with growth hormones used judiciously to promote plant health and maximize crop yield. International trade and data analytics facilitate market expansion, with technical support and customer service essential for maintaining brand awareness. Fertilizer efficacy and circular economy principles are key trends, with farmers adopting circular farming practices and focusing on nutrient management to minimize waste and maximize productivity. Environmental stewardship and sustainable practices are essential for long-term market success.
Dive into Technavio's robust research methodology, blending expert interviews, extensive data synthesis, and validated models for unparalleled Water Soluble Fertilizers Market insights. See full methodology.
|
Market Scope |
|
|
Report Coverage |
Details |
|
Page number |
219 |
|
Base year |
2024 |
|
Historic period |
2019-2023 |
|
Forecast period |
2025-2029 |
|
Growth momentum & CAGR |
Accelerate at a CAGR of 6.4% |
|
Market growth 2025-2029 |
USD 3502.7 million |
|
Market structure |
Fragmented |
|
YoY growth 2024-2025(%) |
5.9 |
|
Key countries |
China, US, India, France, Germany, Spain, Italy, UK, Brazil, and Canada |
|
Competitive landscape |
Leading Companies, Market Positioning of Companies, Competitive Strategies, and Industry Risks |
What are the Key Data Covered in this Water Soluble Fertilizers Market Research and Growth Report?
- CAGR of the Water Soluble Fertilizers industry during the forecast period
- Detailed information on factors that will drive the growth and forecasting between 2025 and 2029
- Precise estimation of the size of the market and its contribution of the industry in focus to the parent market
- Accurate predictions about upcoming growth and trends and changes in consumer behaviour
- Growth of the market across Europe, APAC, North America, South America, and Middle East and Africa
- Thorough analysis of the market's competitive landscape and detailed information about companies
- Comprehensive analysis of factors that will challenge the water soluble fertilizers market growth of industry companies
We can help! Our analysts can customize this water soluble fertilizers market research report to meet your requirements.
 RIA -
RIA - 
