Wealthtech Solutions Market Size 2024-2028
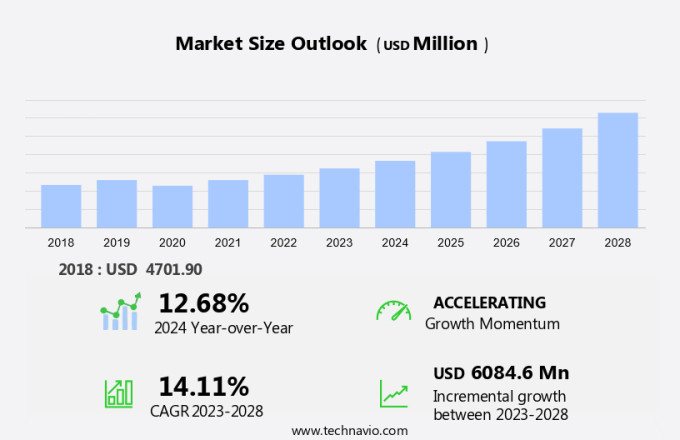
The wealthtech solutions market size is estimated to grow by USD 6.08 billion at a CAGR of 14.11% between 2023 and 2028. Blockchain technology, known for its decentralized and secure data structure, is revolutionizing the wealth management industry. With the growing popularity of blockchain and the increasing number of High Net Worth Individuals (HNIs) globally, wealth technology companies are incorporating AI and Machine Learning to provide personalized investment strategies and enhance security. WealthTech firms are leveraging blockchain to offer transparent and efficient transactions, reducing intermediaries and minimizing risks. The integration of AI and Machine Learning enables these platforms to analyze vast amounts of data, offering customized investment recommendations and real-time market insights. This innovative blend of technologies is transforming wealth management, providing HNIs with a more secure, efficient, and personalized investment experience.
What will be the Size of the Market During the Forecast Period?
For More Highlights About this Report, Request Free Sample
Market Dynamic and Customer Landscape
The WealthTech solutions market is witnessing significant growth due to the increasing adoption of digital tools, Artificial Intelligence (AI), Machine Learning (ML), and Big Data in the financial industry. The millennial population's preference for technology-driven services and the increasing internet penetration are key factors driving this growth. WealthTech solutions offer user-friendly interfaces, cloud-based technologies, AI-based assistance, predictive analytics technology, and automation, making investment and property management more accessible and efficient. Componentwise, the deployment mode for WealthTech solutions is shifting towards cloud-based technologies due to their flexibility and cost-effectiveness. The market caters to various enterprise sizes, offering customized solutions for automation, compliance, and regulation. Predictive analytics, statistics, and modeling techniques are essential components of WealthTech solutions, enabling better decision-making processes, asset liquidity, cost transparency, and customer service. Cryptocurrencies and Blockchain technology are also gaining traction in the market, offering secure and transparent transactions. The market is expected to continue its growth trajectory, offering significant opportunities for players in the Fintech industry. Our researchers analyzed the data with 2023 as the base year, along with the key drivers, trends, and challenges. A holistic analysis of drivers will help companies refine their marketing strategies to gain a competitive advantage.
Key Market Driver
The growing popularity of blockchain is notably driving market growth. Wealthtech solutions, which integrate digital tools, artificial intelligence (AI), and machine learning (ML) capabilities, are revolutionizing the financial services industry. With increasing internet penetration and the growing interest of millennials in fintech, these solutions are becoming essential for property management firms and high-net-worth individuals. Big Data analysis enables personalized investment recommendations and predictive analytics technology facilitates informed decision-making processes. Cloud-based technologies, open-source banking systems, and security solutions ensure data security and privacy. Wealthtech solutions cater to both ultrahigh-net-worth and high-net-worth clients, offering robo-advisory services, portfolio rebalancing, and automation of processes. The competition landscape is intensifying, with the deployment of component-based solutions and outsourcing of non-core functions. Digital wallets and robo-advisory services are gaining popularity due to their cost transparency, user-friendly interfaces, and automation. Machine learning capabilities enable predictive analytics and asset liquidity management. The future of wealth management lies in the integration of AI, ML, and Big Data to provide customized investment solutions, customer service, and AI-based assistance. Thus, such factors are driving the growth of the market during the forecast period.
Significant Market Trends
The rising influence of digitalization is the key trend in the market. Wealthtech solutions have revolutionized the financial industry by integrating digital tools, artificial intelligence (AI), and machine learning (ML) capabilities into traditional wealth management services. With increasing internet penetration and the growing interest of millennials in fintech, these solutions have become essential for property management firms and high-net-worth individuals. AI and ML enable more efficient decision-making processes by analyzing big data and providing user-friendly interfaces. Cloud-based technologies, open-source banking systems, and security solutions are essential components of wealthtech solutions, ensuring data security and transparency. Ultrahigh-net-worth and high-net-worth clients benefit from automation of processes, outsourcing, and robo-advisory services. Machine learning capabilities facilitate portfolio rebalancing and predictive analytics technology, providing cost transparency and customer service through AI-based assistance. The competition landscape in the wealthtech market is intense, with various robo-advisory services offering different deployment modes and enterprise sizes. Digital wallets and retirement assets are other areas where wealthtech solutions are making a significant impact. Asset liquidity and automation are key drivers for the adoption of these solutions. However, concerns regarding data breaches and security remain a challenge that wealthtech providers must address to maintain client trust. Thus, such trends will shape the growth of the market during the forecast period.
Major Market Challenge
The rising data security and privacy concerns is the major challenge that affects the growth of the market. Wealthtech solutions have revolutionized the financial industry by integrating digital tools, artificial intelligence (AI), and machine learning (ML) capabilities to enhance decision-making processes for both millennials and high-net-worth clients. With increasing internet penetration, fintech companies are leveraging big data to offer personalized investment opportunities in cryptocurrencies, property management, and more. Cloud-based technologies, open-source banking systems, and user-friendly interfaces are transforming the wealth management landscape. Security solutions are a priority to mitigate potential data breaches. Wealthtech solutions cater to ultrahigh-net-worth and high-net-worth clients, providing robo-advisory services for retirement assets and automation of investment processes. Robo-advisory services offer machine learning capabilities for portfolio rebalancing and predictive analytics technology for component deployment and cost transparency. The competition landscape is fierce, with various players offering diverse deployment modes and enterprise sizes. Security, automation, customer service, and AI-based assistance are key components of a successful wealthtech solution. Digital wallets and automation of processes through outsourcing are also gaining popularity, making wealth management more accessible and efficient. Hence, the above factors will impede the growth of the market during the forecast period.
Exclusive Customer Landscape
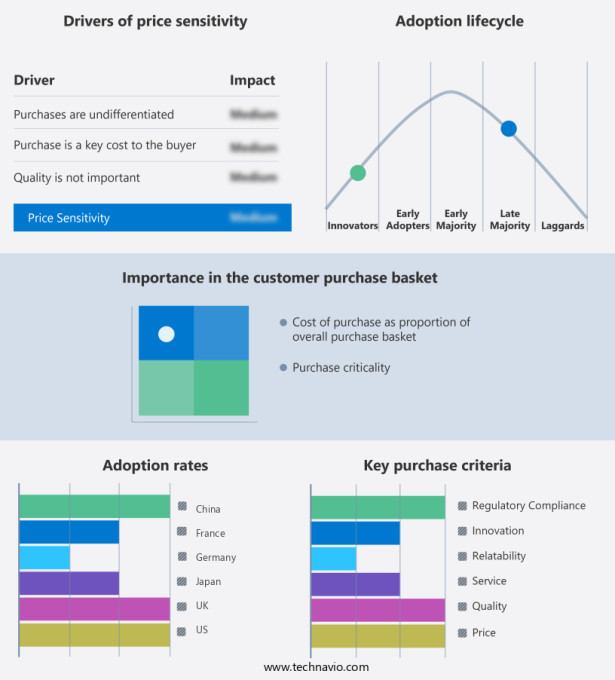
The market forecasting report includes the adoption lifecycle of the market, covering from the innovator’s stage to the laggard’s stage. It focuses on adoption rates in different regions based on penetration. Furthermore, the report also includes key purchase criteria and drivers of price sensitivity to help companies evaluate and develop their market growth analysis strategies.
Customer Landscape
Key Companies & Market Insights
Companies are implementing various strategies, such as strategic alliances, partnerships, mergers and acquisitions, geographical expansion, and product/service launches, to enhance their presence in the market.
Addepar, Inc - The company offers wealth tech solutions such as Addepar, a multi-product tech and data platform.
The market research and growth report also includes detailed analyses of the competitive landscape of the market and information about key companies, including:
- Acorn Wealth Management Group Ltd
- Addepar, Inc
- aixigo AG
- ARC Group Ltd
- BlackRock Inc.
- Bravura Solutions Ltd.
- Broadridge Financial Solutions Inc.
- Creant Technologies Pvt Ltd.
- Empower Annuity Insurance Co. of America
- Etops
- Fidelity National Information Services Inc.
- FNZ Group Technologies Ltd.
- InvestSuite
- Mirador LLC
- Synechron Technologies Pvt Ltd
- Tata Consultancy Services Ltd.
- Valuefy Technologies Private Limited
- Virtusa Corp.
- Wealthfront Corp.
- WealthTechs Inc
Qualitative and quantitative analysis of companies has been conducted to help clients understand the wider business environment as well as the strengths and weaknesses of key market players. Data is qualitatively analyzed to categorize companies as pure play, category-focused, industry-focused, and diversified; it is quantitatively analyzed to categorize companies as dominant, leading, strong, tentative, and weak.
Market Segmentation
By Deployment
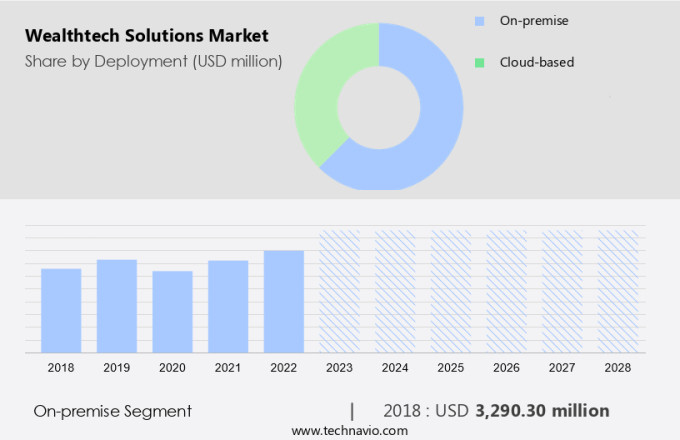
The on-premise segment is estimated to witness significant growth during the forecast period. Wealthtech solutions have revolutionized the financial industry by integrating digital tools, artificial intelligence (AI), machine learning (ML), and big data to cater to the needs of millennials and high-net-worth individuals. Fintech innovation, fueled by internet penetration, has given rise to cryptocurrencies, blockchain, and digital wallets, transforming investment and property management processes.
Get a glance at the market share of various regions Download the PDF Sample
The on-premise segment accounted for USD 3.30 billion in 2018. Wealth management firms are adopting AI-based decision-making processes, user-friendly interfaces, and cloud-based technologies to provide open-source banking systems, security solutions, and predictive analytics technology. On-premise wealthtech solutions remain popular among larger wealth management firms and financial institutions that prioritize data security and compliance. These firms prefer on-premise deployments due to enhanced security features and seamless integration with legacy IT systems. Machine learning capabilities enable automation of processes, including portfolio rebalancing and outsourcing, while robo-advisory services offer cost transparency and customer service with AI-based assistance. The competition landscape in the wealthtech market is diverse, with a focus on automation, asset liquidity, and component deployment modes. Enterprise size is a significant factor in the choice between on-premise and cloud-based solutions. Regardless of deployment mode, security remains a critical concern, with data breaches posing a significant risk to both on-premise and cloud-based wealthtech solutions. Ultrahigh-net-worth and high-net-worth clients demand customized, tailored solutions, making the market for wealthtech solutions a promising and dynamic space for growth.
Regional Analysis
For more insights on the market share of various regions Download PDF Sample now!
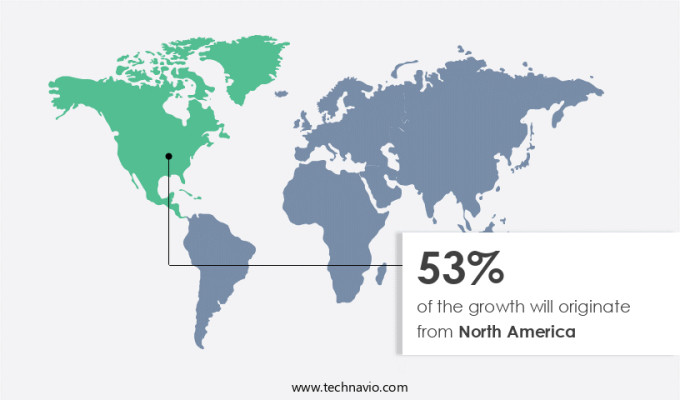
North America is estimated to contribute 53% to the growth of the global market during the market forecast period. Technavio’s analysts have elaborately explained the regional trends and drivers that shape the market during the forecast period.
Wealthtech solutions market encompasses the use of technology to optimize compliance and regulation in the financial sector. Predictive analytics and modeling techniques are integral to credit risk assessment and debt collection. Data analytics, fueled by AI technology, assists wealthtech startups in efficient portfolio management and achieving financial goals. Compliance with tax planning and legacy planning is facilitated through digitizing management and outsourcing automation. The IT and banking sectors, along with investment and wealth management firms, are major consumers of wealthtech solutions. Cloud services enable medium enterprises to access these advanced tools, fostering collaborations between companies and organizations. Socially responsible investing and exchange-traded funds are gaining traction in the wealthtech landscape. Venture capital funding continues to fuel innovation in this sector, with notable companies such as Wealthfront Corporation leading the charge. Credit risk, cash flows, and customer relationships are key areas of focus, ensuring the liquidity of assets and enabling effective retirement savings planning.
Segment Overview
The market report provides comprehensive data (region-wise segment analysis), with forecasts and estimates in "USD million " for the period 2024-2028, as well as historical data from 2018-2022 for the following segments.
- Deployment Outlook
- On-premise
- Cloud-based
- Component Outlook
- Solution
- Services
- Region Outlook
- North America
- The U.S.
- Canada
- Europe
- U.K.
- Germany
- France
- Rest of Europe
- APAC
- China
- India
- Middle East & Africa
- Saudi Arabia
- South Africa
- Rest of the Middle East & Africa
- South America
- Argentina
- Brazil
- Chile
- North America
You may also be interested in:
- Wealth Management Market Analysis North America, APAC, Europe, South America, Middle East and Africa - US, China, Japan, Germany, France - Size and Forecast
- Robo Advisory Services Market Analysis North America, Europe, APAC, South America, Middle East and Africa - US, Japan, India, UK, Germany - Size and Forecast
- Personal Finance Software Market Analysis North America, APAC, Europe, South America, Middle East and Africa - US, Canada, China, Japan, UK - Size and Forecast
Market Analyst Overview
Wealthtech solutions have revolutionized the financial industry by integrating digital tools, Artificial Intelligence (AI), and Machine Learning (ML) into traditional financial services. With increasing internet penetration and the growing preference of millennials for digital services, the demand for Wealthtech solutions is on the rise. These solutions offer user-friendly interfaces, cloud-based technologies, and open-source banking systems to cater to the needs of property management firms and high-net-worth clients. Wealthtech solutions provide AI-based assistance for decision-making processes, automation of processes, and outsourcing of services. Robo-advisory services, digital wallets, and portfolio rebalancing are some of the popular components of Wealthtech solutions. Machine learning capabilities enable predictive analytics technology, providing valuable insights for investment opportunities. Security solutions are a crucial aspect of Wealthtech solutions, addressing concerns related to data breaches. Wealthtech solutions cater to both ultrahigh-net-worth and high-net-worth clients, offering cost transparency, customer service, and automation. The competition landscape in the Wealthtech market is intense, with players like Portfolio management and Asset liquidity providers, offering different deployment modes and catering to enterprise sizes. Overall, Wealthtech solutions offer a more efficient, cost-effective, and personalized approach to investment management.
|
Market Scope |
|
|
Report Coverage |
Details |
|
Page number |
185 |
|
Base year |
2023 |
|
Historic period |
2018-2022 |
|
Forecast period |
2024-2028 |
|
Growth momentum & CAGR |
Accelerate at a CAGR of 14.11% |
|
Market growth 2024-2028 |
USD 6.08 billion |
|
Market structure |
Fragmented |
|
YoY growth 2023-2024(%) |
12.68 |
|
Regional analysis |
North America, Europe, APAC, Middle East and Africa, and South America |
|
Performing market contribution |
North America at 53% |
|
Key countries |
US, UK, Germany, France, Japan, and China |
|
Competitive landscape |
Leading Companies, Market Positioning of Companies, Competitive Strategies, and Industry Risks |
|
Key companies profiled |
Acorn Wealth Management Group Ltd, Addepar, Inc, aixigo AG, ARC Group Ltd, BlackRock Inc., Bravura Solutions Ltd., Broadridge Financial Solutions Inc., Creant Technologies Pvt Ltd., Empower Annuity Insurance Co. of America, Etops, Fidelity National Information Services Inc., FNZ Group Technologies Ltd., InvestSuite, Mirador LLC, Synechron Technologies Pvt Ltd, Tata Consultancy Services Ltd., Valuefy Technologies Private Limited, Virtusa Corp., Wealthfront Corp., and WealthTechs Inc |
|
Market dynamics |
Parent market analysis, Market growth inducers and obstacles, Fast-growing and slow-growing segment analysis, COVID-19 impact and recovery analysis and future consumer dynamics, Market condition analysis for forecast period |
|
Customization purview |
If our report has not included the data that you are looking for, you can reach out to our analysts and get segments customized. |
What are the Key Data Covered in this Market Research Report?
- CAGR of the market during the forecast period
- Detailed information on factors that will drive the market growth and forecasting between 2024 and 2028
- Precise estimation of the size of the market and its contribution of the market in focus to the parent market
- Accurate predictions about upcoming market growth and trends and changes in consumer behavior
- Growth of the market across North America, Europe, APAC, Middle East and Africa, and South America
- Thorough analysis of the market’s competitive landscape and detailed information about companies
- Comprehensive analysis of factors that will challenge the growth of market companies


