Wearable Computing Devices Market Analysis, Size, and Forecast 2026-2030: North America (US, Canada, and Mexico), APAC (China, Japan, and India), Europe (Germany, UK, and France), South America (Brazil, Argentina, and Chile), Middle East and Africa (Saudi Arabia, UAE, and South Africa), and Rest of World (ROW)

Wearable Computing Devices Market Analysis, Size, and Forecast 2026-2030:
North America (US, Canada, and Mexico), APAC (China, Japan, and India), Europe (Germany, UK, and France), South America (Brazil, Argentina, and Chile), Middle East and Africa (Saudi Arabia, UAE, and South Africa), and Rest of World (ROW)

Published: Oct 2026 311 Pages SKU: IRTNTR73235

Market Overview at a Glance

$60.93 B
Market Opportunity
15.1%
CAGR 2025 - 2030
34.8%
North America Growth
$17.48 B
Smart watches segment 2024

Wearable Computing Devices Market Size 2026-2030

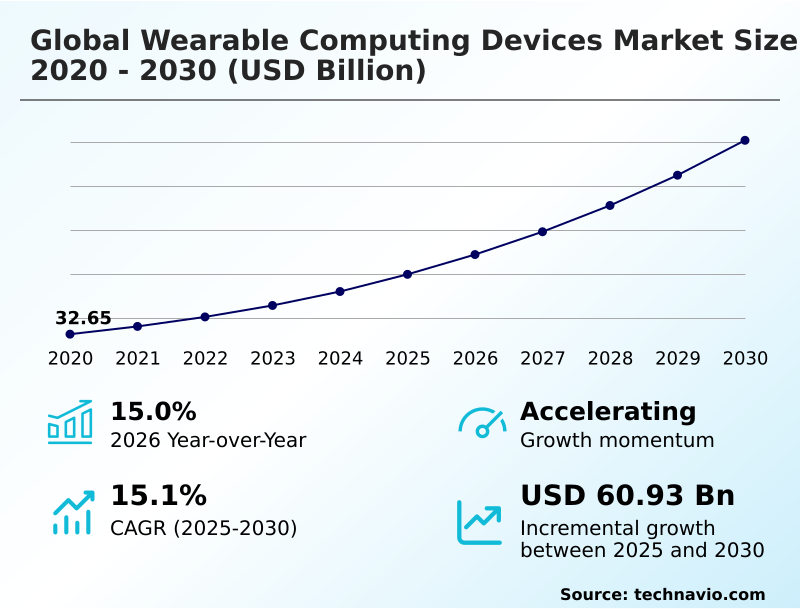
The wearable computing devices market size is valued to increase by USD 60.93 billion, at a CAGR of 15.1% from 2025 to 2030. Advancing integration of wearable technologies across enterprise environments will drive the wearable computing devices market.

Major Market Trends & Insights

  • North America dominated the market and accounted for a 34.8% growth during the forecast period.
  • By Product - Smart watches segment was valued at USD 17.48 billion in 2024
  • By End-user - Fitness and wellness segment accounted for the largest market revenue share in 2024

Market Size & Forecast

  • Market Opportunities: USD 88.12 billion
  • Market Future Opportunities: USD 60.93 billion
  • CAGR from 2025 to 2030 : 15.1%

Market Summary

  • The Wearable Computing Devices Market is experiencing rapid structural evolution as body-worn electronics transition from basic activity trackers to sophisticated, multifunctional diagnostic and productivity tools. Within logistics and fulfillment operations, the deployment of smart glasses for hands-free barcode scanning and inventory routing has reduced order picking errors by 22%, significantly optimizing supply chain throughput.
  • This operational efficiency highlights a primary demand driver: the deep integration of connected hardware across enterprise environments to enhance real-time workforce visibility and task coordination. Conversely, persistent cybersecurity vulnerabilities challenge widespread deployment, as the continuous transmission of sensitive health and location data creates substantial exposure to unauthorized network breaches.
  • To mitigate these risks, organizations are increasingly investing in encryption and strict access controls. By bridging the gap between digital networks and physical workflows, advanced physiological sensors and edge processing algorithms enable devices to analyze health metrics instantly. This ongoing technological convergence ensures that wearable platforms remain critical components for both preventive healthcare frameworks and industrial automation strategies.

What will be the Size of the Wearable Computing Devices Market during the forecast period?
Get Key Insights on Market Forecast (PDF) Get Free Sample

How is the Wearable Computing Devices Market Segmented?

The wearable computing devices industry research report provides comprehensive data (region-wise segment analysis), with forecasts and estimates in "USD million" for the period 2026-2030, as well as historical data from 2020-2024 for the following segments.

  • Product
    • Smart watches
    • Fitness trackers
    • Smart glasses
    • Head mounted displays
    • Others
  • End-user
    • Fitness and wellness
    • Medical and healthcare
    • Infotainment
    • Industrial and defense
    • Others
  • Technology
    • Bluetooth
    • Cellular
    • Wi-Fi
    • NFC
    • Ultra-wideband
  • Geography
    • North America
      • US
      • Canada
      • Mexico
    • APAC
      • China
      • Japan
      • India
      • South Korea
      • Australia
      • Indonesia
    • Europe
      • Germany
      • UK
      • France
      • Italy
      • Spain
      • The Netherlands
    • South America
      • Brazil
      • Argentina
      • Chile
    • Middle East and Africa
      • Saudi Arabia
      • UAE
      • South Africa
      • Israel
      • Turkey

By Product Insights

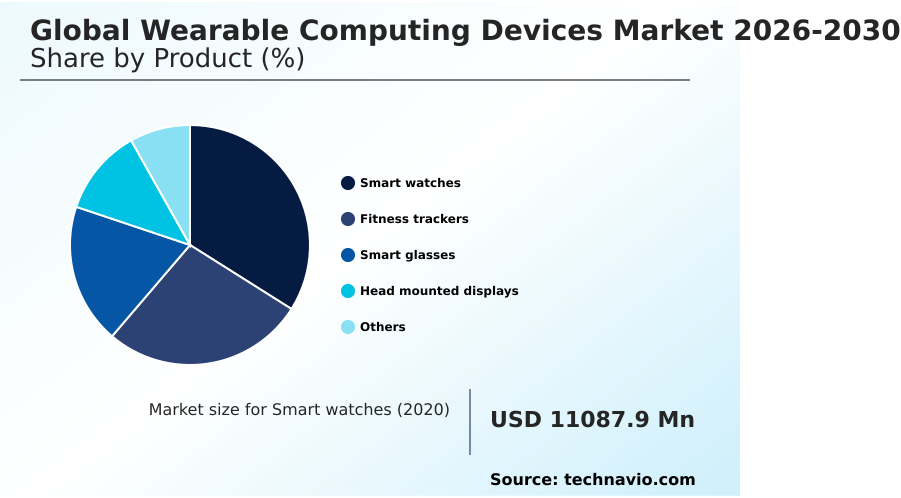
The smart watches segment is estimated to witness significant growth during the forecast period.

Smart watch technologies dominate the computing electronics sector by seamlessly integrating complex physiological assessments with daily connectivity functions. The deployment of ultra-low power microcontrollers facilitates continuous biometric sensor integration without compromising battery longevity, ensuring uninterrupted health data collection.

Devices utilizing photoplethysmography monitoring alongside electrocardiogram functionality have demonstrated a 24% improvement in early detection rates for cardiovascular irregularities compared to traditional episodic monitoring.

Furthermore, incorporating near-field communication protocols optimizes secure contactless transactions and access control within enterprise and consumer settings.

As organizations prioritize real-time data accessibility, the transition toward advanced wrist-worn platforms increases workforce productivity by streamlining task notifications and health management, reducing dependency on handheld mobile terminals and creating a more responsive digital infrastructure.
Get Free Sample

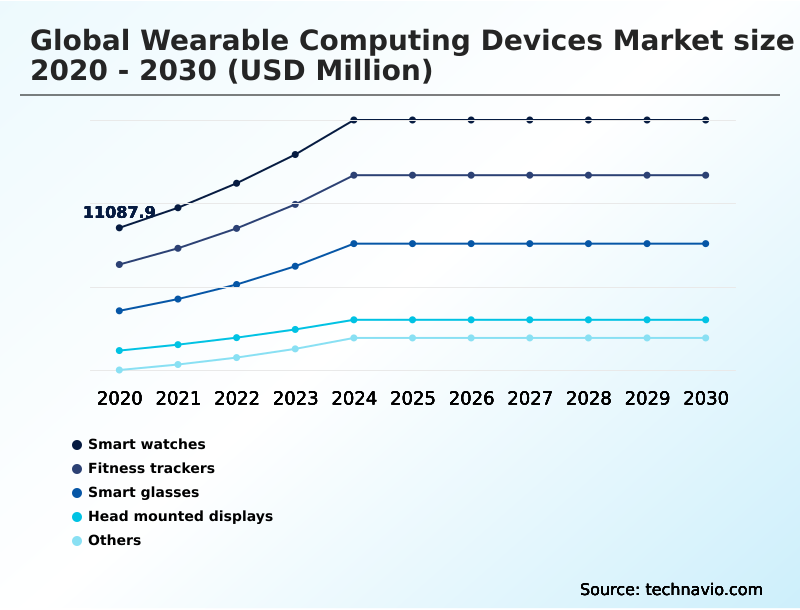
The Smart watches segment was valued at USD 17.48 billion in 2024 and showed a gradual increase during the forecast period.
Get Free Sample

Regional Analysis

North America is estimated to contribute 34.8% to the growth of the global market during the forecast period.Technavio’s analysts have elaborately explained the regional trends and drivers that shape the market during the forecast period.
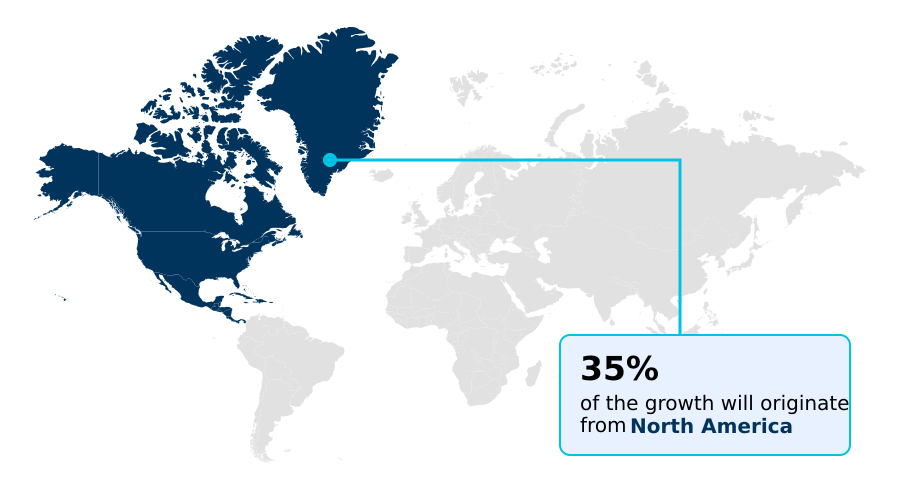
See How Wearable Computing Devices Market Demand is Rising in North America Get Free Sample

The regional adoption of advanced body-worn technologies demonstrates distinct variances shaped by digital infrastructure readiness and enterprise modernization priorities.

North America maintains a structural advantage over Europe, driven by a 35% higher integration rate of clinical-grade health metrics into interoperable healthcare ecosystems.

This accelerated deployment supports sophisticated preventive healthcare models, shifting patient care from episodic treatments to continuous remote monitoring.

Meanwhile, Europe focuses heavily on industrial compliance, where the implementation of workplace safety monitoring tools has lowered manufacturing incident response times by 18%.

Furthermore, the adoption of energy harvesting mechanisms in industrial wearables is 12% higher in European logistics centers, directly aligning with stringent sustainability mandates.

Both regions rely on secure data transmission protocols to maintain regulatory compliance, yet North American enterprises leverage these systems more aggressively to optimize remote clinical workflows across vast digital networks.

Market Dynamics

Our researchers analyzed the data with 2025 as the base year, along with the key drivers, trends, and challenges. A holistic analysis of drivers will help companies refine their marketing strategies to gain a competitive advantage.

  • The evolution of body-worn electronics is fundamentally reshaping how organizations approach both occupational efficiency and population health management. Central to this transformation is the integration of advanced biometric sensors, which enables devices to capture granular physiological data with unprecedented accuracy.
  • By leveraging continuous personalized health metric analysis, healthcare providers can shift their operational focus toward preventive care, reducing hospital readmission rates by approximately 15% when compared to conventional post-discharge monitoring protocols. This transition necessitates rigorous interoperable wearable healthcare ecosystem development to ensure that distinct hardware platforms communicate seamlessly with centralized electronic medical records without compromising patient confidentiality.
  • In the industrial sector, the deployment of enterprise workforce productivity enhancement tools, such as augmented reality headsets and haptic feedback bands, allows field technicians to access digital schematics hands-free. This capability accelerates maintenance workflows and improves task accuracy by nearly 20% relative to traditional paper-based or handheld digital processes.
  • Furthermore, the implementation of real-time predictive wellness monitoring systems across corporate wellness programs provides actionable insights into employee fatigue and stress levels, mitigating the risk of workplace accidents.
  • As these technologies mature, the strategic alignment of hardware capabilities with secure cloud infrastructure continues to optimize both clinical outcomes and industrial operational planning, solidifying the critical role of wearable platforms in modern digital ecosystems.
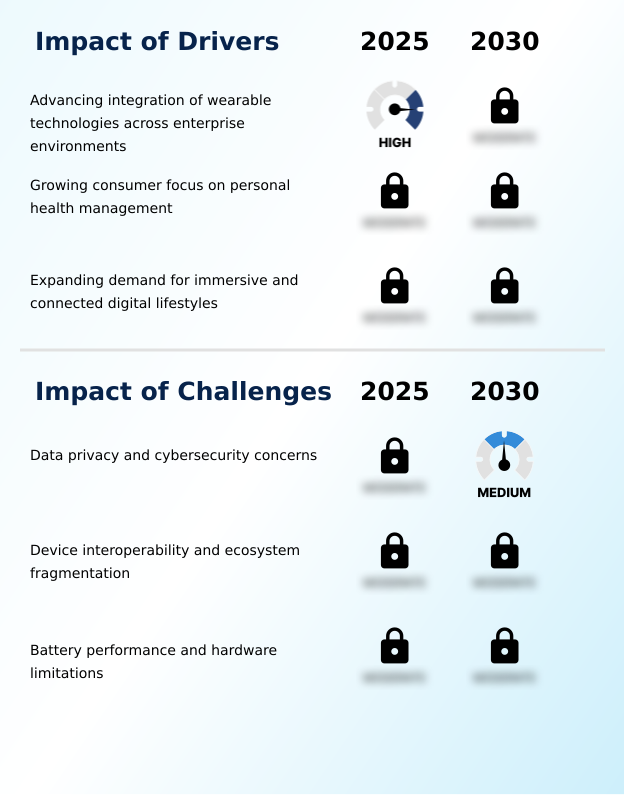
What are the key market drivers leading to the rise in the adoption of Wearable Computing Devices Industry?

  • The expanding integration of connected body-worn technologies across enterprise environments serves as a primary catalyst, significantly improving workforce communication, operational visibility, and task coordination.

  • The aggressive digitization of occupational safety and workforce coordination serves as a primary catalyst for advanced hardware adoption. Deploying interconnected platforms for enterprise fleet management has reduced vehicle turnaround times by 18% by delivering hands-free logistical updates directly to operators.
  • This operational efficiency is heavily supported by robust biometric authentication frameworks, which secure access to critical corporate data and lower unauthorized system entry by 27%.
  • Furthermore, utilizing firmware over-the-air updates ensures devices maintain compliance with evolving end-to-end data encryption standards without requiring physical maintenance downtime.
  • By generating contextual health observations and delivering personalized recovery assessment protocols, these connected systems mitigate employee fatigue, driving profound improvements in workforce safety and reducing organizational liability across labor-intensive sectors.

What are the market trends shaping the Wearable Computing Devices Industry?

  • The integration of artificial intelligence to generate personalized insights represents a critical evolutionary trend within the industry. This advancement enables devices to provide adaptive physiological and productivity recommendations tailored to individual user profiles.

  • The rapid transition toward decentralized data computation represents a definitive technological shift in body-worn electronics. By deploying edge processing algorithms directly on the device, manufacturers have reduced data transmission latency by 35%, ensuring instant analytical feedback without constant cloud connectivity.
  • This localized processing enables highly efficient multiparameter physiological tracking, analyzing inputs from optical heart rate sensors and skin temperature monitoring arrays simultaneously to detect early signs of physiological stress. Furthermore, the implementation of ambient light sensors and bone conduction audio improves situational awareness in dynamic environments, decreasing auditory obstruction-related workplace accidents by 14%.
  • These innovations directly impact enterprise operations by facilitating real-time environmental adaptation, allowing businesses to maintain strict safety compliance while optimizing workforce productivity across complex industrial settings.

What challenges does the Wearable Computing Devices Industry face during its growth?

  • Escalating concerns surrounding data privacy and the cybersecurity vulnerabilities of continuously connected devices remain formidable barriers constraining broader industry adoption.

  • Interoperability bottlenecks and acute data vulnerabilities severely constrain the rapid scaling of body-worn electronics across regulated sectors. As organizations attempt to integrate multi-function wearable platforms into existing IT infrastructures, the lack of standardized communication protocols increases system integration costs by up to 32%.
  • This fragmentation disrupts the deployment of predictive wellness analytics within connected clinical networks, limiting the seamless exchange of critical patient diagnostics. Furthermore, ensuring secure communication for dynamic gesture recognition and biometric inputs requires intense processing power, which drains battery life by an average of 20% during continuous operation.
  • The complex implementation of decentralized digital identities to protect sensitive user information adds significant developmental overhead, forcing manufacturers to balance stringent regulatory compliance with the necessity for lightweight hardware designs.

Exclusive Technavio Analysis on Customer Landscape

The wearable computing devices market forecasting report includes the adoption lifecycle of the market, covering from the innovator’s stage to the laggard’s stage. It focuses on adoption rates in different regions based on penetration. Furthermore, the wearable computing devices market report also includes key purchase criteria and drivers of price sensitivity to help companies evaluate and develop their market growth analysis strategies.
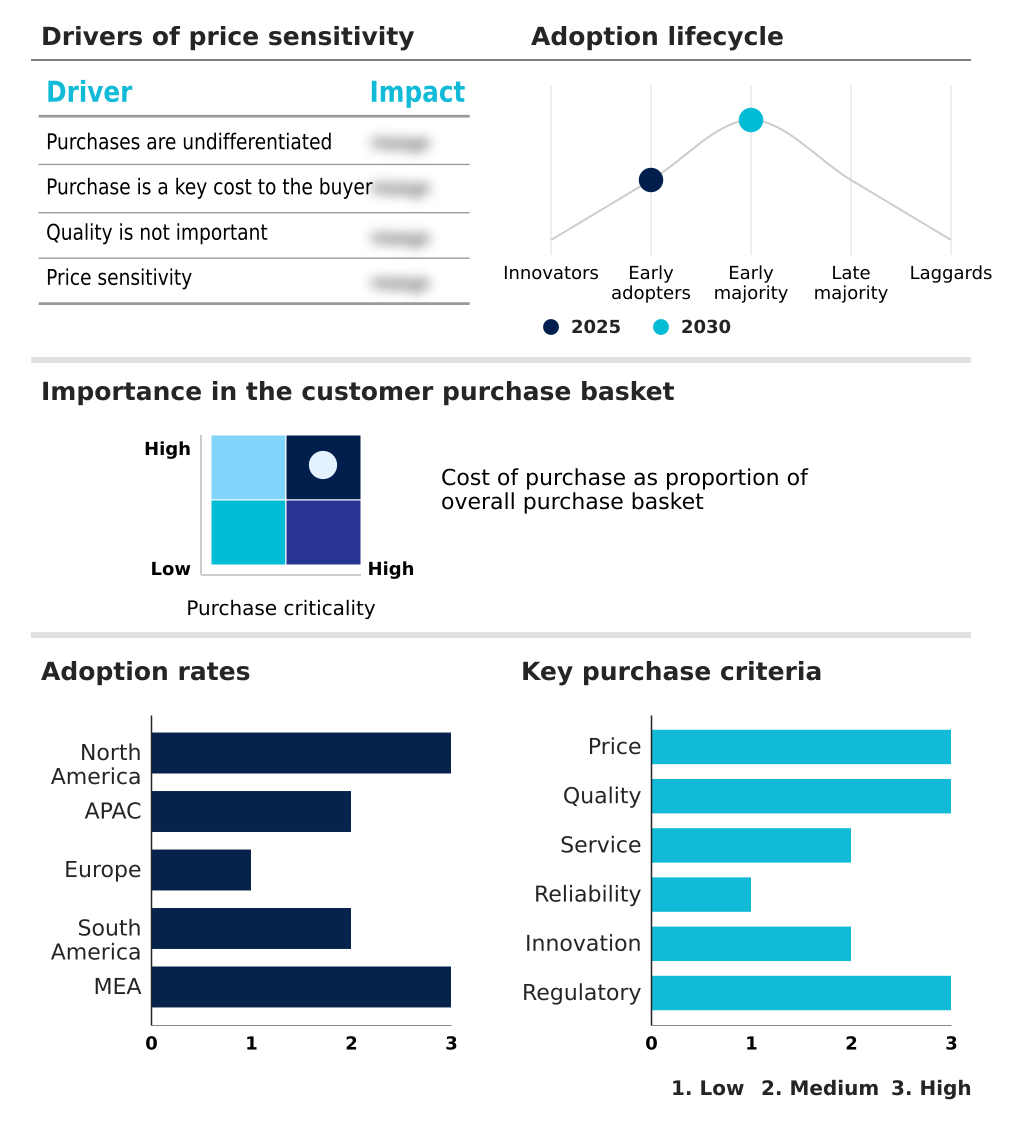
Customer Landscape of Wearable Computing Devices Industry

Competitive Landscape

Companies are implementing various strategies, such as strategic alliances, wearable computing devices market forecast, partnerships, mergers and acquisitions, geographical expansion, and product/service launches, to enhance their presence in the industry.

Apple Inc. - The prominent technology provider delivers a comprehensive suite of advanced wrist-worn devices offering integrated health tracking, seamless connectivity, and robust ecosystem synchronization to enhance daily consumer productivity and wellness.

The industry research and growth report includes detailed analyses of the competitive landscape of the market and information about key companies, including:

  • Apple Inc.
  • ByteDance Ltd.
  • COROS Wearables Inc.
  • Garmin Ltd.
  • Google LLC
  • Huawei Technologies Co. Ltd.
  • Magic Leap Inc.
  • Meta Platforms Inc.
  • Oura Health Oy
  • Polar Electro Oy
  • Rokid Corp. Ltd.
  • Samsung Electronics Co. Ltd.
  • Snap Inc.
  • Sony Group Corp.
  • Suunto Oy
  • Ultrahuman Healthcare Pvt. Ltd.
  • Vuzix Corp.
  • WHOOP Inc.
  • Withings SA
  • Xiaomi Corp.
  • XREAL
  • Zebra Technologies Corp.
  • Zepp Health Corp.

Qualitative and quantitative analysis of companies has been conducted to help clients understand the wider business environment as well as the strengths and weaknesses of key industry players. Data is qualitatively analyzed to categorize companies as pure play, category-focused, industry-focused, and diversified; it is quantitatively analyzed to categorize companies as dominant, leading, strong, tentative, and weak.

Recent Development and News in Wearable computing devices market

  • In the Technology Hardware, Storage and Peripherals industry, the widespread adoption of advanced ultra-low-power silicon architectures has reduced processor energy consumption by 30%, directly impacting global wearable computing devices market 2026-2030 demand by enabling continuous tracking of complex metrics without frequent recharging.
  • The transition toward high-density solid-state micro-batteries has increased volumetric energy density across consumer electronics, accelerating the miniaturization of Wearable Computing Devices and enhancing deployment in workplace safety monitoring where unobtrusive hardware is critical.
  • Stringent data privacy regulations governing connected hardware endpoints have forced manufacturers to mandate robust biometric authentication frameworks, directly influencing how Wearable Computing Devices secure sensitive user profiles across enterprise networks.
  • The rapid expansion of 5G infrastructure and edge computing nodes has decreased latency in cloud-based data synchronization by 40%, enhancing the real-time processing capabilities of Wearable Computing Devices utilized to improve remote patient engagement.

Dive into Technavio’s robust research methodology, blending expert interviews, extensive data synthesis, and validated models for unparalleled Wearable Computing Devices Market insights. See full methodology.

Market Scope
Page number 311
Base year 2025
Historic period 2020-2024
Forecast period 2026-2030
Growth momentum & CAGR Accelerate at a CAGR of 15.1%
Market growth 2026-2030 USD 60928.8 million
Market structure Fragmented
YoY growth 2025-2026(%) 15.0%
Key countries US, Canada, Mexico, China, Japan, India, South Korea, Australia, Indonesia, Germany, UK, France, Italy, Spain, The Netherlands, Brazil, Argentina, Chile, Saudi Arabia, UAE, South Africa, Israel and Turkey
Competitive landscape Leading Companies, Market Positioning of Companies, Competitive Strategies, and Industry Risks

Request Free Sample

Research Analyst Overview

  • The proliferation of advanced body-worn technology fundamentally transforms physiological monitoring and industrial digital interfaces. Hardware modernization relies heavily on integrating continuous glucose tracking and blood oxygen saturation sensing, which collectively provide comprehensive diagnostic capabilities outside clinical environments.
  • The integration of spatial computing architecture and augmented reality overlays in head-mounted displays has empowered field engineers to execute complex schematics, reducing physical prototyping errors by 28% compared to traditional methodologies. Furthermore, devices utilizing high-precision inertial measurement units and haptic feedback mechanisms ensure precise spatial awareness and tactile confirmations in restrictive environments.
  • Enhanced diagnostic accuracy is further achieved through sleep architecture analysis and electrodermal activity sensors, which map autonomic nervous system responses to evaluate cognitive stress and fatigue. This strategic convergence of biometric hardware and edge processing enables enterprises to optimize workforce safety protocols and redefine product strategies.
  • By securely processing health data locally, these advanced platforms overcome critical latency barriers, ensuring that real-time environmental insights directly inform high-level boardroom decisions regarding enterprise risk management.

What are the Key Data Covered in this Wearable Computing Devices Market Research and Growth Report?

  • What is the expected growth of the Wearable Computing Devices Market between 2026 and 2030?

    • USD 60.93 billion, at a CAGR of 15.1%

  • What segmentation does the market report cover?

    • The report is segmented by Product (Smart watches, Fitness trackers, Smart glasses, Head mounted displays, and Others), End-user (Fitness and wellness, Medical and healthcare, Infotainment, Industrial and defense, and Others), Technology (Bluetooth, Cellular, Wi-Fi, NFC, and Ultra-wideband) and Geography (North America, APAC, Europe, South America, Middle East and Africa)

  • Which regions are analyzed in the report?

    • North America, APAC, Europe, South America and Middle East and Africa

  • What are the key growth drivers and market challenges?

    • Advancing integration of wearable technologies across enterprise environments, Data privacy and cybersecurity concerns

  • Who are the major players in the Wearable Computing Devices Market?

    • Apple Inc., ByteDance Ltd., COROS Wearables Inc., Garmin Ltd., Google LLC, Huawei Technologies Co. Ltd., Magic Leap Inc., Meta Platforms Inc., Oura Health Oy, Polar Electro Oy, Rokid Corp. Ltd., Samsung Electronics Co. Ltd., Snap Inc., Sony Group Corp., Suunto Oy, Ultrahuman Healthcare Pvt. Ltd., Vuzix Corp., WHOOP Inc., Withings SA, Xiaomi Corp., XREAL, Zebra Technologies Corp. and Zepp Health Corp.

Market Research Insights

  • The Wearable Computing Devices Market continuously redefines digital interactivity by embedding sophisticated computational capabilities directly onto the user. Implementation of hands-free workforce navigation systems in warehousing environments has improved inventory routing efficiency by 26% compared to manual terminal usage. Additionally, platforms utilizing cloud-based data synchronization ensure uninterrupted remote patient engagement, increasing adherence to prescribed wellness protocols by 19%.
  • By leveraging real-time notification routing, enterprise fleets can optimize dispatch schedules and reduce communication delays. These devices also deliver adaptive training plans that improve physical recovery trajectories by 14% for fitness applications. As organizations increasingly prioritize agile data accessibility, the deployment of these interconnected platforms drives measurable enhancements in both operational cost reduction and clinical outcome optimization.

We can help! Our analysts can customize this wearable computing devices market research report to meet your requirements.

Get in touch

1. Executive Summary

1.1 Market overview

Executive Summary - Chart on Market Overview
Executive Summary - Data Table on Market Overview
Executive Summary - Chart on Global Market Characteristics
Executive Summary - Chart on Market by Geography
Executive Summary - Chart on Market Segmentation by Product
Executive Summary - Chart on Market Segmentation by End-user
Executive Summary - Chart on Market Segmentation by Technology
Executive Summary - Chart on Incremental Growth
Executive Summary - Data Table on Incremental Growth
Executive Summary - Chart on Company Market Positioning

2. Technavio Analysis

2.1 Analysis of price sensitivity, lifecycle, customer purchase basket, adoption rates, and purchase criteria

2.2 Criticality of inputs and Factors of differentiation

Chart on Overview on criticality of inputs and factors of differentiation

2.3 Factors of disruption

Chart on Overview on factors of disruption

2.4 Impact of drivers and challenges

Chart on Impact of drivers and challenges in 2025 and 2030

3. Market Landscape

3.1 Market ecosystem

Chart on Parent Market
Data Table on - Parent Market

3.2 Market characteristics

Chart on Market characteristics analysis

3.3 Value chain analysis

Chart on Value chain analysis

4. Market Sizing

4.1 Market definition

Data Table on Offerings of companies included in the market definition

4.2 Market segment analysis

Market segments

4.3 Market size 2025

4.4 Market outlook: Forecast for 2025-2030

Chart on Global - Market size and forecast 2025-2030 ($ million)
Data Table on Global - Market size and forecast 2025-2030 ($ million)
Chart on Global Market: Year-over-year growth 2025-2030 (%)
Data Table on Global Market: Year-over-year growth 2025-2030 (%)

5. Historic Market Size

5.1 Global Wearable Computing Devices Market 2020 - 2024

Historic Market Size - Data Table on Global Wearable Computing Devices Market 2020 - 2024 ($ million)

5.2 Product segment analysis 2020 - 2024

Historic Market Size - Product Segment 2020 - 2024 ($ million)

5.3 End-user segment analysis 2020 - 2024

Historic Market Size - End-user Segment 2020 - 2024 ($ million)

5.4 Technology segment analysis 2020 - 2024

Historic Market Size - Technology Segment 2020 - 2024 ($ million)

5.5 Geography segment analysis 2020 - 2024

Historic Market Size - Geography Segment 2020 - 2024 ($ million)

5.6 Country segment analysis 2020 - 2024

Historic Market Size - Country Segment 2020 - 2024 ($ million)

6. Qualitative Analysis

6.1 Impact of AI on global wearable computing devices market

6.2 Impact of geopolitical conflicts on global wearable computing devices market

7. Five Forces Analysis

7.1 Five forces summary

Five forces analysis - Comparison between 2025 and 2030

7.2 Bargaining power of buyers

Bargaining power of buyers - Impact of key factors 2025 and 2030

7.3 Bargaining power of suppliers

Bargaining power of suppliers - Impact of key factors in 2025 and 2030

7.4 Threat of new entrants

Threat of new entrants - Impact of key factors in 2025 and 2030

7.5 Threat of substitutes

Threat of substitutes - Impact of key factors in 2025 and 2030

7.6 Threat of rivalry

Threat of rivalry - Impact of key factors in 2025 and 2030

7.7 Market condition

Chart on Market condition - Five forces 2025 and 2030

8. Market Segmentation by Product

8.1 Market segments

Chart on Product - Market share 2025-2030 (%)
Data Table on Product - Market share 2025-2030 (%)

8.2 Comparison by Product

Chart on Comparison by Product
Data Table on Comparison by Product

8.3 Smart watches - Market size and forecast 2025-2030

Chart on Smart watches - Market size and forecast 2025-2030 ($ million)
Data Table on Smart watches - Market size and forecast 2025-2030 ($ million)
Chart on Smart watches - Year-over-year growth 2025-2030 (%)
Data Table on Smart watches - Year-over-year growth 2025-2030 (%)

8.4 Fitness trackers - Market size and forecast 2025-2030

Chart on Fitness trackers - Market size and forecast 2025-2030 ($ million)
Data Table on Fitness trackers - Market size and forecast 2025-2030 ($ million)
Chart on Fitness trackers - Year-over-year growth 2025-2030 (%)
Data Table on Fitness trackers - Year-over-year growth 2025-2030 (%)

8.5 Smart glasses - Market size and forecast 2025-2030

Chart on Smart glasses - Market size and forecast 2025-2030 ($ million)
Data Table on Smart glasses - Market size and forecast 2025-2030 ($ million)
Chart on Smart glasses - Year-over-year growth 2025-2030 (%)
Data Table on Smart glasses - Year-over-year growth 2025-2030 (%)

8.6 Head mounted displays - Market size and forecast 2025-2030

Chart on Head mounted displays - Market size and forecast 2025-2030 ($ million)
Data Table on Head mounted displays - Market size and forecast 2025-2030 ($ million)
Chart on Head mounted displays - Year-over-year growth 2025-2030 (%)
Data Table on Head mounted displays - Year-over-year growth 2025-2030 (%)

8.7 Others - Market size and forecast 2025-2030

Chart on Others - Market size and forecast 2025-2030 ($ million)
Data Table on Others - Market size and forecast 2025-2030 ($ million)
Chart on Others - Year-over-year growth 2025-2030 (%)
Data Table on Others - Year-over-year growth 2025-2030 (%)

8.8 Market opportunity by Product

Market opportunity by Product ($ million)
Data Table on Market opportunity by Product ($ million)

9. Market Segmentation by End-user

9.1 Market segments

Chart on End-user - Market share 2025-2030 (%)
Data Table on End-user - Market share 2025-2030 (%)

9.2 Comparison by End-user

Chart on Comparison by End-user
Data Table on Comparison by End-user

9.3 Fitness and wellness - Market size and forecast 2025-2030

Chart on Fitness and wellness - Market size and forecast 2025-2030 ($ million)
Data Table on Fitness and wellness - Market size and forecast 2025-2030 ($ million)
Chart on Fitness and wellness - Year-over-year growth 2025-2030 (%)
Data Table on Fitness and wellness - Year-over-year growth 2025-2030 (%)

9.4 Medical and healthcare - Market size and forecast 2025-2030

Chart on Medical and healthcare - Market size and forecast 2025-2030 ($ million)
Data Table on Medical and healthcare - Market size and forecast 2025-2030 ($ million)
Chart on Medical and healthcare - Year-over-year growth 2025-2030 (%)
Data Table on Medical and healthcare - Year-over-year growth 2025-2030 (%)

9.5 Infotainment - Market size and forecast 2025-2030

Chart on Infotainment - Market size and forecast 2025-2030 ($ million)
Data Table on Infotainment - Market size and forecast 2025-2030 ($ million)
Chart on Infotainment - Year-over-year growth 2025-2030 (%)
Data Table on Infotainment - Year-over-year growth 2025-2030 (%)

9.6 Industrial and defense - Market size and forecast 2025-2030

Chart on Industrial and defense - Market size and forecast 2025-2030 ($ million)
Data Table on Industrial and defense - Market size and forecast 2025-2030 ($ million)
Chart on Industrial and defense - Year-over-year growth 2025-2030 (%)
Data Table on Industrial and defense - Year-over-year growth 2025-2030 (%)

9.7 Others - Market size and forecast 2025-2030

Chart on Others - Market size and forecast 2025-2030 ($ million)
Data Table on Others - Market size and forecast 2025-2030 ($ million)
Chart on Others - Year-over-year growth 2025-2030 (%)
Data Table on Others - Year-over-year growth 2025-2030 (%)

9.8 Market opportunity by End-user

Market opportunity by End-user ($ million)
Data Table on Market opportunity by End-user ($ million)

10. Market Segmentation by Technology

10.1 Market segments

Chart on Technology - Market share 2025-2030 (%)
Data Table on Technology - Market share 2025-2030 (%)

10.2 Comparison by Technology

Chart on Comparison by Technology
Data Table on Comparison by Technology

10.3 Bluetooth - Market size and forecast 2025-2030

Chart on Bluetooth - Market size and forecast 2025-2030 ($ million)
Data Table on Bluetooth - Market size and forecast 2025-2030 ($ million)
Chart on Bluetooth - Year-over-year growth 2025-2030 (%)
Data Table on Bluetooth - Year-over-year growth 2025-2030 (%)

10.4 Cellular - Market size and forecast 2025-2030

Chart on Cellular - Market size and forecast 2025-2030 ($ million)
Data Table on Cellular - Market size and forecast 2025-2030 ($ million)
Chart on Cellular - Year-over-year growth 2025-2030 (%)
Data Table on Cellular - Year-over-year growth 2025-2030 (%)

10.5 Wi-Fi - Market size and forecast 2025-2030

Chart on Wi-Fi - Market size and forecast 2025-2030 ($ million)
Data Table on Wi-Fi - Market size and forecast 2025-2030 ($ million)
Chart on Wi-Fi - Year-over-year growth 2025-2030 (%)
Data Table on Wi-Fi - Year-over-year growth 2025-2030 (%)

10.6 NFC - Market size and forecast 2025-2030

Chart on NFC - Market size and forecast 2025-2030 ($ million)
Data Table on NFC - Market size and forecast 2025-2030 ($ million)
Chart on NFC - Year-over-year growth 2025-2030 (%)
Data Table on NFC - Year-over-year growth 2025-2030 (%)

10.7 Ultra-wideband - Market size and forecast 2025-2030

Chart on Ultra-wideband - Market size and forecast 2025-2030 ($ million)
Data Table on Ultra-wideband - Market size and forecast 2025-2030 ($ million)
Chart on Ultra-wideband - Year-over-year growth 2025-2030 (%)
Data Table on Ultra-wideband - Year-over-year growth 2025-2030 (%)

10.8 Market opportunity by Technology

Market opportunity by Technology ($ million)
Data Table on Market opportunity by Technology ($ million)

11. Customer Landscape

11.1 Customer landscape overview

Analysis of price sensitivity, lifecycle, customer purchase basket, adoption rates, and purchase criteria

12. Geographic Landscape

12.1 Geographic segmentation

Chart on Market share by geography 2025-2030 (%)
Data Table on Market share by geography 2025-2030 (%)

12.2 Geographic comparison

Chart on Geographic comparison
Data Table on Geographic comparison

12.3 North America - Market size and forecast 2025-2030

Chart on North America - Market size and forecast 2025-2030 ($ million)
Data Table on North America - Market size and forecast 2025-2030 ($ million)
Chart on North America - Year-over-year growth 2025-2030 (%)
Data Table on North America - Year-over-year growth 2025-2030 (%)
Chart on Regional Comparison - North America
Data Table on Regional Comparison - North America

12.3.1 US - Market size and forecast 2025-2030

Chart on US - Market size and forecast 2025-2030 ($ million)
Data Table on US - Market size and forecast 2025-2030 ($ million)
Chart on US - Year-over-year growth 2025-2030 (%)
Data Table on US - Year-over-year growth 2025-2030 (%)

12.3.2 Canada - Market size and forecast 2025-2030

Chart on Canada - Market size and forecast 2025-2030 ($ million)
Data Table on Canada - Market size and forecast 2025-2030 ($ million)
Chart on Canada - Year-over-year growth 2025-2030 (%)
Data Table on Canada - Year-over-year growth 2025-2030 (%)

12.3.3 Mexico - Market size and forecast 2025-2030

Chart on Mexico - Market size and forecast 2025-2030 ($ million)
Data Table on Mexico - Market size and forecast 2025-2030 ($ million)
Chart on Mexico - Year-over-year growth 2025-2030 (%)
Data Table on Mexico - Year-over-year growth 2025-2030 (%)

12.4 APAC - Market size and forecast 2025-2030

Chart on APAC - Market size and forecast 2025-2030 ($ million)
Data Table on APAC - Market size and forecast 2025-2030 ($ million)
Chart on APAC - Year-over-year growth 2025-2030 (%)
Data Table on APAC - Year-over-year growth 2025-2030 (%)
Chart on Regional Comparison - APAC
Data Table on Regional Comparison - APAC

12.4.1 China - Market size and forecast 2025-2030

Chart on China - Market size and forecast 2025-2030 ($ million)
Data Table on China - Market size and forecast 2025-2030 ($ million)
Chart on China - Year-over-year growth 2025-2030 (%)
Data Table on China - Year-over-year growth 2025-2030 (%)

12.4.2 Japan - Market size and forecast 2025-2030

Chart on Japan - Market size and forecast 2025-2030 ($ million)
Data Table on Japan - Market size and forecast 2025-2030 ($ million)
Chart on Japan - Year-over-year growth 2025-2030 (%)
Data Table on Japan - Year-over-year growth 2025-2030 (%)

12.4.3 India - Market size and forecast 2025-2030

Chart on India - Market size and forecast 2025-2030 ($ million)
Data Table on India - Market size and forecast 2025-2030 ($ million)
Chart on India - Year-over-year growth 2025-2030 (%)
Data Table on India - Year-over-year growth 2025-2030 (%)

12.4.4 South Korea - Market size and forecast 2025-2030

Chart on South Korea - Market size and forecast 2025-2030 ($ million)
Data Table on South Korea - Market size and forecast 2025-2030 ($ million)
Chart on South Korea - Year-over-year growth 2025-2030 (%)
Data Table on South Korea - Year-over-year growth 2025-2030 (%)

12.4.5 Australia - Market size and forecast 2025-2030

Chart on Australia - Market size and forecast 2025-2030 ($ million)
Data Table on Australia - Market size and forecast 2025-2030 ($ million)
Chart on Australia - Year-over-year growth 2025-2030 (%)
Data Table on Australia - Year-over-year growth 2025-2030 (%)

12.4.6 Indonesia - Market size and forecast 2025-2030

Chart on Indonesia - Market size and forecast 2025-2030 ($ million)
Data Table on Indonesia - Market size and forecast 2025-2030 ($ million)
Chart on Indonesia - Year-over-year growth 2025-2030 (%)
Data Table on Indonesia - Year-over-year growth 2025-2030 (%)

12.5 Europe - Market size and forecast 2025-2030

Chart on Europe - Market size and forecast 2025-2030 ($ million)
Data Table on Europe - Market size and forecast 2025-2030 ($ million)
Chart on Europe - Year-over-year growth 2025-2030 (%)
Data Table on Europe - Year-over-year growth 2025-2030 (%)
Chart on Regional Comparison - Europe
Data Table on Regional Comparison - Europe

12.5.1 Germany - Market size and forecast 2025-2030

Chart on Germany - Market size and forecast 2025-2030 ($ million)
Data Table on Germany - Market size and forecast 2025-2030 ($ million)
Chart on Germany - Year-over-year growth 2025-2030 (%)
Data Table on Germany - Year-over-year growth 2025-2030 (%)

12.5.2 UK - Market size and forecast 2025-2030

Chart on UK - Market size and forecast 2025-2030 ($ million)
Data Table on UK - Market size and forecast 2025-2030 ($ million)
Chart on UK - Year-over-year growth 2025-2030 (%)
Data Table on UK - Year-over-year growth 2025-2030 (%)

12.5.3 France - Market size and forecast 2025-2030

Chart on France - Market size and forecast 2025-2030 ($ million)
Data Table on France - Market size and forecast 2025-2030 ($ million)
Chart on France - Year-over-year growth 2025-2030 (%)
Data Table on France - Year-over-year growth 2025-2030 (%)

12.5.4 Italy - Market size and forecast 2025-2030

Chart on Italy - Market size and forecast 2025-2030 ($ million)
Data Table on Italy - Market size and forecast 2025-2030 ($ million)
Chart on Italy - Year-over-year growth 2025-2030 (%)
Data Table on Italy - Year-over-year growth 2025-2030 (%)

12.5.5 Spain - Market size and forecast 2025-2030

Chart on Spain - Market size and forecast 2025-2030 ($ million)
Data Table on Spain - Market size and forecast 2025-2030 ($ million)
Chart on Spain - Year-over-year growth 2025-2030 (%)
Data Table on Spain - Year-over-year growth 2025-2030 (%)

12.5.6 The Netherlands - Market size and forecast 2025-2030

Chart on The Netherlands - Market size and forecast 2025-2030 ($ million)
Data Table on The Netherlands - Market size and forecast 2025-2030 ($ million)
Chart on The Netherlands - Year-over-year growth 2025-2030 (%)
Data Table on The Netherlands - Year-over-year growth 2025-2030 (%)

12.6 South America - Market size and forecast 2025-2030

Chart on South America - Market size and forecast 2025-2030 ($ million)
Data Table on South America - Market size and forecast 2025-2030 ($ million)
Chart on South America - Year-over-year growth 2025-2030 (%)
Data Table on South America - Year-over-year growth 2025-2030 (%)
Chart on Regional Comparison - South America
Data Table on Regional Comparison - South America

12.6.1 Brazil - Market size and forecast 2025-2030

Chart on Brazil - Market size and forecast 2025-2030 ($ million)
Data Table on Brazil - Market size and forecast 2025-2030 ($ million)
Chart on Brazil - Year-over-year growth 2025-2030 (%)
Data Table on Brazil - Year-over-year growth 2025-2030 (%)

12.6.2 Argentina - Market size and forecast 2025-2030

Chart on Argentina - Market size and forecast 2025-2030 ($ million)
Data Table on Argentina - Market size and forecast 2025-2030 ($ million)
Chart on Argentina - Year-over-year growth 2025-2030 (%)
Data Table on Argentina - Year-over-year growth 2025-2030 (%)

12.6.3 Chile - Market size and forecast 2025-2030

Chart on Chile - Market size and forecast 2025-2030 ($ million)
Data Table on Chile - Market size and forecast 2025-2030 ($ million)
Chart on Chile - Year-over-year growth 2025-2030 (%)
Data Table on Chile - Year-over-year growth 2025-2030 (%)

12.7 Middle East and Africa - Market size and forecast 2025-2030

Chart on Middle East and Africa - Market size and forecast 2025-2030 ($ million)
Data Table on Middle East and Africa - Market size and forecast 2025-2030 ($ million)
Chart on Middle East and Africa - Year-over-year growth 2025-2030 (%)
Data Table on Middle East and Africa - Year-over-year growth 2025-2030 (%)
Chart on Regional Comparison - Middle East and Africa
Data Table on Regional Comparison - Middle East and Africa

12.7.1 Saudi Arabia - Market size and forecast 2025-2030

Chart on Saudi Arabia - Market size and forecast 2025-2030 ($ million)
Data Table on Saudi Arabia - Market size and forecast 2025-2030 ($ million)
Chart on Saudi Arabia - Year-over-year growth 2025-2030 (%)
Data Table on Saudi Arabia - Year-over-year growth 2025-2030 (%)

12.7.2 UAE - Market size and forecast 2025-2030

Chart on UAE - Market size and forecast 2025-2030 ($ million)
Data Table on UAE - Market size and forecast 2025-2030 ($ million)
Chart on UAE - Year-over-year growth 2025-2030 (%)
Data Table on UAE - Year-over-year growth 2025-2030 (%)

12.7.3 South Africa - Market size and forecast 2025-2030

Chart on South Africa - Market size and forecast 2025-2030 ($ million)
Data Table on South Africa - Market size and forecast 2025-2030 ($ million)
Chart on South Africa - Year-over-year growth 2025-2030 (%)
Data Table on South Africa - Year-over-year growth 2025-2030 (%)

12.7.4 Israel - Market size and forecast 2025-2030

Chart on Israel - Market size and forecast 2025-2030 ($ million)
Data Table on Israel - Market size and forecast 2025-2030 ($ million)
Chart on Israel - Year-over-year growth 2025-2030 (%)
Data Table on Israel - Year-over-year growth 2025-2030 (%)

12.7.5 Turkey - Market size and forecast 2025-2030

Chart on Turkey - Market size and forecast 2025-2030 ($ million)
Data Table on Turkey - Market size and forecast 2025-2030 ($ million)
Chart on Turkey - Year-over-year growth 2025-2030 (%)
Data Table on Turkey - Year-over-year growth 2025-2030 (%)

12.8 Market opportunity by geography

Market opportunity by geography ($ million)
Data Tables on Market opportunity by geography ($ million)

13. Drivers, Challenges, and Opportunity

13.1 Market drivers

Advancing integration of wearable technologies across enterprise environments
Growing consumer focus on personal health management
Expanding demand for immersive and connected digital lifestyles

13.2 Market challenges

Data privacy and cybersecurity concerns
Device interoperability and ecosystem fragmentation
Battery performance and hardware limitations

13.3 Impact of drivers and challenges

Impact of drivers and challenges in 2025 and 2030

13.4 Market opportunities

Advancing incorporation of AI-enabled personalized insights
Evolving shift toward multi-function wearable platforms
Expanding movement toward premiumization and advanced design differentiation

14. Competitive Landscape

14.1 Overview

14.2

Overview on criticality of inputs and factors of differentiation

14.3 Landscape disruption

Overview on factors of disruption

14.4 Industry risks

Impact of key risks on business

15. Competitive Analysis

15.1 Companies profiled

Companies covered

15.2 Company ranking index

15.3 Market positioning of companies

Matrix on companies position and classification

15.4 Apple Inc.

Apple Inc. - Overview
Apple Inc. - Business segments
Apple Inc. - Key news
Apple Inc. - Key offerings
Apple Inc. - Segment focus
SWOT

15.5 ByteDance Ltd.

ByteDance Ltd. - Overview
ByteDance Ltd. - Product / Service
ByteDance Ltd. - Key offerings
SWOT

15.6 Garmin Ltd.

Garmin Ltd. - Overview
Garmin Ltd. - Business segments
Garmin Ltd. - Key news
Garmin Ltd. - Key offerings
Garmin Ltd. - Segment focus
SWOT

15.7 Google LLC

Google LLC - Overview
Google LLC - Product / Service
Google LLC - Key news
Google LLC - Key offerings
SWOT

15.8 Huawei Technologies Co. Ltd.

Huawei Technologies Co. Ltd. - Overview
Huawei Technologies Co. Ltd. - Product / Service
Huawei Technologies Co. Ltd. - Key offerings
SWOT

15.9 Magic Leap Inc.

Magic Leap Inc. - Overview
Magic Leap Inc. - Product / Service
Magic Leap Inc. - Key offerings
SWOT

15.10 Meta Platforms Inc.

Meta Platforms Inc. - Overview
Meta Platforms Inc. - Business segments
Meta Platforms Inc. - Key offerings
Meta Platforms Inc. - Segment focus
SWOT

15.11 Oura Health Oy

Oura Health Oy - Overview
Oura Health Oy - Product / Service
Oura Health Oy - Key offerings
SWOT

15.12 Polar Electro Oy

Polar Electro Oy - Overview
Polar Electro Oy - Product / Service
Polar Electro Oy - Key offerings
SWOT

15.13 Rokid Corp. Ltd.

Rokid Corp. Ltd. - Overview
Rokid Corp. Ltd. - Product / Service
Rokid Corp. Ltd. - Key offerings
SWOT

15.14 Samsung Electronics Co. Ltd.

Samsung Electronics Co. Ltd. - Overview
Samsung Electronics Co. Ltd. - Business segments
Samsung Electronics Co. Ltd. - Key news
Samsung Electronics Co. Ltd. - Key offerings
Samsung Electronics Co. Ltd. - Segment focus
SWOT

15.15 Snap Inc.

Snap Inc. - Overview
Snap Inc. - Product / Service
Snap Inc. - Key offerings
SWOT

15.16 Sony Group Corp.

Sony Group Corp. - Overview
Sony Group Corp. - Business segments
Sony Group Corp. - Key news
Sony Group Corp. - Key offerings
Sony Group Corp. - Segment focus
SWOT

15.17 Suunto Oy

Suunto Oy - Overview
Suunto Oy - Product / Service
Suunto Oy - Key offerings
SWOT

15.18 Xiaomi Corp.

Xiaomi Corp. - Overview
Xiaomi Corp. - Business segments
Xiaomi Corp. - Key offerings
Xiaomi Corp. - Segment focus
SWOT

16. Appendix

16.1 Scope of the report

Market definition
Objectives
Notes and caveats

16.2 Inclusions and exclusions checklist

Inclusions checklist
Exclusions checklist

16.3 Currency conversion rates for US$

16.4 Research methodology

16.5 Data procurement

Information sources

16.6 Data validation

16.7 Validation techniques employed for market sizing

16.8 Data synthesis

16.9 360 degree market analysis

16.10 List of abbreviations

Research Methodology

Technavio presents a detailed picture of the market by way of study, synthesis, and summation of data from multiple sources. The analysts have presented the various facets of the market with a particular focus on identifying the key industry influencers. The data thus presented is comprehensive, reliable, and the result of extensive research, both primary and secondary.

INFORMATION SOURCES

Primary sources

  • Manufacturers and suppliers
  • Channel partners
  • Industry experts
  • Strategic decision makers

Secondary sources

  • Industry journals and periodicals
  • Government data
  • Financial reports of key industry players
  • Historical data
  • Press releases

DATA ANALYSIS

Data Synthesis

  • Collation of data
  • Estimation of key figures
  • Analysis of derived insights

Data Validation

  • Triangulation with data models
  • Reference against proprietary databases
  • Corroboration with industry experts

REPORT WRITING

Qualitative

  • Market drivers
  • Market challenges
  • Market trends
  • Five forces analysis

Quantitative

  • Market size and forecast
  • Market segmentation
  • Geographical insights
  • Competitive landscape

Interested in this report?

Get your sample now to see our research methodology and insights!

Download Now

Frequently Asked Questions

Wearable Computing Devices market growth will increase by USD 60928.8 million during 2026-2030.

The Wearable Computing Devices market is expected to grow at a CAGR of 15.1% during 2026-2030.

Wearable Computing Devices market is segmented by Product (Smart watches, Fitness trackers, Smart glasses, Head mounted displays, Others) End-user (Fitness and wellness, Medical and healthcare, Infotainment, Industrial and defense, Others) Technology (Bluetooth, Cellular, Wi-Fi, NFC, Ultra-wideband)

Apple Inc., ByteDance Ltd., COROS Wearables Inc., Garmin Ltd., Google LLC, Huawei Technologies Co. Ltd., Magic Leap Inc., Meta Platforms Inc., Oura Health Oy, Polar Electro Oy, Rokid Corp. Ltd., Samsung Electronics Co. Ltd., Snap Inc., Sony Group Corp., Suunto Oy, Ultrahuman Healthcare Pvt. Ltd., Vuzix Corp., WHOOP Inc., Withings SA, Xiaomi Corp., XREAL, Zebra Technologies Corp., Zepp Health Corp. are a few of the key vendors in the Wearable Computing Devices market.

North America will register the highest growth rate of 34.8% among the other regions. Therefore, the Wearable Computing Devices market in North America is expected to garner significant business opportunities for the vendors during the forecast period.

US, Canada, Mexico, China, Japan, India, South Korea, Australia, Indonesia, Germany, UK, France, Italy, Spain, The Netherlands, Brazil, Argentina, Chile, Saudi Arabia, UAE, South Africa, Israel, Turkey

  • Advancing integration of wearable technologies across enterprise environments is the driving factor this market.

The Wearable Computing Devices market vendors should focus on grabbing business opportunities from the Product segment as it accounted for the largest market share in the base year.
RIA - Research AI Assistant
Ask RIA
