
Web Real Time Communication (WebRTC) Market Size 2025-2029
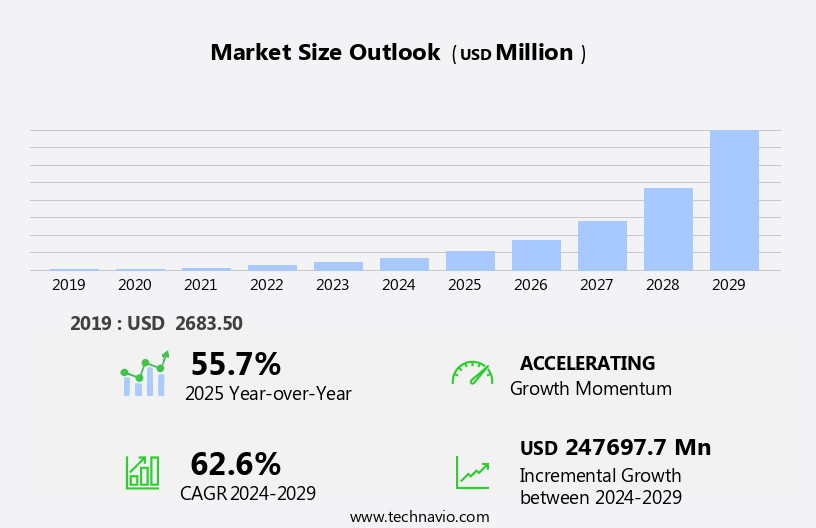
The web real time communication (WebRTC) market size is forecast to increase by USD 247.7 billion, at a CAGR of 62.6% between 2024 and 2029.
- The market is experiencing significant growth, driven by the increasing demand for easy-to-use real-time communication solutions. This trend is further fueled by the integration of WebRTC with internet of things (IoT) sensors, enabling seamless communication between devices and users. However, the market faces challenges, primarily the lack of high-end video conferencing features, which may hinder its adoption in corporate environments. Companies seeking to capitalize on this market's opportunities should focus on enhancing the user experience and addressing the need for advanced video conferencing features.
- By doing so, they can effectively navigate the competitive landscape and establish a strong presence in the rapidly evolving WebRTC market.
What will be the Size of the Web Real Time Communication (WebRTC) Market during the forecast period?
Explore in-depth regional segment analysis with market size data - historical 2019-2023 and forecasts 2025-2029 - in the full report.
Request Free Sample
The Web Real-Time Communication (WebRTC) market continues to evolve, with dynamic applications across various sectors. Real-time video streaming, online gaming, and distance learning are key areas where WebRTC shines. Packet loss concealment, video conferencing, and WebRTC gateways ensure seamless communication. Adaptive bitrate streaming and interoperability testing maintain quality and compatibility. Signaling protocols and media negotiation facilitate session establishment. Jitter buffer and error correction optimize performance. Noise suppression and echo cancellation enhance audio processing. WebRTC SDKs and APIs simplify integration. Browser compatibility and live streaming expand reach.
Interactive broadcasting and peer-to-peer communication foster engagement. Network congestion control and session management ensure reliability. Media codecs and chat applications enrich user experience. WebRTC's continuous evolution includes advancements in signaling servers, performance benchmarking, and firewall traversal. The market's unfolding patterns reflect the ongoing integration of these features into innovative applications.
How is this Web Real Time Communication (WebRTC) Industry segmented?
The web real time communication (WebRTC) industry research report provides comprehensive data (region-wise segment analysis), with forecasts and estimates in "USD million" for the period 2025-2029, as well as historical data from 2019-2023 for the following segments.
- Application
- Video
- Voice
- Data sharing
- Platform
- Mobile
- Browser
- UC
- End-User
- Retail
- BFSI
- IT & Telecom
- Media & Entertainment
- Third-Party Logistics (3PL)
- Retail
- BFSI
- IT & Telecom
- Media & Entertainment
- Third-Party Logistics (3PL)
- Geography
- North America
- US
- Canada
- Europe
- France
- Germany
- Italy
- UK
- APAC
- China
- India
- Japan
- South America
- Brazil
- Rest of World (ROW)
- North America
By Application Insights
The video segment is estimated to witness significant growth during the forecast period.
Web Real Time Communication (WebRTC) technology is revolutionizing business communication by enabling real-time, high-quality video streaming and conferencing directly through web and mobile applications. This innovative solution eliminates the need for additional software or plugins, providing a seamless user experience. The technology's reliability is ensured through features like jitter buffer, packet loss concealment, and error correction. WebRTC's versatility extends beyond video conferencing. It's used extensively in online gaming, distance learning, and interactive broadcasting, offering a more immersive and harmonious communication experience. The technology's media negotiation capabilities allow for adaptive bitrate streaming, ensuring optimal performance even in network congestion.
WebRTC's interoperability is crucial, as it allows for peer-to-peer communication and firewall traversal, making it a preferred choice for remote collaboration and real-time chat applications. Signaling protocols facilitate session establishment and management, while media codecs support various audio and video formats. WebRTC's SDKs and APIs, such as getUserMedia, RTCPeerConnection, and RTCDataChannel, are built into modern browsers, making implementation easy and efficient. WebRTC gateways further enhance its functionality by enabling interoperability between WebRTC and non-WebRTC endpoints. Performance benchmarking and network congestion control are essential for maintaining a high-quality user experience. WebRTC solutions address these challenges through advanced techniques like echo cancellation and noise suppression.
Overall, WebRTC's market dynamics continue to evolve, offering businesses a robust, immersive, and harmonious communication solution.
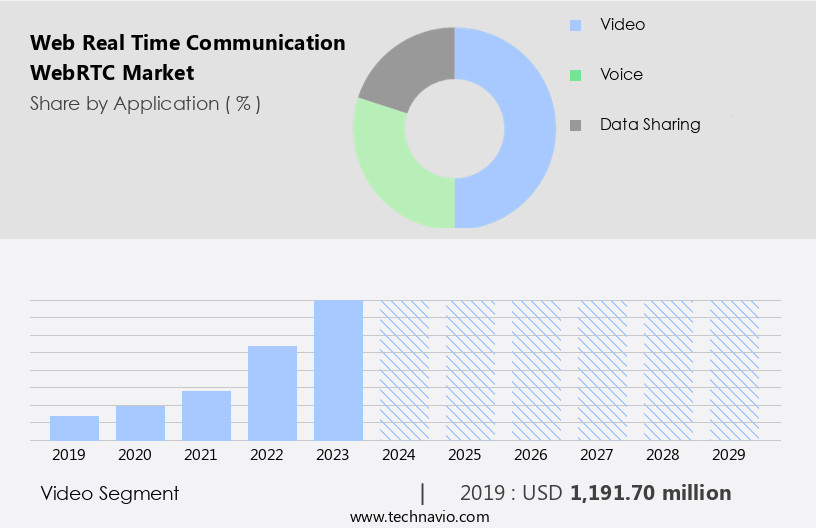
The Video segment was valued at USD 1.19 billion in 2019 and showed a gradual increase during the forecast period.
Regional Analysis
North America is estimated to contribute 36% to the growth of the global market during the forecast period. Technavio's analysts have elaborately explained the regional trends and drivers that shape the market during the forecast period.
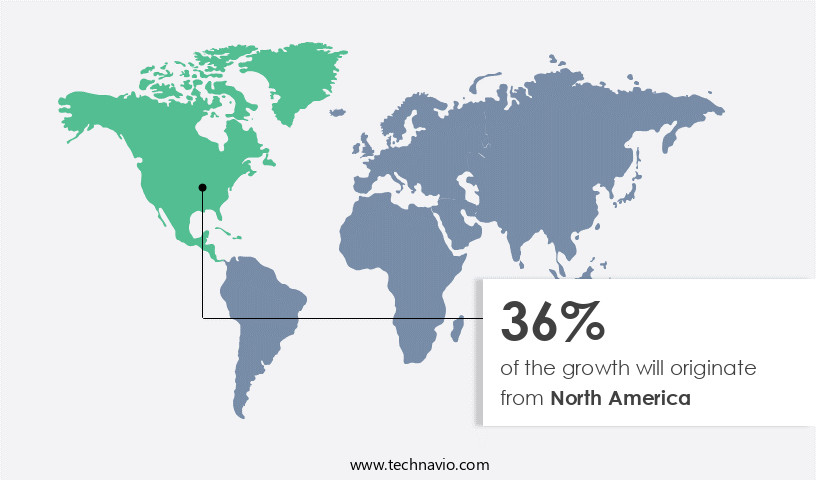
In the dynamic business landscape of North America, countries like the US and Canada lead the way in adopting the latest communication technologies. With the widespread availability of high-bandwidth Internet connections, real-time video streaming and online gaming have gained significant traction among individuals and businesses. Small and medium-sized organizations are increasingly focusing on digitalization and product promotion through conferencing solutions. Web Real Time Communication (WebRTC) has emerged as a preferred choice for developing affordable and platform-independent applications. WebRTC's advanced features, such as signaling protocols, media negotiation, and adaptive bitrate streaming, have been instrumental in enhancing the user experience.
Jitter buffer, packet loss concealment, and noise suppression ensure seamless communication even in less-than-ideal network conditions. WebRTC Software Development Kits (SDKs) and Application Programming Interfaces (APIs) facilitate easy integration into existing systems. The technology's interoperability and browser compatibility enable real-time collaboration and interactive broadcasting, making it an essential tool for businesses and industries like distance learning, chat applications, and audio processing. Firewall traversal and peer-to-peer communication further expand its reach and applicability. Major tech giants have recognized the potential of WebRTC and are collaborating to exploit its capabilities. The technology's adoption is not limited to large enterprises; small and medium-sized businesses across the Americas are increasingly adopting WebRTC for their communication needs.
Performance benchmarking, network congestion control, and session management ensure reliable and efficient communication. WebRTC's role in revolutionizing communication is undeniable, and its influence is felt across various industries and applications, from video conferencing and remote collaboration to live streaming and interactive broadcasting.
Market Dynamics
Our researchers analyzed the data with 2024 as the base year, along with the key drivers, trends, and challenges. A holistic analysis of drivers will help companies refine their marketing strategies to gain a competitive advantage.
The web real-time communication (WebRTC) market is a dynamic and innovative sector, driven by the growing demand for real-time, interactive, and immersive digital experiences. This market encompasses cutting-edge technologies like peer-to-peer (P2P) communication, signaling servers, and real-time transport protocols. WebRTC solutions enable seamless video conferencing, live streaming, and interactive gaming, transforming industries from healthcare and education to finance and entertainment. Real-time analytics, encryption, and interoperability are key features, ensuring secure and reliable communication. The WebRTC ecosystem is constantly evolving, fueled by collaborative innovation among developers, businesses, and research institutions.
What are the key market drivers leading to the rise in the adoption of Web Real Time Communication (WebRTC) Industry?
- The increasing demand for user-friendly Real-Time Communication (RTC) solutions serves as the primary market driver.
- Web Real Time Communication (WebRTC) is a technology that enables real-time, browser-based communications, such as video streaming, without the need for downloads or plugins. WebRTC companies provide software development kits (SDKs) and application programming interfaces (APIs) to help clients integrate this technology into their websites or applications. The market for WebRTC is experiencing significant growth due to the increasing demand for real-time, immersive, and harmonious communication experiences. Beyond video conferencing, consumers seek fast, easy, secure, and instantaneous online engagement capabilities, including voice conferencing and social networking. The proliferation of WebRTC apps in social media has made users more comfortable with using video chats on browsers or mobile devices.
- WebRTC's signaling protocols and media negotiation capabilities enable seamless communication between users, even when network conditions change. Additionally, jitter buffers help maintain the quality of real-time video streaming, ensuring a smooth user experience. Overall, the market for WebRTC is poised for continued growth as businesses and consumers demand more efficient, engaging, and interactive communication solutions.
What are the market trends shaping the Web Real Time Communication (WebRTC) Industry?
- The convergence of Web Real-Time Communication (WebRTC) technology and Internet of Things (IoT) sensors represents a significant market trend. WebRTC enables real-time, peer-to-peer communication between devices, while IoT sensors provide real-time data collection and analysis. Together, these technologies offer innovative solutions for remote monitoring, automation, and real-time collaboration in various industries.
- Web Real Time Communication (WebRTC) is revolutionizing the way businesses conduct real-time data transfer and multimedia communications through browsers. Beyond text, voice, and video chats, WebRTC applications utilize data from Internet of Things (IoT) sensors for enhanced functionalities. These sensors, including remote cameras and microphones, transmit data over peer-to-peer WebRTC data channel connections for augmented videos or audio. For instance, a motion detector can trigger a camera to take a picture or start live viewing, while temperature sensors can send alerts over the web sockets. To ensure seamless communication, WebRTC solutions employ techniques like packet loss concealment, adaptive bitrate streaming, and error correction.
- Interoperability testing and browser compatibility are crucial aspects of WebRTC implementation to maintain seamless communication between different platforms. Live streaming applications also benefit from WebRTC technology, enabling real-time data transfer and multimedia delivery. Overall, WebRTC's capabilities extend beyond traditional communication methods, offering businesses a more immersive and harmonious communication experience.
What challenges does the Web Real Time Communication (WebRTC) Industry face during its growth?
- The absence of advanced video conferencing capabilities poses a significant obstacle to industry expansion.
- Web Real Time Communication (WebRTC) technology enables real-time, open-source communication through various devices and networks. However, this technology is still evolving and faces challenges such as CPU overload during video and audio encoding and decoding. The increasing number of internet-supported devices and the high-definition multimedia files exacerbate these issues. In cellular phones, the CPU stress caused by multiple applications results in battery drain. To address these challenges, WebRTC employs techniques like noise suppression, signaling servers for session establishment, and performance benchmarking for network congestion control.
- Media codecs and chat applications also contribute to improving the user experience. Despite these challenges, WebRTC's potential applications, such as distance learning, make it an essential technology for businesses.
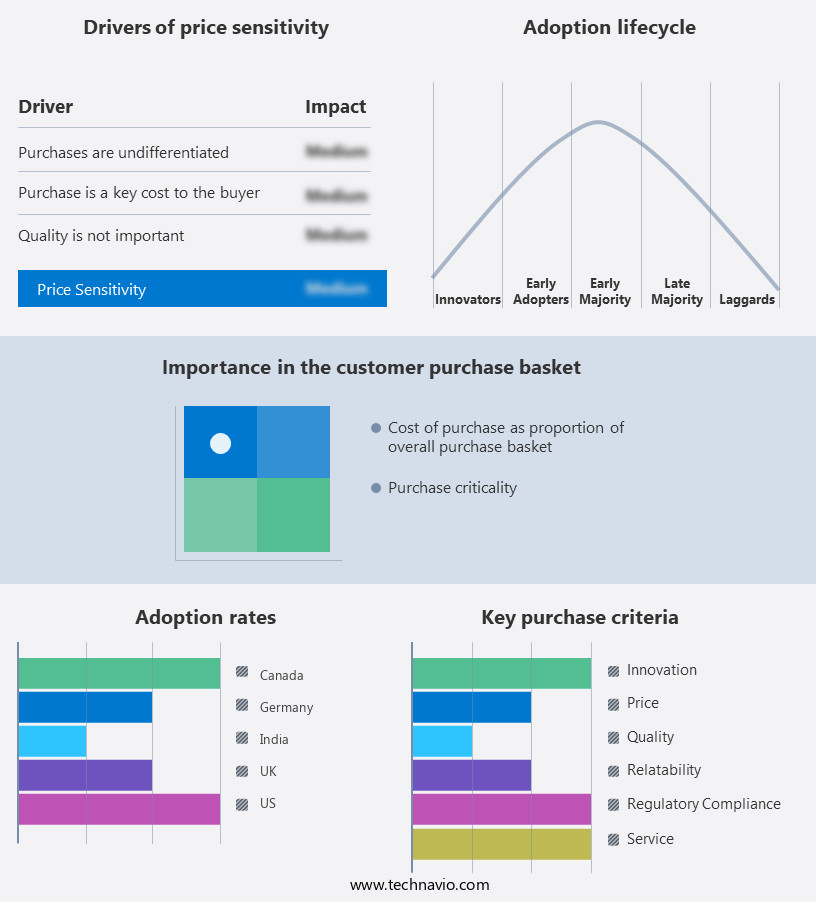
Exclusive Customer Landscape
The web real time communication (WebRTC) market forecasting report includes the adoption lifecycle of the market, covering from the innovator's stage to the laggard's stage. It focuses on adoption rates in different regions based on penetration. Furthermore, the web real time communication (WebRTC) market report also includes key purchase criteria and drivers of price sensitivity to help companies evaluate and develop their market growth analysis strategies.
Customer Landscape
Key Companies & Market Insights
Companies are implementing various strategies, such as strategic alliances, web real time communication (WebRTC) market forecast, partnerships, mergers and acquisitions, geographical expansion, and product/service launches, to enhance their presence in the industry.
AT&T Inc. - The company specializes in providing advanced web real-time communication solutions, including the ALE Rainbow platform.
The industry research and growth report includes detailed analyses of the competitive landscape of the market and information about key companies, including:
- AT&T Inc.
- Avaya LLC
- Cisco Systems Inc.
- Dialogic Corporation
- Oracle
- Plivo Inc.
- Poly (HP Development Company, L.P.)
- Quobis
- Ribbon Communications Operating Company Inc.
- Sangoma
- Twilio Inc.
- Vonage
Qualitative and quantitative analysis of companies has been conducted to help clients understand the wider business environment as well as the strengths and weaknesses of key industry players. Data is qualitatively analyzed to categorize companies as pure play, category-focused, industry-focused, and diversified; it is quantitatively analyzed to categorize companies as dominant, leading, strong, tentative, and weak.
Recent Development and News in Web Real Time Communication (WebRTC) Market
- In January 2024, Google announced the release of Chrome 91, which included improved WebRTC support for enhanced audio and video quality, as per their official blog post. This update aimed to boost the user experience for real-time communication applications.
- In March 2024, Microsoft Teams, a leading communication platform, integrated WebRTC technology, enabling peer-to-peer video conferencing directly from web browsers without the need for downloading additional software, as reported by TechCrunch.
- In April 2025, Twilio, a cloud communications platform, raised USD 200 million in a Series G funding round, as per their SEC filing. The funds were earmarked for expanding their product offerings, including WebRTC services, to meet the growing demand for real-time communication solutions.
- In May 2025, Amazon Chime, a communication service, added support for WebRTC-based video conferencing, allowing users to join meetings directly from their web browsers, as per Amazon's press release. This expansion aimed to cater to the increasing number of users preferring browser-based communication tools.
Research Analyst Overview
- The Web Real-Time Communication (WebRTC) market is experiencing dynamic growth, driven by the increasing demand for real-time, high-quality communication solutions. The WebRTC developer community continues to expand, fueling the creation of innovative use cases across various industries. WebRTC deployment and maintenance are crucial aspects, with testing tools, performance tuning, and troubleshooting playing essential roles in ensuring seamless user experiences. Analytics and monitoring are vital for optimizing WebRTC applications, particularly in mobile environments. Best practices and upgrades are crucial for maintaining regulatory compliance and achieving low-latency streaming. Scalability solutions and interoperability are key focus areas for cloud-based WebRTC platforms, while open-source WebRTC and documentation support the development of commercial solutions.
- Security protocols and frameworks are essential for integrating WebRTC into businesses, with training and standardization crucial for ensuring successful implementation. WebRTC libraries and compliance are essential for creating robust, interoperable, and efficient communication systems. Regardless of the specific challenges, the WebRTC ecosystem offers a wealth of resources and solutions to help businesses thrive in the digital age.
Dive into Technavio's robust research methodology, blending expert interviews, extensive data synthesis, and validated models for unparalleled Web Real Time Communication (WebRTC) Market insights. See full methodology.
|
Market Scope |
|
|
Report Coverage |
Details |
|
Page number |
204 |
|
Base year |
2024 |
|
Historic period |
2019-2023 |
|
Forecast period |
2025-2029 |
|
Growth momentum & CAGR |
Accelerate at a CAGR of 62.6% |
|
Market growth 2025-2029 |
USD 247697.7 million |
|
Market structure |
Fragmented |
|
YoY growth 2024-2025(%) |
55.7 |
|
Key countries |
US, UK, India, Canada, Germany, France, China, Japan, Brazil, and Italy |
|
Competitive landscape |
Leading Companies, Market Positioning of Companies, Competitive Strategies, and Industry Risks |
What are the Key Data Covered in this Web Real Time Communication (WebRTC) Market Research and Growth Report?
- CAGR of the Web Real Time Communication (WebRTC) industry during the forecast period
- Detailed information on factors that will drive the growth and forecasting between 2025 and 2029
- Precise estimation of the size of the market and its contribution of the industry in focus to the parent market
- Accurate predictions about upcoming growth and trends and changes in consumer behaviour
- Growth of the market across North America, Europe, APAC, South America, and Middle East and Africa
- Thorough analysis of the market's competitive landscape and detailed information about companies
- Comprehensive analysis of factors that will challenge the web real time communication (WebRTC) market growth of industry companies
We can help! Our analysts can customize this web real time communication (WebRTC) market research report to meet your requirements.