
Western Europe Data Center Colocation Market Size 2025-2029
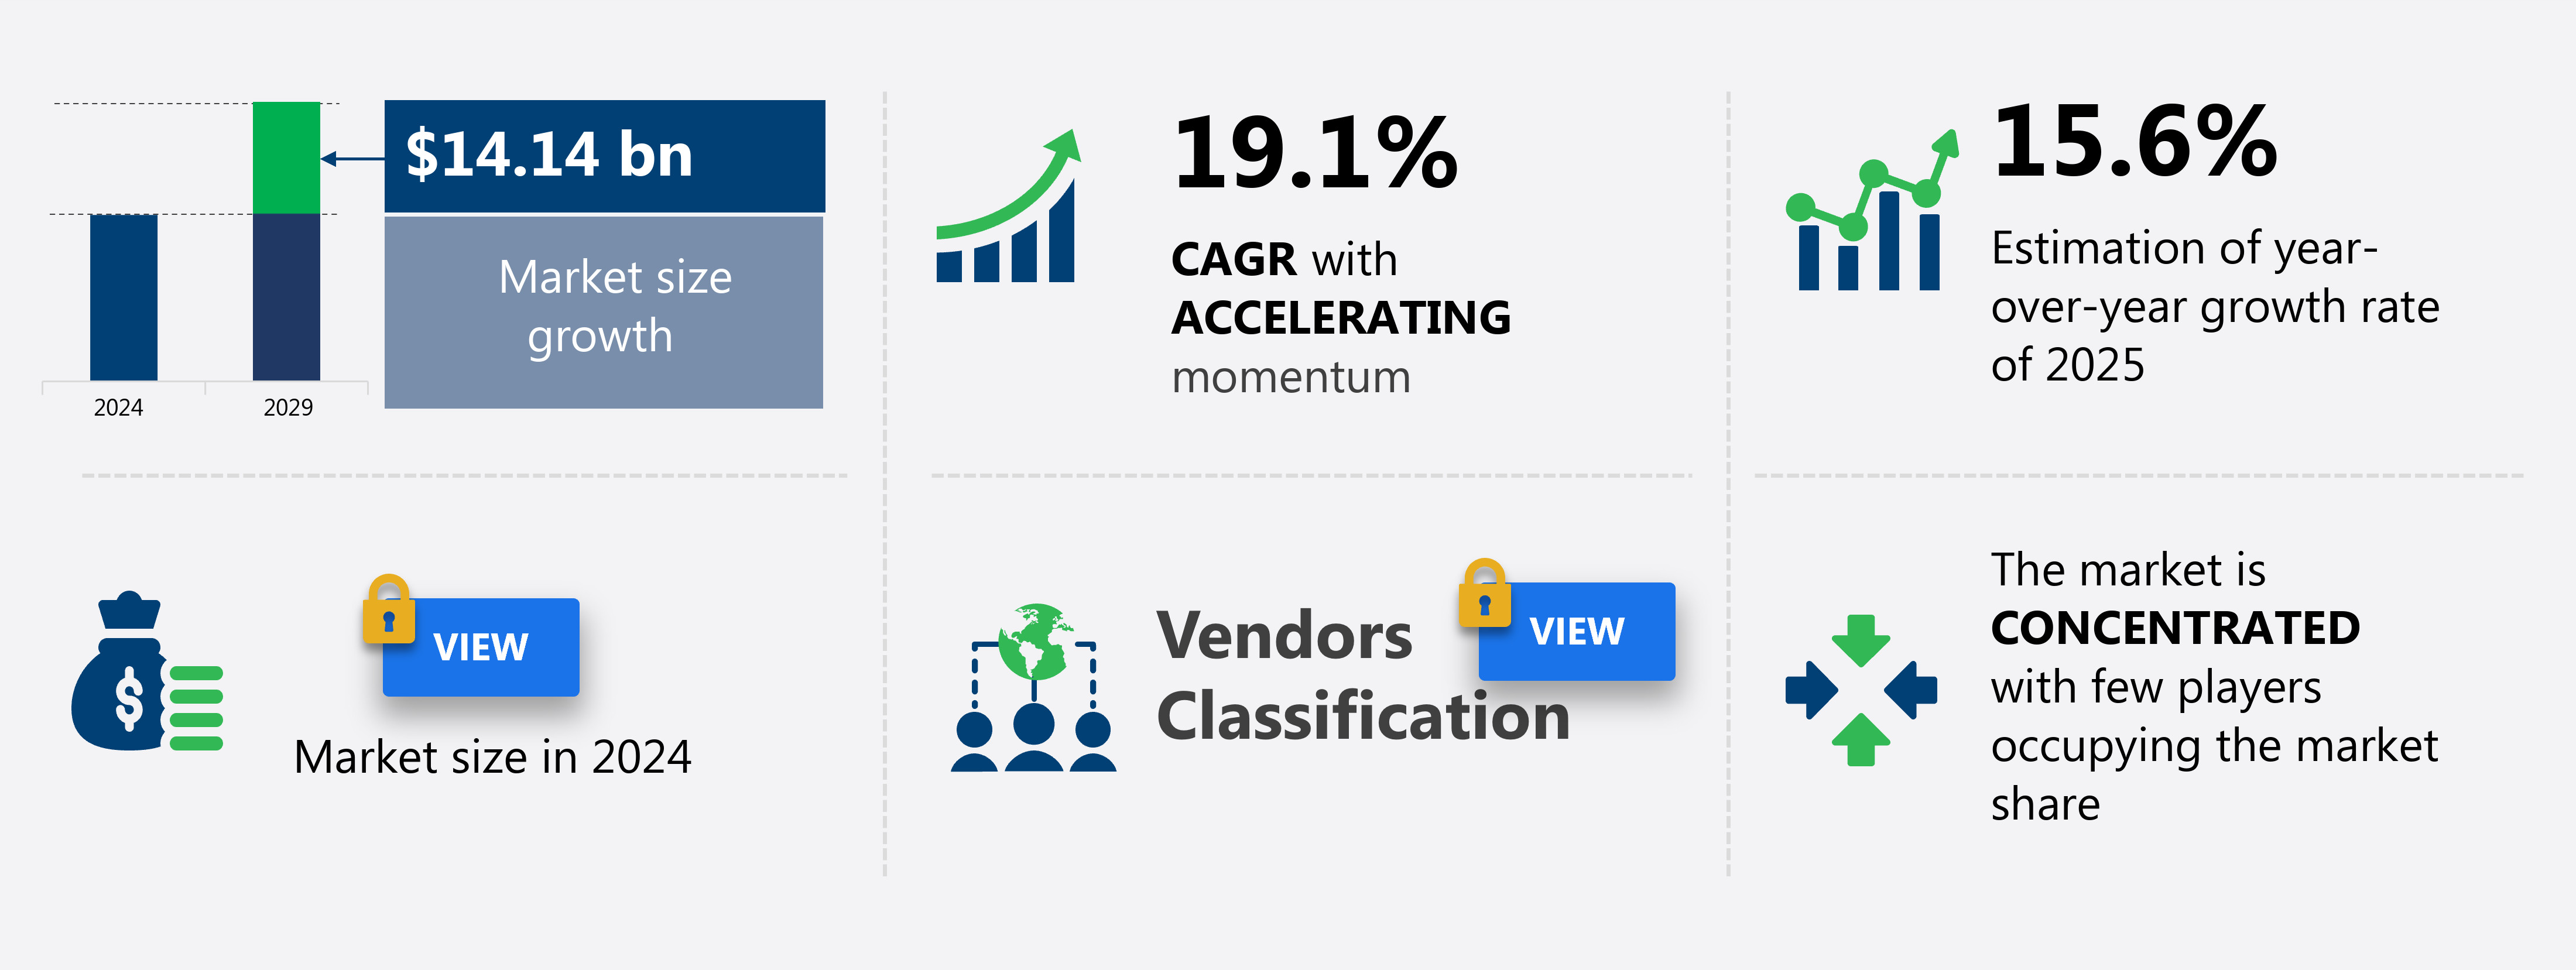
The Western Europe data center colocation market size is forecast to increase by USD 14.14 billion, at a CAGR of 19.1% between 2024 and 2029.
- The market is experiencing significant growth due to the increasing demand for reliable and efficient data center solutions. Key trends in the market include innovative approaches such as the development of submarine data centers, which offer enhanced connectivity and disaster recovery capabilities. Additionally, there is a focus on data center consolidation, as businesses look to reduce costs and improve operational efficiency. These trends are driving the growth of the market, making it an attractive investment opportunity for businesses in need of secure and scalable data center solutions. Furthermore, the use of advanced technologies like artificial intelligence and machine learning is expected to further boost market growth, as these technologies require large amounts of data processing power and storage capacity. Overall, the market is poised for continued growth, offering numerous opportunities for businesses seeking to optimize their IT infrastructure and improve their digital capabilities.
What will be the Size of the market During the Forecast Period?
- The market continues to experience strong growth, driven by the increasing demand for secure and reliable infrastructure to support the expanding digital economy. With the proliferation of cloud platforms like Microsoft Azure and the growing importance of data protection regulations such as GDPR, data centers have become essential infrastructure for businesses seeking to manage their data and comply with evolving data protection requirements. This trend is particularly pronounced In the Nordic region, where economic growth and the adoption of artificial intelligence and automation technologies are driving data generation and the need for advanced colocation solutions.
- The market is expected to reach significant colocation revenue figures, as businesses continue to prioritize Opex-friendly infrastructure solutions and seek to optimize their IT operations. The market is characterized by a diverse range of players, from established providers like Equinix and Interxion to emerging players in the Nordics, such as Data4 and others. The market is also witnessing the integration of advanced technologies like AI and pattern recognition into colocation offerings, as part of national AI strategies and the broader tech markets' evolution.
How is this market segmented and which is the largest segment?
The market research report provides comprehensive data (region-wise segment analysis), with forecasts and estimates in "USD billion" for the period 2025-2029, as well as historical data from 2019-2023 for the following segments.
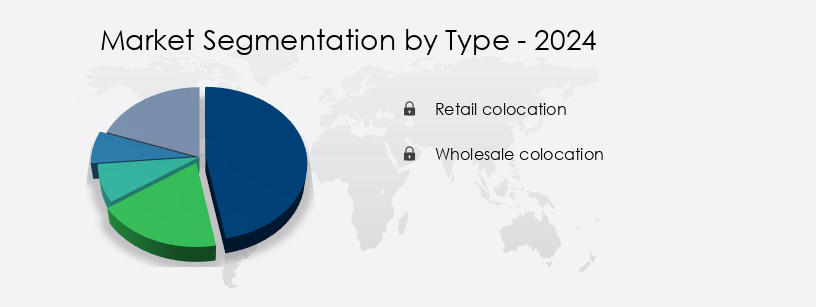
- Type
- Retail colocation
- Wholesale colocation
- End-user
- Small and medium sized enterprises
- Large enterprises
- Industry Application
- Retail
- BFSI
- IT and telecom
- Healthcare
- Others
- Business Segment
- Tier 1
- Tier 2
- Tier 3
- Tier 4
- Geography
- Western Europe
By Type Insights
- The retail colocation segment is estimated to witness significant growth during the forecast period.
Colocation is a data center solution where businesses rent space to house their IT infrastructure within a third-party facility. Retail colocation, specifically, involves enterprises leasing racks, cage spaces, or private suites within large data centers for one to three years. This trend is gaining traction among Small and Medium Enterprises (SMEs) due to the cost savings from reduced Capital Expenditure (CAPEX) and Operating Expenditure (OPEX) compared to managing in-house data centers. The growth of retail colocation is driven by the escalating costs of building and maintaining traditional data centers. European cities such as Reykjavik, Milan, Warsaw, Prague, Vienna, Madrid, and Oslo are popular destinations for colocation due to their strategic locations, economic growth, and tech markets.
Compliance with regulations like GDPR and Data Protection acts is another factor driving demand for colocation services. Furthermore, the integration of Artificial Intelligence, automation, and pattern recognition technologies in data centers is fueling innovation. The European Green Deal and the European climate pact's focus on carbon neutrality are also influencing data center infrastructure investments. Tax incentives and policies such as the Local Digital Declaration, Technology Code, and Cloud First Policy are further boosting the colocation market.
Get a glance at the market report of share of various segments Request Free Sample
Market Dynamics
Our Western Europe Data Center Colocation Market researchers analyzed the data with 2024 as the base year, along with the key drivers, trends, and challenges. A holistic analysis of drivers will help companies refine their marketing strategies to gain a competitive advantage.
What are the key market drivers leading to the rise in adoption of Western Europe Data Center Colocation Market?
Rising demand for data center colocation facilities is the key driver of the market.
- The market is experiencing significant growth due to the increasing demand for efficient and secure data management solutions. Enterprises in various sectors, including finance, healthcare, and e-commerce, require scalable and reliable infrastructure to handle the increasing data generation and processing needs. Colocation facilities offer enterprises the flexibility to adjust their resources according to their demands while ensuring enhanced security and compliance with regulations such as GDPR. Key European cities, like Reykjavik, Milan, Warsaw, Prague, Vienna, Madrid, and Oslo, are popular destinations for data center projects due to their strategic locations and advanced infrastructure.
- Cloud-based services are driving the adoption of data center colocation, with tech giants like Bosch investing in automation, Artificial Intelligence, pattern recognition, and National AI Strategy. The European Green Deal and European climate pact's focus on carbon neutrality and renewable energy is also attracting data center investments. The Local Digital Declaration, Technology Code, and Cloud First Policy, along with tax incentives, further boost the market's growth. Companies like DATA4, CenturyLink, CyrusOne, Equinix, Interxion, DigiPlex, HPE, CCS, OVHcloud, and public cloud services are major players In the European data center colocation market.
What are the market trends shaping the Western Europe Data Center Colocation Market?
Innovative approaches like submarine data centers is the upcoming trend In the market.
- Data centers consume significant amounts of energy, with cooling systems accounting for approximately 30-40% of this consumption. To mitigate these costs, data center service providers are exploring cooler locations, such as Iceland's Reykjavik, Milan, Warsaw, Prague, Vienna, and Madrid, for their data centers. Innovative cooling techniques, like free cooling and liquid immersion, are being employed to reduce power consumption. Microsoft Azure and other cloud platforms are leading the way with advanced solutions, such as submarine data centers located several feet below sea level off the coasts of Scotland and other countries. SMEs are increasingly adopting cloud-based services due to the economic benefits of OPEX models and data localization.
- Regulations, such as GDPR and data protection laws, are driving the need for data center projects. The tech markets In the Nordics, including Oslo, are experiencing growth due to the region's focus on Artificial Intelligence, automation, and pattern recognition as part of their National AI Strategies. Data centers are essential infrastructure for the digital economy, with renewable energy, tax incentives, and the European Green Deal and European climate pact playing crucial roles in promoting carbon neutrality. HPE, CCS, OVHcloud, and other providers offer public cloud services to meet the increasing demand for data processing and storage. The Local Digital Declaration and Technology Code, along with Cloud First Policies, are shaping the future of the data center market.
What challenges does Western Europe Data Center Colocation Market face during the growth?
Focus on data center consolidation is a key challenge affecting the market growth.
- Enterprises are increasingly opting for infrastructure-as-a-service (IaaS) solutions, leading to the consolidation of data centers. This trend is driven by the need to minimize operating expenses. Several software companies, including Box, Salesforce, and SAP, are adopting a common cloud platform to offer their software to enterprises, thereby reducing the requirement for individual data centers. The rise in data center virtualization is another factor contributing to the consolidation of data centers, ultimately decreasing the total number of physical data centers. Moreover, the European Green Deal and European climate pact's focus on carbon neutrality is encouraging data center operators to adopt renewable energy sources.
- This shift towards sustainability is expected to further drive the consolidation of data centers. The adoption of cloud-based services, such as Microsoft Azure and OVHcloud, is also on the rise, with SMEs increasingly utilizing public cloud services for their data needs. Artificial Intelligence (AI) and automation are becoming essential components of business strategies, with applications in pattern recognition and national AI strategies being implemented across the Nordics. Equinix, Interxion, DigiPlex, and other data center providers are investing in renewable energy and offering colocation revenue opportunities. The local digital declaration and technology Code, along with Cloud First Policy and tax incentives, are also influencing the tech markets.
Exclusive Customer Landscape
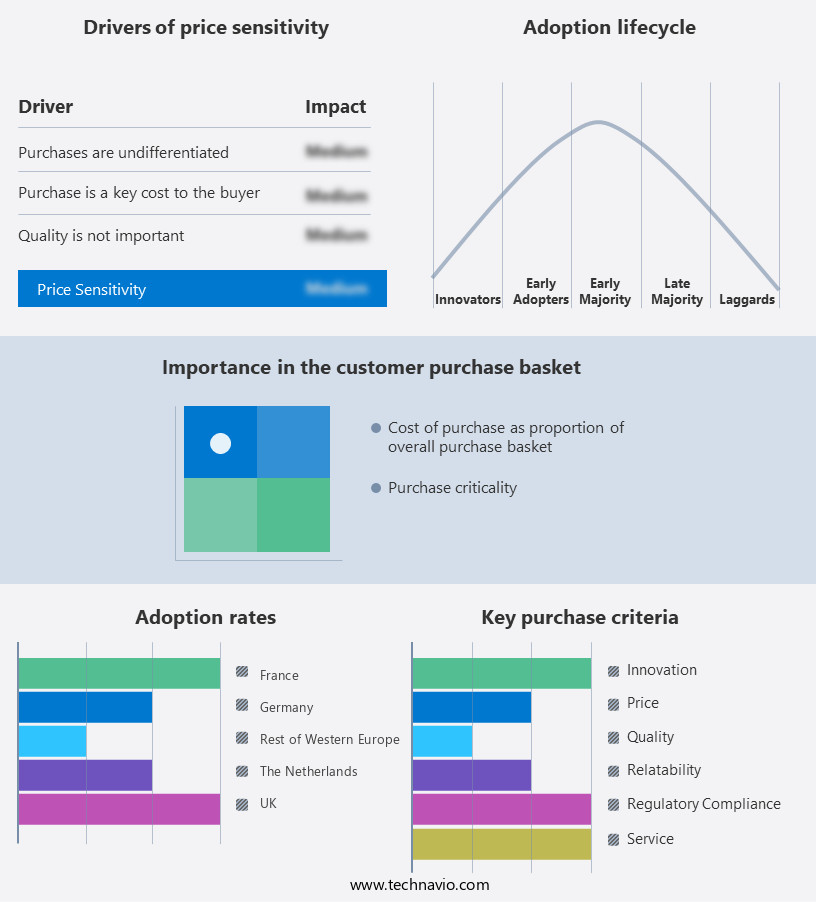
The market forecasting report includes the adoption lifecycle of the market, covering from the innovator's stage to the laggard's stage. It focuses on adoption rates in different regions based on penetration. Furthermore, the market report also includes key purchase criteria and drivers of price sensitivity to help companies evaluate and develop their market growth analysis strategies.
Customer Landscape
Key Companies & Market Insights
Companies are implementing various strategies, such as strategic alliances, market forecast, partnerships, mergers and acquisitions, geographical expansion, and product/service launches, to enhance their presence In the market.
Colt Technology Services Group Ltd. - The company offers data center colocation solutions through Colt Data Center Services.
The market research and growth report includes detailed analyses of the competitive landscape of the market and information about key companies, including:
- CyrusOne LLC
- Data4 Group
- Digital Realty Trust Inc.
- Equinix Inc.
- Iron Mountain Inc.
- IXCELLERATE LLC
- KDDI Corp.
- Lumen Technologies Inc.
- Pulsant Ltd.
- QTS Realty Trust LLC
- Scaleway SAS
- Servecentric Ltd.
- STT GDC Pte Ltd.
Qualitative and quantitative analysis of companies has been conducted to help clients understand the wider business environment as well as the strengths and weaknesses of key market players. Data is qualitatively analyzed to categorize companies as pure play, category-focused, industry-focused, and diversified; it is quantitatively analyzed to categorize companies as dominant, leading, strong, tentative, and weak.
Research Analyst Overview
The market continues to experience significant growth as businesses increasingly seek to outsource their IT infrastructure to third-party providers. This trend is driven by several factors, including the need for cost savings, improved scalability, and enhanced security and reliability. One key dynamic shaping the market is the increasing adoption of cloud-based services. As more companies move their operations to the cloud, there is a growing demand for colocation services to support these deployments. This has led to an increase in data center projects, as providers look to expand their offerings and meet the demands of their clients.
Further, another factor driving growth In the data center colocation market is the importance of data protection and compliance. With the increasing amount of data being generated, there is a growing need for secure and compliant data storage solutions. This has led to an emphasis on data localization, with many companies looking to store their data in specific regions to comply with data protection regulations. Economic growth in various tech markets is also contributing to the growth of the data center colocation market. For instance, In the Nordics, there has been a rise in economic activity In the tech sector, leading to a corresponding increase in demand for colocation services.
Moreover, this trend is expected to continue, as the region's strong focus on renewable energy and the European Green Deal and European Climate Pact make it an attractive destination for data center investments. Moreover, the adoption of artificial intelligence (AI) and automation technologies is driving the need for high-performance computing and large-scale data processing capabilities. This has led to an increase in demand for colocation services, as providers offer the necessary infrastructure and expertise to support these advanced technologies. The data center colocation market is also being shaped by various policies and initiatives. For example, the Cloud First policy and Technology Code in some countries are encouraging the adoption of cloud services and colocation, while tax incentives are being offered to attract data center investments.
|
Market Scope |
|
|
Report Coverage |
Details |
|
Page number |
208 |
|
Base year |
2024 |
|
Historic period |
2019-2023 |
|
Forecast period |
2025-2029 |
|
Growth momentum & CAGR |
Accelerate at a CAGR of 19.1% |
|
Market Growth 2025-2029 |
USD 14.14 billion |
|
Market structure |
Concentrated |
|
YoY growth 2024-2025(%) |
15.6 |
|
Key countries |
UK, Germany, France, The Netherlands, and Rest of Western Europe |
|
Competitive landscape |
Leading Companies, Market Positioning of Companies, Competitive Strategies, and Industry Risks |
What are the Key Data Covered in this Market Research and Growth Report?
- CAGR of the market during the forecast period
- Detailed information on factors that will drive the market growth and forecasting between 2025 and 2029
- Precise estimation of the size of the market and its contribution of the market in focus to the parent market
- Accurate predictions about upcoming market growth and trends and changes in consumer behaviour
- Growth of the market across Western Europe
- Thorough analysis of the market's competitive landscape and detailed information about companies
- Comprehensive analysis of factors that will challenge the growth of market companies
We can help! Our analysts can customize this market research report to meet your requirements. Get in touch