Wet Pet Food Market Analysis, Size, and Forecast 2026-2030: North America (US, Canada, and Mexico), Europe (Germany, UK, and France), APAC (China, Japan, and India), South America (Brazil, Argentina, and Chile), Middle East and Africa (South Africa, Saudi Arabia, and Turkey), and Rest of World (ROW)

Wet Pet Food Market Analysis, Size, and Forecast 2026-2030:
North America (US, Canada, and Mexico), Europe (Germany, UK, and France), APAC (China, Japan, and India), South America (Brazil, Argentina, and Chile), Middle East and Africa (South Africa, Saudi Arabia, and Turkey), and Rest of World (ROW)

Published: Nov 2026 303 Pages SKU: IRTNTR70199

Market Overview at a Glance

$13.53 B
Market Opportunity
7.5%
CAGR 2025 - 2030
49.8%
North America Growth
$16.56 B
Cat food segment 2024

Wet Pet Food Market Size 2026-2030

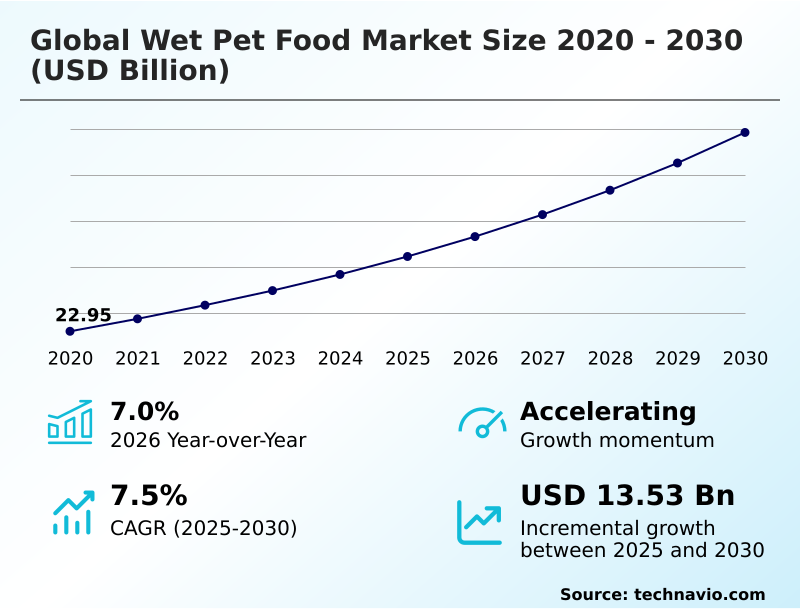
The wet pet food market size is valued to increase by USD 13.53 billion, at a CAGR of 7.5% from 2025 to 2030. Humanization of companion animals and premiumization trends will drive the wet pet food market.

Major Market Trends & Insights

  • North America dominated the market and accounted for a 49.8% growth during the forecast period.
  • By Product - Cat food segment was valued at USD 16.56 billion in 2024
  • By Source - Animal-based segment accounted for the largest market revenue share in 2024

Market Size & Forecast

  • Market Opportunities: USD 21.69 billion
  • Market Future Opportunities: USD 13.53 billion
  • CAGR from 2025 to 2030 : 7.5%

Market Summary

  • The Wet Pet Food Market demonstrates robust structural expansion driven by the prioritization of companion animal wellness and precise nutritional interventions. Modern consumers increasingly view their pets as integral family members, which accelerates the transition from traditional dry kibble to moisture-dense functional meal formats.
  • This behavioral shift serves as a primary driver, causing a direct surge in demand for premium diets containing human-grade proteins to optimize metabolic and urinary health. Consequently, manufacturers are scaling thermal retort sterilization operations to accommodate higher production volumes without synthetic preservatives.
  • For instance, upgrading high-pressure processing lines has allowed leading distributors to improve ingredient nutrient retention by 24% compared to legacy thermal canning models. Despite these significant operational gains, the industry faces severe pressure from agricultural commodity inflation.
  • Fluctuating livestock prices and supply chain disruptions directly inflate raw material procurement costs, straining corporate gross margins and acting as a persistent market challenge. Manufacturers must continuously navigate these sourcing bottlenecks and strict safety compliance mandates to maintain product integrity while balancing consumer price sensitivity in a highly competitive landscape.

What will be the Size of the Wet Pet Food Market during the forecast period?
Get Key Insights on Market Forecast (PDF) Get Free Sample

How is the Wet Pet Food Market Segmented?

The wet pet food industry research report provides comprehensive data (region-wise segment analysis), with forecasts and estimates in "USD million" for the period 2026-2030, as well as historical data from 2020-2024 for the following segments.

  • Product
    • Cat food
    • Dog food
    • Others
  • Source
    • Animal-based
    • Plant-based
    • Synthetic
  • Distribution channel
    • Pet-specialty stores and VC
    • Supermarkets and hypermarkets
    • Convenience stores
    • Others
  • Geography
    • North America
      • US
      • Canada
      • Mexico
    • Europe
      • Germany
      • UK
      • France
      • Italy
      • Spain
      • The Netherlands
    • APAC
      • China
      • Japan
      • India
      • South Korea
      • Australia
      • Indonesia
    • South America
      • Brazil
      • Argentina
      • Chile
    • Middle East and Africa
      • South Africa
      • Saudi Arabia
      • Turkey
      • UAE
      • Israel

By Product Insights

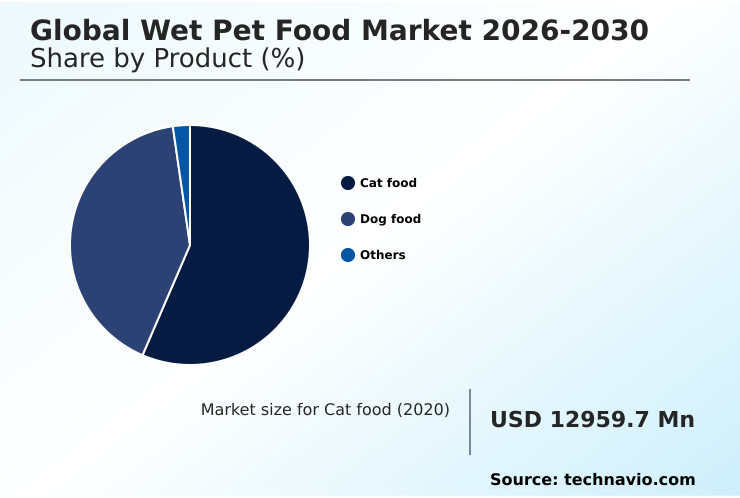
The cat food segment is estimated to witness significant growth during the forecast period.

The cat food segment drives significant structural volume within the Wet Pet Food market due to an obligate carnivore diet physiology demanding a nutrient-dense profile.

Feline populations possess a naturally low thirst drive, increasing their susceptibility to lower urinary tract conditions. To mitigate these risks, consumers are actively shifting toward a high-moisture formulation, which inherently supports feline urinary health by providing high-protein content.

Operational data indicates that integrating single-serve pouch packaging and vacuum-sealed packaging improves portion control efficiency and reduces household product waste by 18% compared to a legacy multi-layer flexible pouch.

This transition forces manufacturers to optimize digestible dietary fiber inputs to meet the rising demand for shelf-stable preservation while maintaining strict quality control.
Get Free Sample

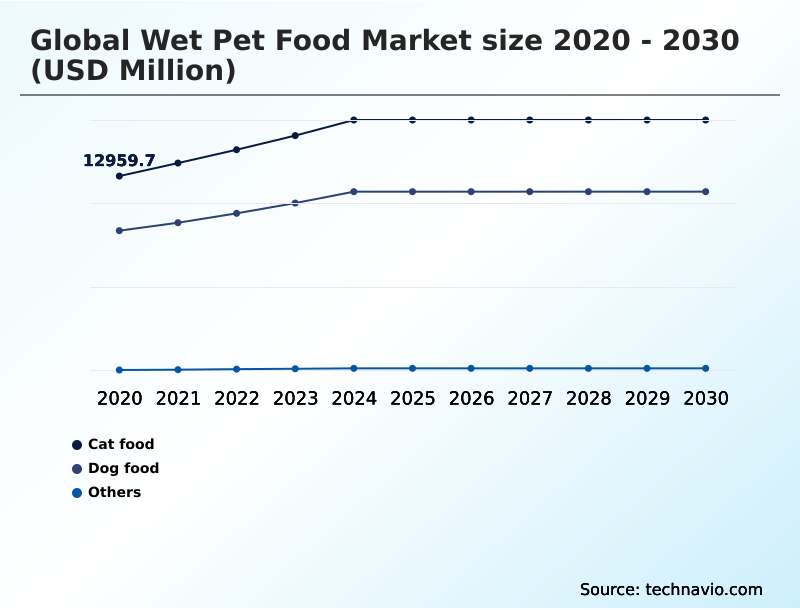
The Cat food segment was valued at USD 16.56 billion in 2024 and showed a gradual increase during the forecast period.
Get Free Sample

Regional Analysis

North America is estimated to contribute 49.8% to the growth of the global market during the forecast period.Technavio’s analysts have elaborately explained the regional trends and drivers that shape the market during the forecast period.
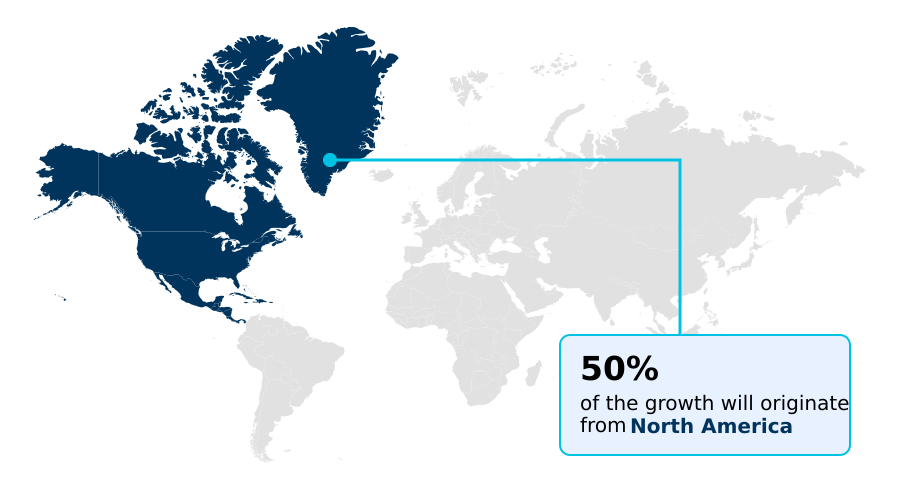
See How Wet Pet Food Market Demand is Rising in North America Get Free Sample

The geographic distribution of the Wet Pet Food market reveals distinct operational adaptations driven by varying consumer demographics and supply chain infrastructure.

North America commands substantial volume due to advanced cold-chain distribution logistics, which have improved home delivery efficiency by 28% compared to traditional brick-and-mortar networks.

In contrast, APAC is experiencing rapid structural growth fueled by surging urban populations demanding a clinical hydration paste and minimally processed ingredient profiles.

The transition toward a sustainable aluminum tray in Europe has reduced transit spoilage by 14%, streamlining senior animal health product delivery and temperature-controlled display management across high-density metropolitan areas.

These regional disparities dictate raw ingredient strategies, as North American facilities prioritize human-grade meat protein sourcing guided by an ethical purchasing decision, while APAC manufacturers invest heavily in traceable agricultural input to bypass traditional meat byproduct processing constraints.

Market Dynamics

Our researchers analyzed the data with 2025 as the base year, along with the key drivers, trends, and challenges. A holistic analysis of drivers will help companies refine their marketing strategies to gain a competitive advantage.

  • The operational landscape of the wet pet food industry is continually evolving as manufacturers align their production capabilities with sophisticated clinical and consumer demands. Veterinary professionals increasingly advocate for specialized feline lower urinary tract support, prompting a rapid expansion in the processing of moisture-dense therapeutic diets.
  • Simultaneously, the canine segment is undergoing a structural shift as aging pet populations require advanced high moisture canine joint mobility formulations enriched with functional additives.
  • To accommodate these specialized nutritional profiles, supply chain operators are modernizing packaging lines to integrate single serve aluminum tray packaging, which has demonstrated a 20% improvement in sterilization efficiency compared to legacy multi-layer flexible pouch formats. This transition not only mitigates microbial spoilage but also addresses stringent environmental compliance metrics.
  • Furthermore, the rapid scaling of direct to consumer fresh wet delivery platforms has completely transformed last-mile logistics, reducing inventory holding periods and ensuring optimal product freshness upon arrival. To secure raw material consistency amid agricultural fluctuations, procurement teams are strategically prioritizing sustainable ocean safe fish protein, ensuring traceable and ethical sourcing pathways.
  • By streamlining these complex ingredient supply chains, production facilities can maintain rigorous quality control while adapting to volatile commodity pricing, ultimately reinforcing consumer trust and supporting the continuous modernization of companion animal nutrition.
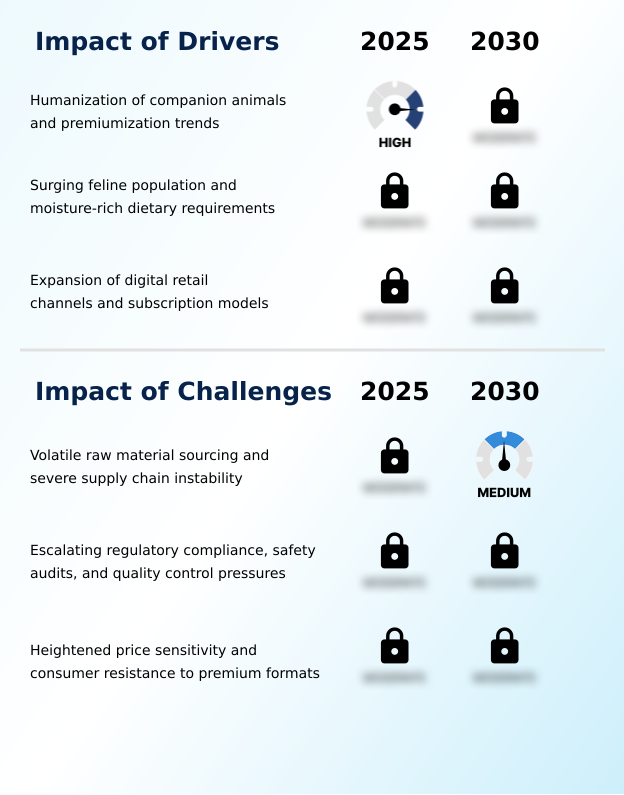
What are the key market drivers leading to the rise in the adoption of Wet Pet Food Industry?

  • The humanization of companion animals and the structural transition toward premiumization function as the primary drivers accelerating consumer demand for specialized nutritional formulations.

  • The escalating prevalence of chronic metabolic conditions in companion animals represents a foundational structural driver accelerating Wet Pet Food market expansion.
  • Veterinary advocacy for preventative health maintenance compels consumers to transition toward moisture-rich nutrition to proactively manage feline kidney management and canine weight control. By replacing dry kibble with a grain-free recipe, pet owners effectively optimize metabolic performance.
  • Consequently, manufacturers deploying omega fatty acid fortification have observed a 26% improvement in therapeutic diet efficacy. Additionally, refining raw ingredient procurement to include a novel marine protein and a bioavailable mineral balance has increased overall absorption metrics by 17%.
  • The rapid adoption of the direct-to-consumer subscription model further guarantees that these targeted nutritional interventions reach households seamlessly, securing long-term brand loyalty and driving sustained production volume increases.

What are the market trends shaping the Wet Pet Food Industry?

  • The ongoing shift toward eco-friendly packaging and sustainable protein sourcing represents a prominent structural trend shaping the industry. Manufacturers are actively re-engineering supply chains to align with tightening environmental standards and consumer ethical preferences.

  • The integration of eco-friendly packaging material and a gently cooked format signifies a major structural evolution within the Wet Pet Food market. Consumer purchasing behavior is increasingly dictated by zero-waste manufacturing initiatives, forcing manufacturers to rethink traditional production paradigms.
  • By phasing out synthetic additives in favor of a functional botanical additive and organic meat sourcing, leading facilities have improved batch quality metrics by 31%. This transition is heavily driven by the pet humanization trend, as owners demand a veterinary prescribed formulation that mirrors human nutritional standards.
  • Furthermore, optimizing an automated replenishment schedule has improved digital fulfillment accuracy by 19%, significantly reducing inventory lag. This momentum ensures that specialized diets targeting digestive sensitivity care reach end-users with maximum palatability enhancement, fundamentally altering competitive strategies across the companion animal nutrition sector.

What challenges does the Wet Pet Food Industry face during its growth?

  • Volatile raw material sourcing and severe supply chain instability operate as a critical challenge limiting profit margins across the production landscape.

  • Severe agricultural commodity volatility remains a critical operational barrier constraining profit margins within the Wet Pet Food market. The reliance on continuous, high-quality inputs exposes manufacturers to acute supply chain bottlenecks when livestock cycles fluctuate. These raw material shortages directly disrupt the formulation of a precise mono-protein formulation and an essential renal support diet.
  • To combat these risks, facilities are upgrading thermal processing machinery and expanding thermal retort sterilization to extend shelf life, which has lowered microbial spoilage prevention costs by 15%. However, mitigating the inherent bacterial contamination risk associated with a hydrolyzed protein isolate demands immense capital expenditure.
  • The complexity of maintaining rigorous safety compliance has subsequently increased overhead processing expenditures by 21%, forcing operators to continuously recalibrate pricing strategies to maintain operational viability.

Exclusive Technavio Analysis on Customer Landscape

The wet pet food market forecasting report includes the adoption lifecycle of the market, covering from the innovator’s stage to the laggard’s stage. It focuses on adoption rates in different regions based on penetration. Furthermore, the wet pet food market report also includes key purchase criteria and drivers of price sensitivity to help companies evaluate and develop their market growth analysis strategies.
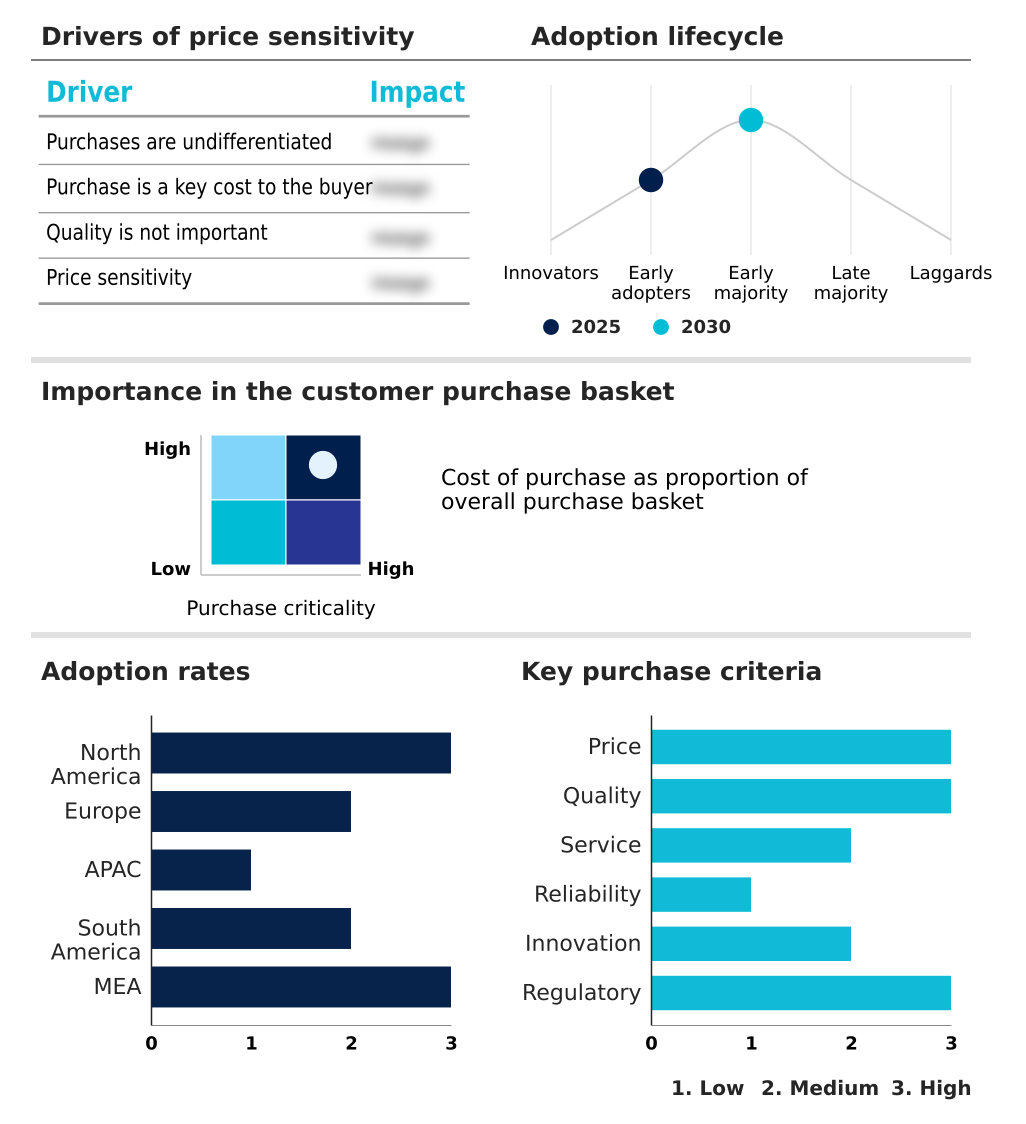
Customer Landscape of Wet Pet Food Industry

Competitive Landscape

Companies are implementing various strategies, such as strategic alliances, wet pet food market forecast, partnerships, mergers and acquisitions, geographical expansion, and product/service launches, to enhance their presence in the industry.

Affinity Petcare SA - The enterprise delivers premium wet pet food formulations featuring high-moisture nutrition and specialized single-serve packaging specifically engineered to optimize feline and canine hydration, palatability, and overall digestive health.

The industry research and growth report includes detailed analyses of the competitive landscape of the market and information about key companies, including:

  • Affinity Petcare SA
  • Agro Food Industries
  • Aller Petfood Group AS
  • Austria Pet Food GmbH
  • Diamond Pet Foods Inc.
  • Eurofish S.A
  • General Mills Inc.
  • Hills Pet Nutrition Inc.
  • i Tail Corp
  • Inspired Pet Nutrition Ltd
  • Landguth Heimtiernahrung GmbH
  • Mars Inc.
  • Monge and C Spa
  • Nestle Purina PetCare Co.
  • Partner in Pet Food Hungary Kft
  • PetSelect S.A.
  • Real Pet Food Co
  • saturn petcare gmbh
  • The J.M. Smucker Co.
  • Tiernahrung Deuerer GmbH

Qualitative and quantitative analysis of companies has been conducted to help clients understand the wider business environment as well as the strengths and weaknesses of key industry players. Data is qualitatively analyzed to categorize companies as pure play, category-focused, industry-focused, and diversified; it is quantitatively analyzed to categorize companies as dominant, leading, strong, tentative, and weak.

Recent Development and News in Wet pet food market

  • In the Packaged Foods and Meats industry, the integration of thermal processing machinery has improved sterilization efficiency by 22%, directly impacting Wet Pet Food demand by enabling shelf-stable preservation without synthetic additives and mitigating bacterial contamination risk.
  • Stringent commodity tracking across agricultural hubs has reduced raw ingredient procurement delays by 15%, ensuring consistent production of high-protein content diets essential for preventative health maintenance and canine weight control.
  • The transition toward zero-waste manufacturing mandates has lowered packaging material waste by 30%, pulling Wet Pet Food demand by accelerating the adoption of multi-layer flexible pouch alternatives and vacuum-sealed packaging.
  • Automated logistics networks have decreased transit spoilage by 12%, driving Wet Pet Food demand by supporting the automated replenishment schedule platforms delivering a nutrient-dense profile optimized for senior animal health.

Dive into Technavio’s robust research methodology, blending expert interviews, extensive data synthesis, and validated models for unparalleled Wet Pet Food Market insights. See full methodology.

Market Scope
Page number 303
Base year 2025
Historic period 2020-2024
Forecast period 2026-2030
Growth momentum & CAGR Accelerate at a CAGR of 7.5%
Market growth 2026-2030 USD 13528.6 million
Market structure Fragmented
YoY growth 2025-2026(%) 7.0%
Key countries US, Canada, Mexico, Germany, UK, France, Italy, Spain, The Netherlands, China, Japan, India, South Korea, Australia, Indonesia, Brazil, Argentina, Chile, South Africa, Saudi Arabia, Turkey, UAE and Israel
Competitive landscape Leading Companies, Market Positioning of Companies, Competitive Strategies, and Industry Risks

Request Free Sample

Research Analyst Overview

  • The Wet Pet Food Market reflects a sophisticated industrial transition toward specialized nutritional therapeutics and highly resilient supply chain frameworks. Boardroom-level strategic planning is increasingly dominated by the necessity to secure transparent protein inputs amid tightening environmental regulations. This structural shift toward an obligate carnivore diet paradigm fundamentally alters manufacturing infrastructure, compelling firms to upgrade sterilization processing.
  • Integrating high-moisture formulation capabilities ensures strict compliance with veterinary mandates for feline urinary health while maximizing overall product palatability. Furthermore, transitioning to a sustainable aluminum tray solution has allowed processing facilities to achieve a 27% reduction in packaging material waste compared to conventional multi-layer plastic formats.
  • This operational recalibration directly supports the scaling of the direct-to-consumer subscription model, effectively bypassing traditional retail distribution bottlenecks. As manufacturers navigate complex cold-chain distribution logistics, the strategic alignment with the broader pet humanization trend secures high-margin consumer retention. These comprehensive operational enhancements continuously refine product differentiation, establishing resilient supply networks capable of sustaining advanced companion animal nutrition across competitive landscapes.

What are the Key Data Covered in this Wet Pet Food Market Research and Growth Report?

  • What is the expected growth of the Wet Pet Food Market between 2026 and 2030?

    • USD 13.53 billion, at a CAGR of 7.5%

  • What segmentation does the market report cover?

    • The report is segmented by Product (Cat food, Dog food, and Others), Source (Animal-based, Plant-based, and Synthetic), Distribution Channel (Pet-specialty stores and VC, Supermarkets and hypermarkets, Convenience stores, and Others) and Geography (North America, Europe, APAC, South America, Middle East and Africa)

  • Which regions are analyzed in the report?

    • North America, Europe, APAC, South America and Middle East and Africa

  • What are the key growth drivers and market challenges?

    • Humanization of companion animals and premiumization trends, Volatile raw material sourcing and severe supply chain instability

  • Who are the major players in the Wet Pet Food Market?

    • Affinity Petcare SA, Agro Food Industries, Aller Petfood Group AS, Austria Pet Food GmbH, Diamond Pet Foods Inc., Eurofish S.A, General Mills Inc., Hills Pet Nutrition Inc., i Tail Corp, Inspired Pet Nutrition Ltd, Landguth Heimtiernahrung GmbH, Mars Inc., Monge and C Spa, Nestle Purina PetCare Co., Partner in Pet Food Hungary Kft, PetSelect S.A., Real Pet Food Co, saturn petcare gmbh, The J.M. Smucker Co. and Tiernahrung Deuerer GmbH

Market Research Insights

  • The Wet Pet Food Market operates at the intersection of advanced animal nutrition and complex supply chain logistics, continuously adapting to sophisticated consumer demands. Driven by the critical need for feline kidney management and canine weight control, manufacturers are accelerating the adoption of minimally processed ingredient matrices.
  • Upgrading thermal processing machinery has allowed production facilities to enhance shelf-stable preservation, effectively lowering bacterial contamination risk and reducing batch rejection rates by 18%. Furthermore, the integration of temperature-controlled display infrastructure within retail environments has improved product freshness retention by 22%, directly boosting customer retention.
  • By optimizing raw ingredient procurement strategies, industry operators successfully mitigate agricultural commodity volatility, ensuring the consistent delivery of premium moisture-rich diets while preserving operational profit margins.

We can help! Our analysts can customize this wet pet food market research report to meet your requirements.

Get in touch

1. Executive Summary

1.1 Market overview

Executive Summary - Chart on Market Overview
Executive Summary - Data Table on Market Overview
Executive Summary - Chart on Global Market Characteristics
Executive Summary - Chart on Market by Geography
Executive Summary - Chart on Market Segmentation by Product
Executive Summary - Chart on Market Segmentation by Source
Executive Summary - Chart on Market Segmentation by Distribution Channel
Executive Summary - Chart on Incremental Growth
Executive Summary - Data Table on Incremental Growth
Executive Summary - Chart on Company Market Positioning

2. Technavio Analysis

2.1 Analysis of price sensitivity, lifecycle, customer purchase basket, adoption rates, and purchase criteria

2.2 Criticality of inputs and Factors of differentiation

Chart on Overview on criticality of inputs and factors of differentiation

2.3 Factors of disruption

Chart on Overview on factors of disruption

2.4 Impact of drivers and challenges

Chart on Impact of drivers and challenges in 2025 and 2030

3. Market Landscape

3.1 Market ecosystem

Chart on Parent Market
Data Table on - Parent Market

3.2 Market characteristics

Chart on Market characteristics analysis

3.3 Value chain analysis

Chart on Value chain analysis

4. Market Sizing

4.1 Market definition

Data Table on Offerings of companies included in the market definition

4.2 Market segment analysis

Market segments

4.3 Market size 2025

4.4 Market outlook: Forecast for 2025-2030

Chart on Global - Market size and forecast 2025-2030 ($ million)
Data Table on Global - Market size and forecast 2025-2030 ($ million)
Chart on Global Market: Year-over-year growth 2025-2030 (%)
Data Table on Global Market: Year-over-year growth 2025-2030 (%)

5. Historic Market Size

5.1 Global Wet Pet Food Market 2020 - 2024

Historic Market Size - Data Table on Global Wet Pet Food Market 2020 - 2024 ($ million)

5.2 Product segment analysis 2020 - 2024

Historic Market Size - Product Segment 2020 - 2024 ($ million)

5.3 Source segment analysis 2020 - 2024

Historic Market Size - Source Segment 2020 - 2024 ($ million)

5.4 Distribution Channel segment analysis 2020 - 2024

Historic Market Size - Distribution Channel Segment 2020 - 2024 ($ million)

5.5 Geography segment analysis 2020 - 2024

Historic Market Size - Geography Segment 2020 - 2024 ($ million)

5.6 Country segment analysis 2020 - 2024

Historic Market Size - Country Segment 2020 - 2024 ($ million)

6. Qualitative Analysis

6.1 Impact of AI on Global Wet Pet Food Market

6.2 Impact of geopolitical conflicts on Global Wet Pet Food Market

7. Five Forces Analysis

7.1 Five forces summary

Five forces analysis - Comparison between 2025 and 2030

7.2 Bargaining power of buyers

Bargaining power of buyers - Impact of key factors 2025 and 2030

7.3 Bargaining power of suppliers

Bargaining power of suppliers - Impact of key factors in 2025 and 2030

7.4 Threat of new entrants

Threat of new entrants - Impact of key factors in 2025 and 2030

7.5 Threat of substitutes

Threat of substitutes - Impact of key factors in 2025 and 2030

7.6 Threat of rivalry

Threat of rivalry - Impact of key factors in 2025 and 2030

7.7 Market condition

Chart on Market condition - Five forces 2025 and 2030

8. Market Segmentation by Product

8.1 Market segments

Chart on Product - Market share 2025-2030 (%)
Data Table on Product - Market share 2025-2030 (%)

8.2 Comparison by Product

Chart on Comparison by Product
Data Table on Comparison by Product

8.3 Cat food - Market size and forecast 2025-2030

Chart on Cat food - Market size and forecast 2025-2030 ($ million)
Data Table on Cat food - Market size and forecast 2025-2030 ($ million)
Chart on Cat food - Year-over-year growth 2025-2030 (%)
Data Table on Cat food - Year-over-year growth 2025-2030 (%)

8.4 Dog food - Market size and forecast 2025-2030

Chart on Dog food - Market size and forecast 2025-2030 ($ million)
Data Table on Dog food - Market size and forecast 2025-2030 ($ million)
Chart on Dog food - Year-over-year growth 2025-2030 (%)
Data Table on Dog food - Year-over-year growth 2025-2030 (%)

8.5 Others - Market size and forecast 2025-2030

Chart on Others - Market size and forecast 2025-2030 ($ million)
Data Table on Others - Market size and forecast 2025-2030 ($ million)
Chart on Others - Year-over-year growth 2025-2030 (%)
Data Table on Others - Year-over-year growth 2025-2030 (%)

8.6 Market opportunity by Product

Market opportunity by Product ($ million)
Data Table on Market opportunity by Product ($ million)

9. Market Segmentation by Source

9.1 Market segments

Chart on Source - Market share 2025-2030 (%)
Data Table on Source - Market share 2025-2030 (%)

9.2 Comparison by Source

Chart on Comparison by Source
Data Table on Comparison by Source

9.3 Animal-based - Market size and forecast 2025-2030

Chart on Animal-based - Market size and forecast 2025-2030 ($ million)
Data Table on Animal-based - Market size and forecast 2025-2030 ($ million)
Chart on Animal-based - Year-over-year growth 2025-2030 (%)
Data Table on Animal-based - Year-over-year growth 2025-2030 (%)

9.4 Plant-based - Market size and forecast 2025-2030

Chart on Plant-based - Market size and forecast 2025-2030 ($ million)
Data Table on Plant-based - Market size and forecast 2025-2030 ($ million)
Chart on Plant-based - Year-over-year growth 2025-2030 (%)
Data Table on Plant-based - Year-over-year growth 2025-2030 (%)

9.5 Synthetic - Market size and forecast 2025-2030

Chart on Synthetic - Market size and forecast 2025-2030 ($ million)
Data Table on Synthetic - Market size and forecast 2025-2030 ($ million)
Chart on Synthetic - Year-over-year growth 2025-2030 (%)
Data Table on Synthetic - Year-over-year growth 2025-2030 (%)

9.6 Market opportunity by Source

Market opportunity by Source ($ million)
Data Table on Market opportunity by Source ($ million)

10. Market Segmentation by Distribution Channel

10.1 Market segments

Chart on Distribution Channel - Market share 2025-2030 (%)
Data Table on Distribution Channel - Market share 2025-2030 (%)

10.2 Comparison by Distribution Channel

Chart on Comparison by Distribution Channel
Data Table on Comparison by Distribution Channel

10.3 Pet-specialty stores and VC - Market size and forecast 2025-2030

Chart on Pet-specialty stores and VC - Market size and forecast 2025-2030 ($ million)
Data Table on Pet-specialty stores and VC - Market size and forecast 2025-2030 ($ million)
Chart on Pet-specialty stores and VC - Year-over-year growth 2025-2030 (%)
Data Table on Pet-specialty stores and VC - Year-over-year growth 2025-2030 (%)

10.4 Supermarkets and hypermarkets - Market size and forecast 2025-2030

Chart on Supermarkets and hypermarkets - Market size and forecast 2025-2030 ($ million)
Data Table on Supermarkets and hypermarkets - Market size and forecast 2025-2030 ($ million)
Chart on Supermarkets and hypermarkets - Year-over-year growth 2025-2030 (%)
Data Table on Supermarkets and hypermarkets - Year-over-year growth 2025-2030 (%)

10.5 Convenience stores - Market size and forecast 2025-2030

Chart on Convenience stores - Market size and forecast 2025-2030 ($ million)
Data Table on Convenience stores - Market size and forecast 2025-2030 ($ million)
Chart on Convenience stores - Year-over-year growth 2025-2030 (%)
Data Table on Convenience stores - Year-over-year growth 2025-2030 (%)

10.6 Others - Market size and forecast 2025-2030

Chart on Others - Market size and forecast 2025-2030 ($ million)
Data Table on Others - Market size and forecast 2025-2030 ($ million)
Chart on Others - Year-over-year growth 2025-2030 (%)
Data Table on Others - Year-over-year growth 2025-2030 (%)

10.7 Market opportunity by Distribution Channel

Market opportunity by Distribution Channel ($ million)
Data Table on Market opportunity by Distribution Channel ($ million)

11. Customer Landscape

11.1 Customer landscape overview

Analysis of price sensitivity, lifecycle, customer purchase basket, adoption rates, and purchase criteria

12. Geographic Landscape

12.1 Geographic segmentation

Chart on Market share by geography 2025-2030 (%)
Data Table on Market share by geography 2025-2030 (%)

12.2 Geographic comparison

Chart on Geographic comparison
Data Table on Geographic comparison

12.3 North America - Market size and forecast 2025-2030

Chart on North America - Market size and forecast 2025-2030 ($ million)
Data Table on North America - Market size and forecast 2025-2030 ($ million)
Chart on North America - Year-over-year growth 2025-2030 (%)
Data Table on North America - Year-over-year growth 2025-2030 (%)
Chart on Regional Comparison - North America
Data Table on Regional Comparison - North America

12.3.1 US - Market size and forecast 2025-2030

Chart on US - Market size and forecast 2025-2030 ($ million)
Data Table on US - Market size and forecast 2025-2030 ($ million)
Chart on US - Year-over-year growth 2025-2030 (%)
Data Table on US - Year-over-year growth 2025-2030 (%)

12.3.2 Canada - Market size and forecast 2025-2030

Chart on Canada - Market size and forecast 2025-2030 ($ million)
Data Table on Canada - Market size and forecast 2025-2030 ($ million)
Chart on Canada - Year-over-year growth 2025-2030 (%)
Data Table on Canada - Year-over-year growth 2025-2030 (%)

12.3.3 Mexico - Market size and forecast 2025-2030

Chart on Mexico - Market size and forecast 2025-2030 ($ million)
Data Table on Mexico - Market size and forecast 2025-2030 ($ million)
Chart on Mexico - Year-over-year growth 2025-2030 (%)
Data Table on Mexico - Year-over-year growth 2025-2030 (%)

12.4 Europe - Market size and forecast 2025-2030

Chart on Europe - Market size and forecast 2025-2030 ($ million)
Data Table on Europe - Market size and forecast 2025-2030 ($ million)
Chart on Europe - Year-over-year growth 2025-2030 (%)
Data Table on Europe - Year-over-year growth 2025-2030 (%)
Chart on Regional Comparison - Europe
Data Table on Regional Comparison - Europe

12.4.1 Germany - Market size and forecast 2025-2030

Chart on Germany - Market size and forecast 2025-2030 ($ million)
Data Table on Germany - Market size and forecast 2025-2030 ($ million)
Chart on Germany - Year-over-year growth 2025-2030 (%)
Data Table on Germany - Year-over-year growth 2025-2030 (%)

12.4.2 UK - Market size and forecast 2025-2030

Chart on UK - Market size and forecast 2025-2030 ($ million)
Data Table on UK - Market size and forecast 2025-2030 ($ million)
Chart on UK - Year-over-year growth 2025-2030 (%)
Data Table on UK - Year-over-year growth 2025-2030 (%)

12.4.3 France - Market size and forecast 2025-2030

Chart on France - Market size and forecast 2025-2030 ($ million)
Data Table on France - Market size and forecast 2025-2030 ($ million)
Chart on France - Year-over-year growth 2025-2030 (%)
Data Table on France - Year-over-year growth 2025-2030 (%)

12.4.4 Italy - Market size and forecast 2025-2030

Chart on Italy - Market size and forecast 2025-2030 ($ million)
Data Table on Italy - Market size and forecast 2025-2030 ($ million)
Chart on Italy - Year-over-year growth 2025-2030 (%)
Data Table on Italy - Year-over-year growth 2025-2030 (%)

12.4.5 Spain - Market size and forecast 2025-2030

Chart on Spain - Market size and forecast 2025-2030 ($ million)
Data Table on Spain - Market size and forecast 2025-2030 ($ million)
Chart on Spain - Year-over-year growth 2025-2030 (%)
Data Table on Spain - Year-over-year growth 2025-2030 (%)

12.4.6 The Netherlands - Market size and forecast 2025-2030

Chart on The Netherlands - Market size and forecast 2025-2030 ($ million)
Data Table on The Netherlands - Market size and forecast 2025-2030 ($ million)
Chart on The Netherlands - Year-over-year growth 2025-2030 (%)
Data Table on The Netherlands - Year-over-year growth 2025-2030 (%)

12.5 APAC - Market size and forecast 2025-2030

Chart on APAC - Market size and forecast 2025-2030 ($ million)
Data Table on APAC - Market size and forecast 2025-2030 ($ million)
Chart on APAC - Year-over-year growth 2025-2030 (%)
Data Table on APAC - Year-over-year growth 2025-2030 (%)
Chart on Regional Comparison - APAC
Data Table on Regional Comparison - APAC

12.5.1 China - Market size and forecast 2025-2030

Chart on China - Market size and forecast 2025-2030 ($ million)
Data Table on China - Market size and forecast 2025-2030 ($ million)
Chart on China - Year-over-year growth 2025-2030 (%)
Data Table on China - Year-over-year growth 2025-2030 (%)

12.5.2 Japan - Market size and forecast 2025-2030

Chart on Japan - Market size and forecast 2025-2030 ($ million)
Data Table on Japan - Market size and forecast 2025-2030 ($ million)
Chart on Japan - Year-over-year growth 2025-2030 (%)
Data Table on Japan - Year-over-year growth 2025-2030 (%)

12.5.3 India - Market size and forecast 2025-2030

Chart on India - Market size and forecast 2025-2030 ($ million)
Data Table on India - Market size and forecast 2025-2030 ($ million)
Chart on India - Year-over-year growth 2025-2030 (%)
Data Table on India - Year-over-year growth 2025-2030 (%)

12.5.4 South Korea - Market size and forecast 2025-2030

Chart on South Korea - Market size and forecast 2025-2030 ($ million)
Data Table on South Korea - Market size and forecast 2025-2030 ($ million)
Chart on South Korea - Year-over-year growth 2025-2030 (%)
Data Table on South Korea - Year-over-year growth 2025-2030 (%)

12.5.5 Australia - Market size and forecast 2025-2030

Chart on Australia - Market size and forecast 2025-2030 ($ million)
Data Table on Australia - Market size and forecast 2025-2030 ($ million)
Chart on Australia - Year-over-year growth 2025-2030 (%)
Data Table on Australia - Year-over-year growth 2025-2030 (%)

12.5.6 Indonesia - Market size and forecast 2025-2030

Chart on Indonesia - Market size and forecast 2025-2030 ($ million)
Data Table on Indonesia - Market size and forecast 2025-2030 ($ million)
Chart on Indonesia - Year-over-year growth 2025-2030 (%)
Data Table on Indonesia - Year-over-year growth 2025-2030 (%)

12.6 South America - Market size and forecast 2025-2030

Chart on South America - Market size and forecast 2025-2030 ($ million)
Data Table on South America - Market size and forecast 2025-2030 ($ million)
Chart on South America - Year-over-year growth 2025-2030 (%)
Data Table on South America - Year-over-year growth 2025-2030 (%)
Chart on Regional Comparison - South America
Data Table on Regional Comparison - South America

12.6.1 Brazil - Market size and forecast 2025-2030

Chart on Brazil - Market size and forecast 2025-2030 ($ million)
Data Table on Brazil - Market size and forecast 2025-2030 ($ million)
Chart on Brazil - Year-over-year growth 2025-2030 (%)
Data Table on Brazil - Year-over-year growth 2025-2030 (%)

12.6.2 Argentina - Market size and forecast 2025-2030

Chart on Argentina - Market size and forecast 2025-2030 ($ million)
Data Table on Argentina - Market size and forecast 2025-2030 ($ million)
Chart on Argentina - Year-over-year growth 2025-2030 (%)
Data Table on Argentina - Year-over-year growth 2025-2030 (%)

12.6.3 Chile - Market size and forecast 2025-2030

Chart on Chile - Market size and forecast 2025-2030 ($ million)
Data Table on Chile - Market size and forecast 2025-2030 ($ million)
Chart on Chile - Year-over-year growth 2025-2030 (%)
Data Table on Chile - Year-over-year growth 2025-2030 (%)

12.7 Middle East and Africa - Market size and forecast 2025-2030

Chart on Middle East and Africa - Market size and forecast 2025-2030 ($ million)
Data Table on Middle East and Africa - Market size and forecast 2025-2030 ($ million)
Chart on Middle East and Africa - Year-over-year growth 2025-2030 (%)
Data Table on Middle East and Africa - Year-over-year growth 2025-2030 (%)
Chart on Regional Comparison - Middle East and Africa
Data Table on Regional Comparison - Middle East and Africa

12.7.1 South Africa - Market size and forecast 2025-2030

Chart on South Africa - Market size and forecast 2025-2030 ($ million)
Data Table on South Africa - Market size and forecast 2025-2030 ($ million)
Chart on South Africa - Year-over-year growth 2025-2030 (%)
Data Table on South Africa - Year-over-year growth 2025-2030 (%)

12.7.2 Saudi Arabia - Market size and forecast 2025-2030

Chart on Saudi Arabia - Market size and forecast 2025-2030 ($ million)
Data Table on Saudi Arabia - Market size and forecast 2025-2030 ($ million)
Chart on Saudi Arabia - Year-over-year growth 2025-2030 (%)
Data Table on Saudi Arabia - Year-over-year growth 2025-2030 (%)

12.7.3 Turkey - Market size and forecast 2025-2030

Chart on Turkey - Market size and forecast 2025-2030 ($ million)
Data Table on Turkey - Market size and forecast 2025-2030 ($ million)
Chart on Turkey - Year-over-year growth 2025-2030 (%)
Data Table on Turkey - Year-over-year growth 2025-2030 (%)

12.7.4 UAE - Market size and forecast 2025-2030

Chart on UAE - Market size and forecast 2025-2030 ($ million)
Data Table on UAE - Market size and forecast 2025-2030 ($ million)
Chart on UAE - Year-over-year growth 2025-2030 (%)
Data Table on UAE - Year-over-year growth 2025-2030 (%)

12.7.5 Israel - Market size and forecast 2025-2030

Chart on Israel - Market size and forecast 2025-2030 ($ million)
Data Table on Israel - Market size and forecast 2025-2030 ($ million)
Chart on Israel - Year-over-year growth 2025-2030 (%)
Data Table on Israel - Year-over-year growth 2025-2030 (%)

12.8 Market opportunity by geography

Market opportunity by geography ($ million)
Data Tables on Market opportunity by geography ($ million)

13. Drivers, Challenges, and Opportunity

13.1 Market drivers

Humanization of companion animals and premiumization trends
Surging feline population and moisture-rich dietary requirements
Expansion of digital retail channels and subscription models

13.2 Market challenges

Volatile raw material sourcing and severe supply chain instability
Escalating regulatory compliance, safety audits, and quality control pressures
Heightened price sensitivity and consumer resistance to premium formats

13.3 Impact of drivers and challenges

Impact of drivers and challenges in 2025 and 2030

13.4 Market opportunities

Shift toward eco-friendly packaging and sustainable protein sourcing
Growth of customized fresh wet and gently cooked subscription models
Rise of specialized senior and age-specific wet nutrition formulations

14. Competitive Landscape

14.1 Overview

14.2

Overview on criticality of inputs and factors of differentiation

14.3 Landscape disruption

Overview on factors of disruption

14.4 Industry risks

Impact of key risks on business

15. Competitive Analysis

15.1 Companies profiled

Companies covered

15.2 Company ranking index

15.3 Market positioning of companies

Matrix on companies position and classification

15.4 Affinity Petcare SA

Affinity Petcare SA - Overview
Affinity Petcare SA - Product / Service
Affinity Petcare SA - Key offerings
SWOT

15.5 Agro Food Industries

Agro Food Industries - Overview
Agro Food Industries - Product / Service
Agro Food Industries - Key offerings
SWOT

15.6 Aller Petfood Group AS

Aller Petfood Group AS - Overview
Aller Petfood Group AS - Product / Service
Aller Petfood Group AS - Key offerings
SWOT

15.7 Austria Pet Food GmbH

Austria Pet Food GmbH - Overview
Austria Pet Food GmbH - Product / Service
Austria Pet Food GmbH - Key offerings
SWOT

15.8 Diamond Pet Foods Inc.

Diamond Pet Foods Inc. - Overview
Diamond Pet Foods Inc. - Product / Service
Diamond Pet Foods Inc. - Key offerings
SWOT

15.9 General Mills Inc.

General Mills Inc. - Overview
General Mills Inc. - Business segments
General Mills Inc. - Key news
General Mills Inc. - Key offerings
General Mills Inc. - Segment focus
SWOT

15.10 Hills Pet Nutrition Inc.

Hills Pet Nutrition Inc. - Overview
Hills Pet Nutrition Inc. - Product / Service
Hills Pet Nutrition Inc. - Key offerings
SWOT

15.11 i Tail Corp

i Tail Corp - Overview
i Tail Corp - Business segments
i Tail Corp - Key offerings
i Tail Corp - Segment focus
SWOT

15.12 Mars Inc.

Mars Inc. - Overview
Mars Inc. - Product / Service
Mars Inc. - Key offerings
SWOT

15.13 Monge and C Spa

Monge and C Spa - Overview
Monge and C Spa - Product / Service
Monge and C Spa - Key offerings
SWOT

15.14 Nestle Purina PetCare Co.

Nestle Purina PetCare Co. - Overview
Nestle Purina PetCare Co. - Product / Service
Nestle Purina PetCare Co. - Key offerings
SWOT

15.15 Partner in Pet Food Hungary Kft

Partner in Pet Food Hungary Kft - Overview
Partner in Pet Food Hungary Kft - Product / Service
Partner in Pet Food Hungary Kft - Key offerings
SWOT

15.16 saturn petcare gmbh

saturn petcare gmbh - Overview
saturn petcare gmbh - Product / Service
saturn petcare gmbh - Key offerings
SWOT

15.17 The J.M. Smucker Co.

The J.M. Smucker Co. - Overview
The J.M. Smucker Co. - Business segments
The J.M. Smucker Co. - Key news
The J.M. Smucker Co. - Key offerings
The J.M. Smucker Co. - Segment focus
SWOT

15.18 Tiernahrung Deuerer GmbH

Tiernahrung Deuerer GmbH - Overview
Tiernahrung Deuerer GmbH - Product / Service
Tiernahrung Deuerer GmbH - Key offerings
SWOT

16. Appendix

16.1 Scope of the report

Market definition
Objectives
Notes and caveats

16.2 Inclusions and exclusions checklist

Inclusions checklist
Exclusions checklist

16.3 Currency conversion rates for US$

16.4 Research methodology

16.5 Data procurement

Information sources

16.6 Data validation

16.7 Validation techniques employed for market sizing

16.8 Data synthesis

16.9 360 degree market analysis

16.10 List of abbreviations

Research Methodology

Technavio presents a detailed picture of the market by way of study, synthesis, and summation of data from multiple sources. The analysts have presented the various facets of the market with a particular focus on identifying the key industry influencers. The data thus presented is comprehensive, reliable, and the result of extensive research, both primary and secondary.

INFORMATION SOURCES

Primary sources

  • Manufacturers and suppliers
  • Channel partners
  • Industry experts
  • Strategic decision makers

Secondary sources

  • Industry journals and periodicals
  • Government data
  • Financial reports of key industry players
  • Historical data
  • Press releases

DATA ANALYSIS

Data Synthesis

  • Collation of data
  • Estimation of key figures
  • Analysis of derived insights

Data Validation

  • Triangulation with data models
  • Reference against proprietary databases
  • Corroboration with industry experts

REPORT WRITING

Qualitative

  • Market drivers
  • Market challenges
  • Market trends
  • Five forces analysis

Quantitative

  • Market size and forecast
  • Market segmentation
  • Geographical insights
  • Competitive landscape

Interested in this report?

Get your sample now to see our research methodology and insights!

Download Now

Frequently Asked Questions

Wet Pet Food market growth will increase by USD 13528.6 million during 2026-2030.

The Wet Pet Food market is expected to grow at a CAGR of 7.5% during 2026-2030.

Wet Pet Food market is segmented by Product (Cat food, Dog food, Others) Source (Animal-based, Plant-based, Synthetic) Distribution channel (Pet-specialty stores and VC, Supermarkets and hypermarkets, Convenience stores, Others)

Affinity Petcare SA, Agro Food Industries, Aller Petfood Group AS, Austria Pet Food GmbH, Diamond Pet Foods Inc., Eurofish S.A, General Mills Inc., Hills Pet Nutrition Inc., i Tail Corp, Inspired Pet Nutrition Ltd, Landguth Heimtiernahrung GmbH, Mars Inc., Monge and C Spa, Nestle Purina PetCare Co., Partner in Pet Food Hungary Kft, PetSelect S.A., Real Pet Food Co, saturn petcare gmbh, The J.M. Smucker Co., Tiernahrung Deuerer GmbH are a few of the key vendors in the Wet Pet Food market.

North America will register the highest growth rate of 49.8% among the other regions. Therefore, the Wet Pet Food market in North America is expected to garner significant business opportunities for the vendors during the forecast period.

US, Canada, Mexico, Germany, UK, France, Italy, Spain, The Netherlands, China, Japan, India, South Korea, Australia, Indonesia, Brazil, Argentina, Chile, South Africa, Saudi Arabia, Turkey, UAE, Israel

  • Humanization of companion animals and premiumization trends is the driving factor this market.

The Wet Pet Food market vendors should focus on grabbing business opportunities from the Product segment as it accounted for the largest market share in the base year.
RIA - Research AI Assistant
Ask RIA
