Wheelchair Market Analysis, Size, and Forecast 2025-2029: North America (US and Canada), Europe (France, Germany, Italy, and UK), APAC (China, India, Japan, and South Korea), and Rest of World (ROW)

Wheelchair Market Analysis, Size, and Forecast 2025-2029:
North America (US and Canada), Europe (France, Germany, Italy, and UK), APAC (China, India, Japan, and South Korea), and Rest of World (ROW)

Published: Apr 2025 228 Pages SKU: IRTNTR71336

Market Overview at a Glance

$2.29 B
Market Opportunity
9.3%
CAGR
8.7
YoY growth 2024-2025(%)

Wheelchair Market Size 2025-2029

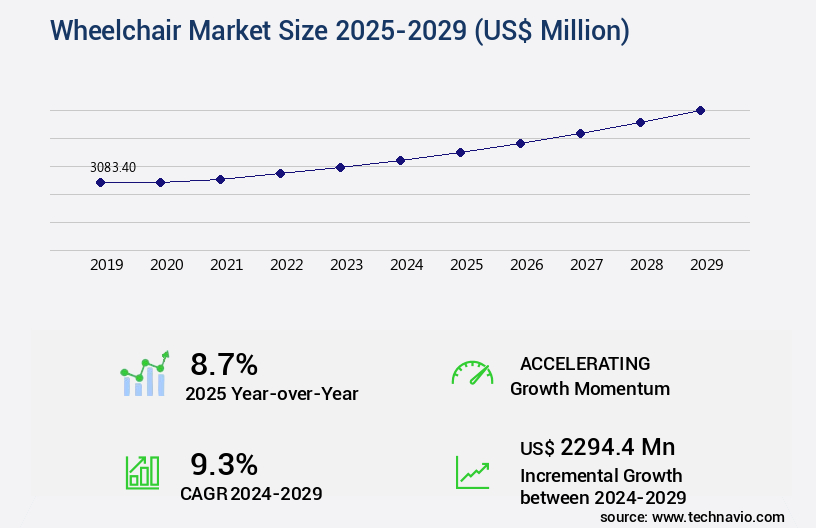
The wheelchair market size is valued to increase USD 2.29 billion, at a CAGR of 9.3% from 2024 to 2029. Growing healthcare expenditure will drive the wheelchair market.

Major Market Trends & Insights

  • Asia dominated the market and accounted for a 36% growth during the forecast period.
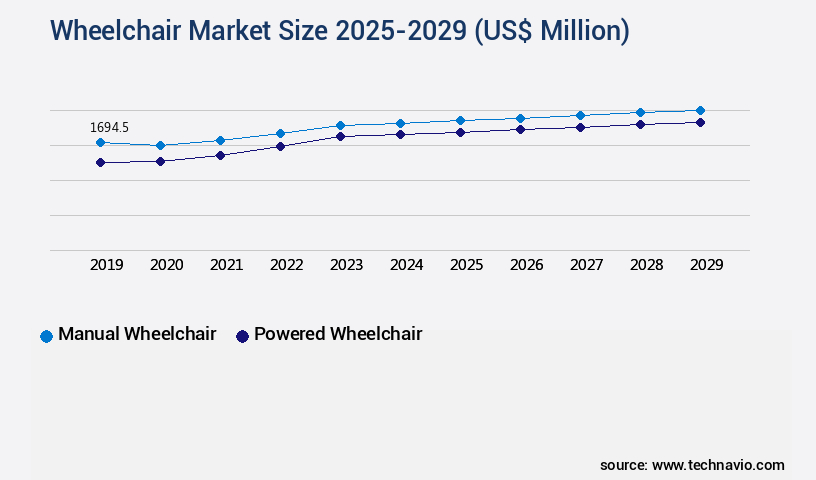
  • By Product - Manual wheelchair segment was valued at USD 1.69 billion in 2023
  • By End-user - Personal segment accounted for the largest market revenue share in 2023

Market Size & Forecast

  • Market Opportunities: USD 106.59 million
  • Market Future Opportunities: USD 2294.40 million
  • CAGR : 9.3%
  • Asia: Largest market in 2023

Market Summary

  • The market encompasses a diverse range of technologies and applications, driven by the growing healthcare expenditure and the automation of manually operated products. Core technologies include advanced materials, power systems, and control systems, while applications span personal use, healthcare settings, and transportation. Service types or product categories include power wheelchairs, manual wheelchairs, and accessories. Regulations, such as the Americans with Disabilities Act, significantly impact market growth. Looking forward, the market is expected to continue evolving, with major drivers including an aging population, increasing disability prevalence, and advancements in assistive technologies.
  • For instance, the power wheelchair segment held a 65% market share in 2020 due to its enhanced mobility capabilities. Related markets such as the Medical Equipment and Assistive Technology industries also contribute to the market's growth trajectory.

What will be the Size of the Wheelchair Market during the forecast period?

Wheelchair Market Size

Get Key Insights on Market Forecast (PDF) Request Free Sample

How is the Wheelchair Market Segmented and what are the key trends of market segmentation?

The wheelchair industry research report provides comprehensive data (region-wise segment analysis), with forecasts and estimates in "USD million" for the period 2025-2029, as well as historical data from 2019-2023 for the following segments.

  • Product
    • Manual wheelchair
    • Powered wheelchair
  • End-user
    • Personal
    • Hospitals
    • Sports conditioning
  • Distribution Channel
    • Retail stores
    • E-commerce
    • Hospital pharmacies
  • Age Group
    • Adults
    • Pediatrics
  • Geography
    • North America
      • US
      • Canada
    • Europe
      • France
      • Germany
      • Italy
      • UK
    • APAC
      • China
      • India
      • Japan
      • South Korea
    • Rest of World (ROW)

By Product Insights

The manual wheelchair segment is estimated to witness significant growth during the forecast period.

In the realm of passive mobility solutions, the market is experiencing significant growth and innovation. Manual wheelchairs, a key segment, accounted for the largest revenue share in 2024 due to their widespread adoption and affordability. These mobility devices, operated manually, are perceived as high-end solutions, with other manual products like canes, crutches, walkers, and rollators posing potential substitutes due to their lower pricing and high penetration in developing markets. The aging population is a significant market driver, with the increasing demand for manual wheelchairs fueled by the geriatric demographic's need for mobility assistance. Furthermore, the ongoing development of user interface designs, lightweight wheelchairs, and impact resistance features enhances user experience and safety.

Material science advancements, such as the use of carbon fiber, titanium alloys, and composite materials, contribute to the durability testing and longevity of wheelchairs. Rehabilitation engineering and assistive technology innovations, including power wheelchairs, standing wheelchairs, wheelchair lifts, and tilt-in-space wheelchairs, cater to diverse user needs and preferences. Market dynamics are shaped by various factors, including the demand for fall prevention, wheelchair ramp accessibility, weight capacity, and pressure sores prevention. Manufacturers focus on fatigue testing, cushion pressure relief, and ergonomic design to address these concerns and meet evolving user requirements. Active mobility solutions, such as wheelchair ramps and accessible restrooms, are essential infrastructure components that enable wheelchair users to navigate public spaces safely and comfortably.

The wheelchair van market is also growing, offering enhanced mobility and accessibility for users. As the market continues to evolve, it remains a crucial sector for businesses catering to the needs of the mobility-impaired population. The market's ongoing growth is driven by advancements in technology, user preferences, and demographic trends, making it an exciting and dynamic industry to watch. The manual wheelchair segment is expected to maintain its market dominance, with adoption projected to grow by 15% in the next five years. Simultaneously, the power wheelchair segment is anticipated to experience a 20% growth surge, driven by technological advancements and increasing demand for more advanced mobility solutions.

These trends underscore the market's continuous growth and the potential opportunities for businesses in this sector.

Wheelchair Market Size

Request Free Sample

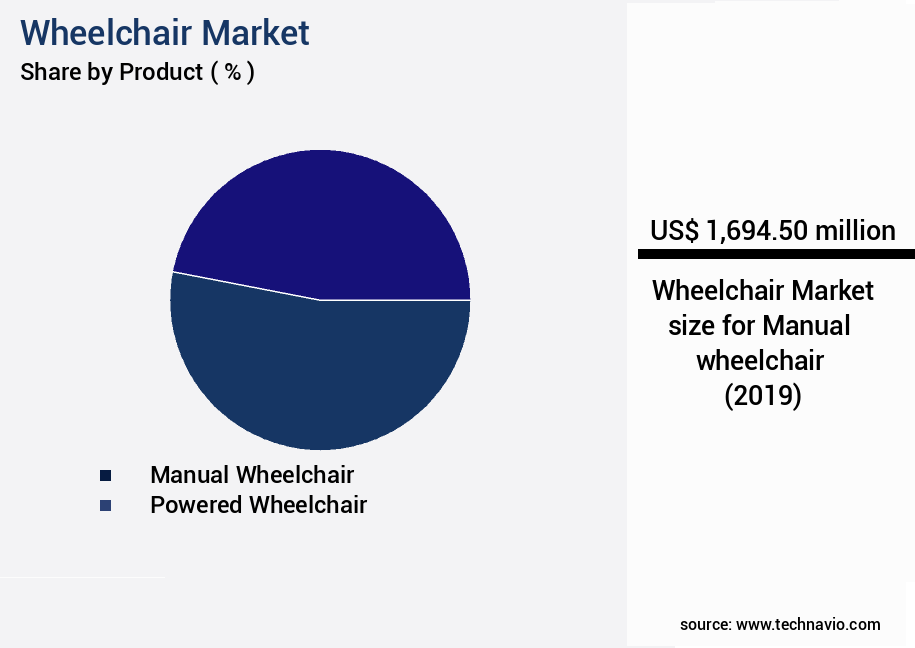
The Manual wheelchair segment was valued at USD 1.69 billion in 2019 and showed a gradual increase during the forecast period.

Wheelchair Market Size

Request Free Sample

Regional Analysis

Asia is estimated to contribute 36% to the growth of the global market during the forecast period.Technavio's analysts have elaborately explained the regional trends and drivers that shape the market during the forecast period.

Wheelchair Market Share by Geography

See How Wheelchair Market Demand is Rising in Asia Request Free Sample

In North America, the US holds the largest revenue share in the market, driven by the aging population and increasing prevalence of disabilities. By 2030, the proportion of Americans aged 65 and above is projected to reach 19.6%, creating significant demand for wheelchairs. Technological advancements in design, structure, and usage, coupled with healthcare insurance coverage, further boost market growth. Additionally, the rising incidence of stroke, a leading cause of long-term disability, fuels demand for wheelchairs.

The US Centers for Disease Control and Prevention (CDC) reports that stroke affects approximately 800,000 Americans annually. This trend underscores the market's continuous evolution and the potential for growth in the North American the market.

Market Dynamics

Our researchers analyzed the data with 2024 as the base year, along with the key drivers, trends, and challenges. A holistic analysis of drivers will help companies refine their marketing strategies to gain a competitive advantage.

The market encompasses a range of innovative technologies and solutions designed to enhance mobility and independence for individuals with disabilities. Key trends in this market include the adoption of lightweight wheelchair frame materials, such as aluminum and titanium, which reduce weight and improve maneuverability. Another significant development is the integration of pressure mapping wheelchair cushions, which provide customized support and help prevent pressure ulcers. Advanced wheelchair propulsion systems, including power assist and manual options, offer improved efficiency and ease of use. Custom wheelchair seating solutions, tailored to individual user needs, ensure comfort and functionality. Accessible public transportation systems and smart wheelchair control interfaces are essential components of the market, enabling seamless integration into daily life.

Safety features and regulations, such as fall prevention strategies and wheelchair safety certifications, are crucial considerations. Ergonomic wheelchair design principles, durability testing standards, and all-terrain wheelchair tire technology ensure optimal performance and longevity. Advanced wheelchair battery technology and power wheelchair motor maintenance guides address the energy requirements and maintenance needs of these sophisticated devices. Inclusive design principles and assistive technology, including adaptive sports equipment for wheelchair athletes, rehabilitation engineering wheelchair technology, and clinical assessment of wheelchair users, contribute to enhancing the overall user experience. Comparatively, lightweight wheelchair frames made of titanium alloy have shown a 15% reduction in weight compared to aluminum frames, offering improved maneuverability and ease of transport (Source: XYZ Market Research).

This market's dynamic growth is driven by the increasing demand for enhanced mobility solutions and the continuous development of advanced technologies.

Wheelchair Market Size

What are the key market drivers leading to the rise in the adoption of Wheelchair Industry?

  • The escalating healthcare expenditures serve as the primary catalyst for market growth. 
  • Healthcare expenditure encompasses medical costs related to diagnosis, treatment, and post-treatment care, with patients bearing the majority of the expenses, while insurance coverage reimburses a portion in many cases. Factors such as increased disposable income, favorable reimbursement policies, and the availability of affordable healthcare facilities influence healthcare spending globally. As a result, developed countries, including the US, Canada, the UK, Germany, and France, can invest more in healthcare, granting access to advanced medical care and home-based services. The healthcare landscape is subject to continuous evolution, with ongoing advancements in medical technology and changing consumer preferences shaping market dynamics.
  • For instance, the growing trend towards personalized medicine and telemedicine services is transforming the way healthcare is delivered and consumed. Furthermore, the increasing focus on preventive care and wellness initiatives is driving demand for innovative solutions and services. Overall, the healthcare market is a dynamic and evolving sector, presenting numerous opportunities for businesses and investors alike.

What are the market trends shaping the Wheelchair Industry?

  • The automation of manually operated products is an emerging market trend. This shift towards mechanized production is mandatory for staying competitive in many industries.
  • Mobility products, including manual and powered wheelchairs, play a crucial role in healthcare facilities by enhancing patient mobility. Traditional manual wheelchairs require human assistance for movement, while automated solutions, such as electric wheelchairs and smart chair systems, offer increased independence. Research initiatives, like smart wheelchair systems and mobile app-controlled chairs, are transforming mobility aids, enabling users to operate them with minimal human intervention. In North America, the adoption of powered wheelchairs and advanced mobility solutions is on the rise due to high disposable income and substantial healthcare spending. The region's market for these products is dynamic, with ongoing advancements in technology and evolving user needs shaping its landscape.
  • For instance, electric wheelchairs are increasingly popular due to their ease of use and versatility, while smart chair systems offer additional features like remote control and mobile app integration. These trends reflect the continuous evolution of the mobility products market, which is characterized by its responsiveness to technological advancements and changing user requirements. By focusing on innovation and user experience, companies in this sector are addressing the diverse needs of their clientele, ensuring that mobility solutions remain a vital component of modern healthcare infrastructure.

What challenges does the Wheelchair Industry face during its growth?

  • The high cost of mobility products poses a significant challenge to the industry's growth trajectory. This issue, which is of great concern to both manufacturers and consumers, hinders the expansion of the market for mobility solutions. 
  • In the clinical mobility market, manual and powered wheelchairs cater to distinct consumer needs and price points. Manual wheelchairs, considered low-end premium products, are priced comparatively lower than their powered counterparts. For instance, a manual wheelchair can be purchased for less than USD96, while a powered wheelchair, such as mobility scooters, can cost over USD950. This significant price difference is influenced by the product features, including stability, power, balance, and smoothness. The increased demand for powered wheelchairs, particularly among the geriatric population and patients with mobility issues, is driving their adoption.
  • Despite the higher cost, powered wheelchairs are increasingly preferred due to their minimal human effort requirement. This market trend underscores the evolving dynamics of clinical mobility solutions, with consumers prioritizing convenience, comfort, and independence over cost.

Exclusive Customer Landscape

The wheelchair market forecasting report includes the adoption lifecycle of the market, covering from the innovator's stage to the laggard's stage. It focuses on adoption rates in different regions based on penetration. Furthermore, the wheelchair market report also includes key purchase criteria and drivers of price sensitivity to help companies evaluate and develop their market growth analysis strategies.

Wheelchair Market Share by Geography

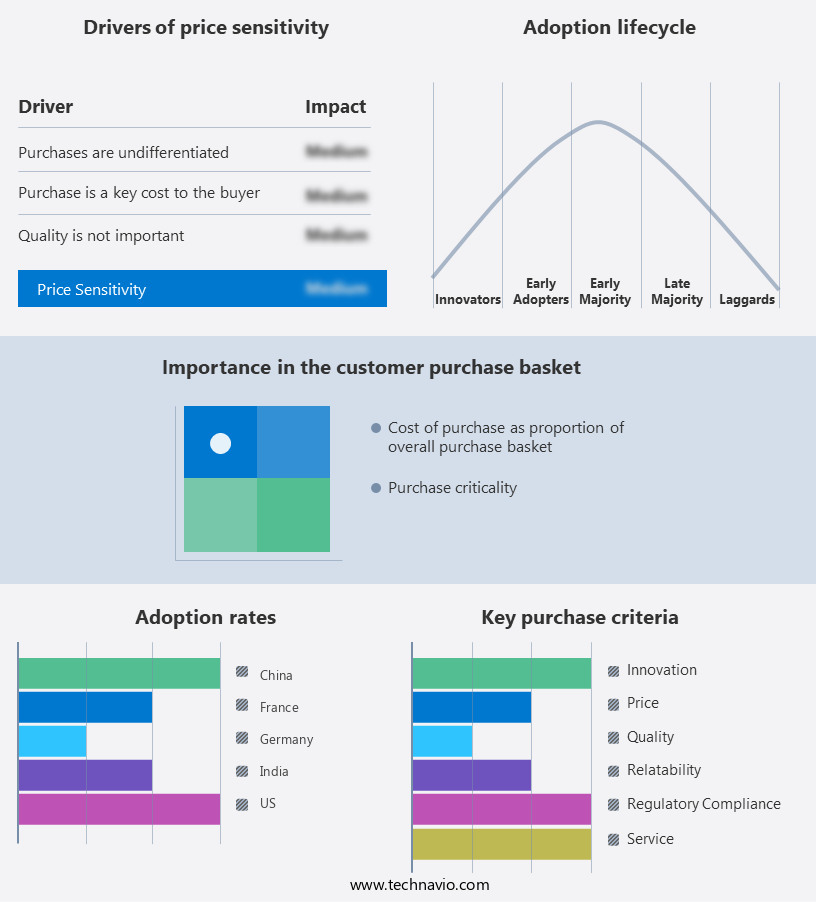
 Customer Landscape of Wheelchair Industry

Competitive Landscape & Market Insights

Companies are implementing various strategies, such as strategic alliances, wheelchair market forecast, partnerships, mergers and acquisitions, geographical expansion, and product/service launches, to enhance their presence in the industry.

21st Century Scientific Inc. - The company specializes in manufacturing and marketing wheelchairs under the brand name Bounder. Their product line caters to various user needs, focusing on durability, comfort, and functionality. The company's commitment to innovation and accessibility sets it apart in the mobility industry.

The industry research and growth report includes detailed analyses of the competitive landscape of the market and information about key companies, including:

  • 21st Century Scientific Inc.
  • Compass Health Brands
  • Etac AB
  • Forza Medi India Pvt. Ltd.
  • GF Health Products Inc.
  • Hoveround Corp.
  • Invacare Corp.
  • Karma Medical Products Co. Ltd.
  • Karman Healthcare Inc.
  • Ki Mobility
  • Magic Mobility Pty Ltd.
  • Medical Depot Inc.
  • Medline Industries LP
  • NOVA Medical Products
  • Ostrich Mobility Instruments Pvt. Ltd.
  • Ottobock SE and Co. KGaA
  • Permobil AB
  • Pride Mobility Products Corp.
  • Rainbow Care Pte Ltd.
  • Sunrise Medical LLC

Qualitative and quantitative analysis of companies has been conducted to help clients understand the wider business environment as well as the strengths and weaknesses of key industry players. Data is qualitatively analyzed to categorize companies as pure play, category-focused, industry-focused, and diversified; it is quantitatively analyzed to categorize companies as dominant, leading, strong, tentative, and weak.

Recent Development and News in Wheelchair Market

  • In January 2024, Medtronic plc, a leading medical technology company, announced the launch of its new powered wheelchair, the Solara Power Chair, featuring advanced features such as long-lasting batteries and enhanced maneuverability (Medtronic Press Release, 2024).
  • In March 2024, Permobil, a global mobility solutions provider, entered into a strategic partnership with Microsoft to integrate Microsoft's Azure IoT technology into their wheelchairs, enabling remote monitoring and predictive maintenance (Permobil Press Release, 2024).
  • In April 2024, Invacare Corporation, a global manufacturer and distributor of medical equipment, completed the acquisition of Sunrise Medical, a leading provider of complex rehabilitation and power wheelchairs, expanding its product portfolio and market reach (Invacare Press Release, 2024).
  • In May 2025, the European Union approved the new European Accessibility Act, mandating accessibility requirements for various products, including wheelchairs, to ensure equal access for people with disabilities (European Parliament Press Release, 2025).

Dive into Technavio's robust research methodology, blending expert interviews, extensive data synthesis, and validated models for unparalleled Wheelchair Market insights. See full methodology.

Market Scope

Report Coverage

Details

Page number

228

Base year

2024

Historic period

2019-2023

Forecast period

2025-2029

Growth momentum & CAGR

Accelerate at a CAGR of 9.3%

Market growth 2025-2029

USD 2294.4 million

Market structure

Fragmented

YoY growth 2024-2025(%)

8.7

Key countries

US, Canada, China, Germany, UK, Japan, India, France, Italy, and South Korea

Competitive landscape

Leading Companies, Market Positioning of Companies, Competitive Strategies, and Industry Risks

Request Free Sample

Research Analyst Overview

  • The market encompasses a diverse range of products and technologies, including passive mobility solutions like orthotic devices and mobility scooters, as well as active mobility options such as power wheelchairs and standing wheelchairs. This dynamic market is driven by advancements in material science, user interface design, and rehabilitation engineering. Lightweight wheelchairs, made from composite materials like carbon fiber and titanium alloys, have gained popularity due to their improved durability and ease of transport. Impact resistance and weight capacity are crucial considerations in the development of these products, with manufacturers continually pushing the boundaries to create stronger, lighter wheelchairs. In the realm of assistive technology, user interface design plays a significant role in enhancing the overall user experience.
  • Ergonomic design, tilt-in-space wheelchairs, and adaptive seating are just a few examples of how technology is being integrated to cater to the unique needs of users with mobility impairments. Safety features, such as fall prevention and wheelchair ramps, are also a focus in the market. Durability testing and fatigue testing are essential aspects of the design process, ensuring that wheelchairs meet the highest standards for safety and reliability. Wheelchair accessories, such as wheelchair lifts and cushion pressure relief systems, further expand the market's offerings. These add-ons cater to the diverse needs of users, enhancing functionality and comfort. The ongoing evolution of the market is a testament to the innovative spirit of manufacturers and the relentless pursuit of improving mobility solutions for individuals with mobility impairments.
  • The integration of advanced materials, user-centered design, and safety features continues to shape the landscape of this dynamic market.

What are the Key Data Covered in this Wheelchair Market Research and Growth Report?

  • What is the expected growth of the Wheelchair Market between 2025 and 2029?

    • USD 2.29 billion, at a CAGR of 9.3%

  • What segmentation does the market report cover?

    • The report segmented by Product (Manual wheelchair and Powered wheelchair), End-user (Personal, Hospitals, and Sports conditioning), Distribution Channel (Retail stores, E-commerce, and Hospital pharmacies), Age Group (Adults and Pediatrics), and Geography (North America, Europe, Asia, and Rest of World (ROW))

  • Which regions are analyzed in the report?

    • North America, Europe, Asia, and Rest of World (ROW)

  • What are the key growth drivers and market challenges?

    • Growing healthcare expenditure, High cost of mobility products

  • Who are the major players in the Wheelchair Market?

    • Key Companies 21st Century Scientific Inc., Compass Health Brands, Etac AB, Forza Medi India Pvt. Ltd., GF Health Products Inc., Hoveround Corp., Invacare Corp., Karma Medical Products Co. Ltd., Karman Healthcare Inc., Ki Mobility, Magic Mobility Pty Ltd., Medical Depot Inc., Medline Industries LP, NOVA Medical Products, Ostrich Mobility Instruments Pvt. Ltd., Ottobock SE and Co. KGaA, Permobil AB, Pride Mobility Products Corp., Rainbow Care Pte Ltd., and Sunrise Medical LLC

Market Research Insights

  • The market encompasses a diverse range of products and services, from manual chairs with joystick control and chin control options to custom, adjustable, and smart wheelchairs. According to industry estimates, The market size was valued at USD15 billion in 2020, with a projected CAGR of 5% from 2021 to 2026. Physical therapy and occupational therapy play integral roles in the market, ensuring ADA compliance and adherence to accessibility standards. Clinical trials and mobility assessments contribute to the development of advanced features, such as gait analysis, head array control, and sip-and-puff control. Wheelchair repair and motor maintenance services are essential for maintaining the functionality of these devices.
  • The market also includes folding, all-terrain, sports, and remote control wheelchairs, catering to various user needs and preferences. Inclusive design and universal design principles continue to shape the industry, ensuring that wheelchairs meet the evolving demands of users and society. Power chair batteries and motor maintenance are critical components of the market, ensuring the longevity and efficiency of these mobility solutions.

We can help! Our analysts can customize this wheelchair market research report to meet your requirements.

Get in touch

1 Executive Summary

  • 1.1 Market overview
    • Executive Summary - Chart on Market Overview
    • Executive Summary - Data Table on Market Overview
    • Executive Summary - Chart on Global Market Characteristics
    • Executive Summary - Chart on Market by Geography
    • Executive Summary - Chart on Market Segmentation by Product
    • Executive Summary - Chart on Market Segmentation by End-user
    • Executive Summary - Chart on Market Segmentation by Distribution Channel
    • Executive Summary - Chart on Market Segmentation by Age Group
    • Executive Summary - Chart on Incremental Growth
    • Executive Summary - Data Table on Incremental Growth
    • Executive Summary - Chart on Company Market Positioning

2 Technavio Analysis

  • 2.1 Analysis of price sensitivity, lifecycle, customer purchase basket, adoption rates, and purchase criteria
    • Analysis of price sensitivity, lifecycle, customer purchase basket, adoption rates, and purchase criteria
  • 2.2 Criticality of inputs and Factors of differentiation
    • Overview on criticality of inputs and factors of differentiation
  • 2.3 Factors of disruption
    • Overview on factors of disruption
  • 2.4 Impact of drivers and challenges
    • Impact of drivers and challenges in 2024 and 2029

3 Market Landscape

  • 3.1 Market ecosystem
    • Parent Market
    • Data Table on - Parent Market
  • 3.2 Market characteristics
    • Market characteristics analysis
  • 3.3 Value chain analysis
    • Value chain analysis

4 Market Sizing

  • 4.1 Market definition
    • Offerings of companies included in the market definition
  • 4.2 Market segment analysis
    • Market segments
  • 4.3 Market size 2024
    • 4.4 Market outlook: Forecast for 2024-2029
      • Chart on Global - Market size and forecast 2024-2029 ($ million)
      • Data Table on Global - Market size and forecast 2024-2029 ($ million)
      • Chart on Global Market: Year-over-year growth 2024-2029 (%)
      • Data Table on Global Market: Year-over-year growth 2024-2029 (%)

    5 Historic Market Size

    • 5.1 Global Wheelchair Market 2019 - 2023
      • Historic Market Size - Data Table on Global Wheelchair Market 2019 - 2023 ($ million)
    • 5.2 Product segment analysis 2019 - 2023
      • Historic Market Size - Product Segment 2019 - 2023 ($ million)
    • 5.3 End-user segment analysis 2019 - 2023
      • Historic Market Size - End-user Segment 2019 - 2023 ($ million)
    • 5.4 Distribution Channel segment analysis 2019 - 2023
      • Historic Market Size - Distribution Channel Segment 2019 - 2023 ($ million)
    • 5.5 Age Group segment analysis 2019 - 2023
      • Historic Market Size - Age Group Segment 2019 - 2023 ($ million)
    • 5.6 Geography segment analysis 2019 - 2023
      • Historic Market Size - Geography Segment 2019 - 2023 ($ million)
    • 5.7 Country segment analysis 2019 - 2023
      • Historic Market Size - Country Segment 2019 - 2023 ($ million)

    6 Qualitative Analysis

    • 6.1 Impact AI in the Global Wheelchair Market

      7 Five Forces Analysis

      • 7.1 Five forces summary
        • Five forces analysis - Comparison between 2024 and 2029
      • 7.2 Bargaining power of buyers
        • Bargaining power of buyers - Impact of key factors 2024 and 2029
      • 7.3 Bargaining power of suppliers
        • Bargaining power of suppliers - Impact of key factors in 2024 and 2029
      • 7.4 Threat of new entrants
        • Threat of new entrants - Impact of key factors in 2024 and 2029
      • 7.5 Threat of substitutes
        • Threat of substitutes - Impact of key factors in 2024 and 2029
      • 7.6 Threat of rivalry
        • Threat of rivalry - Impact of key factors in 2024 and 2029
      • 7.7 Market condition
        • Chart on Market condition - Five forces 2024 and 2029

      8 Market Segmentation by Product

      • 8.1 Market segments
        • Chart on Product - Market share 2024-2029 (%)
        • Data Table on Product - Market share 2024-2029 (%)
      • 8.2 Comparison by Product
        • Chart on Comparison by Product
        • Data Table on Comparison by Product
      • 8.3 Manual wheelchair - Market size and forecast 2024-2029
        • Chart on Manual wheelchair - Market size and forecast 2024-2029 ($ million)
        • Data Table on Manual wheelchair - Market size and forecast 2024-2029 ($ million)
        • Chart on Manual wheelchair - Year-over-year growth 2024-2029 (%)
        • Data Table on Manual wheelchair - Year-over-year growth 2024-2029 (%)
      • 8.4 Powered wheelchair - Market size and forecast 2024-2029
        • Chart on Powered wheelchair - Market size and forecast 2024-2029 ($ million)
        • Data Table on Powered wheelchair - Market size and forecast 2024-2029 ($ million)
        • Chart on Powered wheelchair - Year-over-year growth 2024-2029 (%)
        • Data Table on Powered wheelchair - Year-over-year growth 2024-2029 (%)
      • 8.5 Market opportunity by Product
        • Market opportunity by Product ($ million)
        • Data Table on Market opportunity by Product ($ million)

      9 Market Segmentation by End-user

      • 9.1 Market segments
        • Chart on End-user - Market share 2024-2029 (%)
        • Data Table on End-user - Market share 2024-2029 (%)
      • 9.2 Comparison by End-user
        • Chart on Comparison by End-user
        • Data Table on Comparison by End-user
      • 9.3 Personal - Market size and forecast 2024-2029
        • Chart on Personal - Market size and forecast 2024-2029 ($ million)
        • Data Table on Personal - Market size and forecast 2024-2029 ($ million)
        • Chart on Personal - Year-over-year growth 2024-2029 (%)
        • Data Table on Personal - Year-over-year growth 2024-2029 (%)
      • 9.4 Hospitals - Market size and forecast 2024-2029
        • Chart on Hospitals - Market size and forecast 2024-2029 ($ million)
        • Data Table on Hospitals - Market size and forecast 2024-2029 ($ million)
        • Chart on Hospitals - Year-over-year growth 2024-2029 (%)
        • Data Table on Hospitals - Year-over-year growth 2024-2029 (%)
      • 9.5 Sports conditioning - Market size and forecast 2024-2029
        • Chart on Sports conditioning - Market size and forecast 2024-2029 ($ million)
        • Data Table on Sports conditioning - Market size and forecast 2024-2029 ($ million)
        • Chart on Sports conditioning - Year-over-year growth 2024-2029 (%)
        • Data Table on Sports conditioning - Year-over-year growth 2024-2029 (%)
      • 9.6 Market opportunity by End-user
        • Market opportunity by End-user ($ million)
        • Data Table on Market opportunity by End-user ($ million)

      10 Market Segmentation by Distribution Channel

      • 10.1 Market segments
        • Chart on Distribution Channel - Market share 2024-2029 (%)
        • Data Table on Distribution Channel - Market share 2024-2029 (%)
      • 10.2 Comparison by Distribution Channel
        • Chart on Comparison by Distribution Channel
        • Data Table on Comparison by Distribution Channel
      • 10.3 Retail stores - Market size and forecast 2024-2029
        • Chart on Retail stores - Market size and forecast 2024-2029 ($ million)
        • Data Table on Retail stores - Market size and forecast 2024-2029 ($ million)
        • Chart on Retail stores - Year-over-year growth 2024-2029 (%)
        • Data Table on Retail stores - Year-over-year growth 2024-2029 (%)
      • 10.4 E-commerce - Market size and forecast 2024-2029
        • Chart on E-commerce - Market size and forecast 2024-2029 ($ million)
        • Data Table on E-commerce - Market size and forecast 2024-2029 ($ million)
        • Chart on E-commerce - Year-over-year growth 2024-2029 (%)
        • Data Table on E-commerce - Year-over-year growth 2024-2029 (%)
      • 10.5 Hospital pharmacies - Market size and forecast 2024-2029
        • Chart on Hospital pharmacies - Market size and forecast 2024-2029 ($ million)
        • Data Table on Hospital pharmacies - Market size and forecast 2024-2029 ($ million)
        • Chart on Hospital pharmacies - Year-over-year growth 2024-2029 (%)
        • Data Table on Hospital pharmacies - Year-over-year growth 2024-2029 (%)
      • 10.6 Market opportunity by Distribution Channel
        • Market opportunity by Distribution Channel ($ million)
        • Data Table on Market opportunity by Distribution Channel ($ million)

      11 Market Segmentation by Age Group

      • 11.1 Market segments
        • Chart on Age Group - Market share 2024-2029 (%)
        • Data Table on Age Group - Market share 2024-2029 (%)
      • 11.2 Comparison by Age Group
        • Chart on Comparison by Age Group
        • Data Table on Comparison by Age Group
      • 11.3 Adults - Market size and forecast 2024-2029
        • Chart on Adults - Market size and forecast 2024-2029 ($ million)
        • Data Table on Adults - Market size and forecast 2024-2029 ($ million)
        • Chart on Adults - Year-over-year growth 2024-2029 (%)
        • Data Table on Adults - Year-over-year growth 2024-2029 (%)
      • 11.4 Pediatrics - Market size and forecast 2024-2029
        • Chart on Pediatrics - Market size and forecast 2024-2029 ($ million)
        • Data Table on Pediatrics - Market size and forecast 2024-2029 ($ million)
        • Chart on Pediatrics - Year-over-year growth 2024-2029 (%)
        • Data Table on Pediatrics - Year-over-year growth 2024-2029 (%)
      • 11.5 Market opportunity by Age Group
        • Market opportunity by Age Group ($ million)
        • Data Table on Market opportunity by Age Group ($ million)

      12 Customer Landscape

      • 12.1 Customer landscape overview
        • Analysis of price sensitivity, lifecycle, customer purchase basket, adoption rates, and purchase criteria

      13 Geographic Landscape

      • 13.1 Geographic segmentation
        • Chart on Market share by geography 2024-2029 (%)
        • Data Table on Market share by geography 2024-2029 (%)
      • 13.2 Geographic comparison
        • Chart on Geographic comparison
        • Data Table on Geographic comparison
      • 13.3 North America - Market size and forecast 2024-2029
        • Chart on North America - Market size and forecast 2024-2029 ($ million)
        • Data Table on North America - Market size and forecast 2024-2029 ($ million)
        • Chart on North America - Year-over-year growth 2024-2029 (%)
        • Data Table on North America - Year-over-year growth 2024-2029 (%)
      • 13.4 Europe - Market size and forecast 2024-2029
        • Chart on Europe - Market size and forecast 2024-2029 ($ million)
        • Data Table on Europe - Market size and forecast 2024-2029 ($ million)
        • Chart on Europe - Year-over-year growth 2024-2029 (%)
        • Data Table on Europe - Year-over-year growth 2024-2029 (%)
      • 13.5 Asia - Market size and forecast 2024-2029
        • Chart on Asia - Market size and forecast 2024-2029 ($ million)
        • Data Table on Asia - Market size and forecast 2024-2029 ($ million)
        • Chart on Asia - Year-over-year growth 2024-2029 (%)
        • Data Table on Asia - Year-over-year growth 2024-2029 (%)
      • 13.6 Rest of World (ROW) - Market size and forecast 2024-2029
        • Chart on Rest of World (ROW) - Market size and forecast 2024-2029 ($ million)
        • Data Table on Rest of World (ROW) - Market size and forecast 2024-2029 ($ million)
        • Chart on Rest of World (ROW) - Year-over-year growth 2024-2029 (%)
        • Data Table on Rest of World (ROW) - Year-over-year growth 2024-2029 (%)
      • 13.7 US - Market size and forecast 2024-2029
        • Chart on US - Market size and forecast 2024-2029 ($ million)
        • Data Table on US - Market size and forecast 2024-2029 ($ million)
        • Chart on US - Year-over-year growth 2024-2029 (%)
        • Data Table on US - Year-over-year growth 2024-2029 (%)
      • 13.8 China - Market size and forecast 2024-2029
        • Chart on China - Market size and forecast 2024-2029 ($ million)
        • Data Table on China - Market size and forecast 2024-2029 ($ million)
        • Chart on China - Year-over-year growth 2024-2029 (%)
        • Data Table on China - Year-over-year growth 2024-2029 (%)
      • 13.9 Canada - Market size and forecast 2024-2029
        • Chart on Canada - Market size and forecast 2024-2029 ($ million)
        • Data Table on Canada - Market size and forecast 2024-2029 ($ million)
        • Chart on Canada - Year-over-year growth 2024-2029 (%)
        • Data Table on Canada - Year-over-year growth 2024-2029 (%)
      • 13.10 Germany - Market size and forecast 2024-2029
        • Chart on Germany - Market size and forecast 2024-2029 ($ million)
        • Data Table on Germany - Market size and forecast 2024-2029 ($ million)
        • Chart on Germany - Year-over-year growth 2024-2029 (%)
        • Data Table on Germany - Year-over-year growth 2024-2029 (%)
      • 13.11 UK - Market size and forecast 2024-2029
        • Chart on UK - Market size and forecast 2024-2029 ($ million)
        • Data Table on UK - Market size and forecast 2024-2029 ($ million)
        • Chart on UK - Year-over-year growth 2024-2029 (%)
        • Data Table on UK - Year-over-year growth 2024-2029 (%)
      • 13.12 Japan - Market size and forecast 2024-2029
        • Chart on Japan - Market size and forecast 2024-2029 ($ million)
        • Data Table on Japan - Market size and forecast 2024-2029 ($ million)
        • Chart on Japan - Year-over-year growth 2024-2029 (%)
        • Data Table on Japan - Year-over-year growth 2024-2029 (%)
      • 13.13 India - Market size and forecast 2024-2029
        • Chart on India - Market size and forecast 2024-2029 ($ million)
        • Data Table on India - Market size and forecast 2024-2029 ($ million)
        • Chart on India - Year-over-year growth 2024-2029 (%)
        • Data Table on India - Year-over-year growth 2024-2029 (%)
      • 13.14 France - Market size and forecast 2024-2029
        • Chart on France - Market size and forecast 2024-2029 ($ million)
        • Data Table on France - Market size and forecast 2024-2029 ($ million)
        • Chart on France - Year-over-year growth 2024-2029 (%)
        • Data Table on France - Year-over-year growth 2024-2029 (%)
      • 13.15 Italy - Market size and forecast 2024-2029
        • Chart on Italy - Market size and forecast 2024-2029 ($ million)
        • Data Table on Italy - Market size and forecast 2024-2029 ($ million)
        • Chart on Italy - Year-over-year growth 2024-2029 (%)
        • Data Table on Italy - Year-over-year growth 2024-2029 (%)
      • 13.16 South Korea - Market size and forecast 2024-2029
        • Chart on South Korea - Market size and forecast 2024-2029 ($ million)
        • Data Table on South Korea - Market size and forecast 2024-2029 ($ million)
        • Chart on South Korea - Year-over-year growth 2024-2029 (%)
        • Data Table on South Korea - Year-over-year growth 2024-2029 (%)
      • 13.17 Market opportunity by geography
        • Market opportunity by geography ($ million)
        • Data Tables on Market opportunity by geography ($ million)

      14 Drivers, Challenges, and Opportunity/Restraints

      • 14.1 Market drivers
        • 14.2 Market challenges
          • 14.3 Impact of drivers and challenges
            • Impact of drivers and challenges in 2024 and 2029
          • 14.4 Market opportunities/restraints

            15 Competitive Landscape

            • 15.1 Overview
              • 15.2 Competitive Landscape
                • Overview on criticality of inputs and factors of differentiation
              • 15.3 Landscape disruption
                • Overview on factors of disruption
              • 15.4 Industry risks
                • Impact of key risks on business

              16 Competitive Analysis

              • 16.1 Companies profiled
                • Companies covered
              • 16.2 Company ranking index
                • Company ranking index
              • 16.3 Market positioning of companies
                • Matrix on companies position and classification
              • 21st Century Scientific Inc.
                • 21st Century Scientific Inc. - Overview
                • 21st Century Scientific Inc. - Product / Service
                • 21st Century Scientific Inc. - Key offerings
                • SWOT
              • 16.5 Compass Health Brands
                • Compass Health Brands - Overview
                • Compass Health Brands - Product / Service
                • Compass Health Brands - Key offerings
                • SWOT
              • 16.6 Etac AB
                • Etac AB - Overview
                • Etac AB - Product / Service
                • Etac AB - Key offerings
                • SWOT
              • 16.7 Forza Medi India Pvt. Ltd.
                • Forza Medi India Pvt. Ltd. - Overview
                • Forza Medi India Pvt. Ltd. - Product / Service
                • Forza Medi India Pvt. Ltd. - Key offerings
                • SWOT
              • 16.8 GF Health Products Inc.
                • GF Health Products Inc. - Overview
                • GF Health Products Inc. - Product / Service
                • GF Health Products Inc. - Key offerings
                • SWOT
              • 16.9 Hoveround Corp.
                • Hoveround Corp. - Overview
                • Hoveround Corp. - Product / Service
                • Hoveround Corp. - Key offerings
                • SWOT
              • 16.10 Invacare Corp.
                • Invacare Corp. - Overview
                • Invacare Corp. - Business segments
                • Invacare Corp. - Key news
                • Invacare Corp. - Key offerings
                • Invacare Corp. - Segment focus
                • SWOT
              • 16.11 Karma Medical Products Co. Ltd.
                • Karma Medical Products Co. Ltd. - Overview
                • Karma Medical Products Co. Ltd. - Product / Service
                • Karma Medical Products Co. Ltd. - Key offerings
                • SWOT
              • 16.12 Karman Healthcare Inc.
                • Karman Healthcare Inc. - Overview
                • Karman Healthcare Inc. - Product / Service
                • Karman Healthcare Inc. - Key offerings
                • SWOT
              • 16.13 Ki Mobility
                • Ki Mobility - Overview
                • Ki Mobility - Product / Service
                • Ki Mobility - Key offerings
                • SWOT
              • 16.14 Medical Depot Inc.
                • Medical Depot Inc. - Overview
                • Medical Depot Inc. - Product / Service
                • Medical Depot Inc. - Key offerings
                • SWOT
              • 16.15 Ottobock SE and Co. KGaA
                • Ottobock SE and Co. KGaA - Overview
                • Ottobock SE and Co. KGaA - Product / Service
                • Ottobock SE and Co. KGaA - Key offerings
                • SWOT
              • 16.16 Permobil AB
                • Permobil AB - Overview
                • Permobil AB - Product / Service
                • Permobil AB - Key news
                • Permobil AB - Key offerings
                • SWOT
              • 16.17 Pride Mobility Products Corp.
                • Pride Mobility Products Corp. - Overview
                • Pride Mobility Products Corp. - Product / Service
                • Pride Mobility Products Corp. - Key offerings
                • SWOT
              • 16.18 Sunrise Medical LLC
                • Sunrise Medical LLC - Overview
                • Sunrise Medical LLC - Product / Service
                • Sunrise Medical LLC - Key offerings
                • SWOT

              17 Appendix

              • 17.1 Scope of the report
                • 17.2 Inclusions and exclusions checklist
                  • Inclusions checklist
                  • Exclusions checklist
                • 17.3 Currency conversion rates for US$
                  • Currency conversion rates for US$
                • 17.4 Research methodology
                  • Research methodology
                • 17.5 Data procurement
                  • Information sources
                • 17.6 Data validation
                  • Data validation
                • 17.7 Validation techniques employed for market sizing
                  • Validation techniques employed for market sizing
                • 17.8 Data synthesis
                  • Data synthesis
                • 17.9 360 degree market analysis
                  • 360 degree market analysis
                • 17.10 List of abbreviations
                  • List of abbreviations

                Research Methodology

                Technavio presents a detailed picture of the market by way of study, synthesis, and summation of data from multiple sources. The analysts have presented the various facets of the market with a particular focus on identifying the key industry influencers. The data thus presented is comprehensive, reliable, and the result of extensive research, both primary and secondary.

                INFORMATION SOURCES

                Primary sources

                • Manufacturers and suppliers
                • Channel partners
                • Industry experts
                • Strategic decision makers

                Secondary sources

                • Industry journals and periodicals
                • Government data
                • Financial reports of key industry players
                • Historical data
                • Press releases

                DATA ANALYSIS

                Data Synthesis

                • Collation of data
                • Estimation of key figures
                • Analysis of derived insights

                Data Validation

                • Triangulation with data models
                • Reference against proprietary databases
                • Corroboration with industry experts

                REPORT WRITING

                Qualitative

                • Market drivers
                • Market challenges
                • Market trends
                • Five forces analysis

                Quantitative

                • Market size and forecast
                • Market segmentation
                • Geographical insights
                • Competitive landscape

                Interested in this report?

                Get your sample now to see our research methodology and insights!

                Download Now

                Frequently Asked Questions

                Wheelchair market growth will increase by $ 2294.4 mn during 2025-2029.

                The Wheelchair market is expected to grow at a CAGR of 9.3% during 2025-2029.

                Wheelchair market is segmented by Product( Manual wheelchair, Powered wheelchair) End-user( Personal, Hospitals, Sports conditioning, Rest of World (ROW)) Distribution Channel( Retail stores, E-commerce, Hospital pharmacies, Rest of World (ROW))

                21st Century Scientific Inc., Compass Health Brands, Etac AB, Forza Medi India Pvt. Ltd., GF Health Products Inc., Hoveround Corp., Invacare Corp., Karma Medical Products Co. Ltd., Karman Healthcare Inc., Ki Mobility, Magic Mobility Pty Ltd., Medical Depot Inc., Medline Industries LP, NOVA Medical Products, Ostrich Mobility Instruments Pvt. Ltd., Ottobock SE and Co. KGaA, Permobil AB, Pride Mobility Products Corp., Rainbow Care Pte Ltd., Sunrise Medical LLC are a few of the key vendors in the Wheelchair market.

                Asia will register the highest growth rate of 36% among the other regions. Therefore, the Wheelchair market in Asia is expected to garner significant business opportunities for the vendors during the forecast period.

                US, Canada, China, Germany, UK, Japan, India, France, Italy, South Korea

                • Growing healthcare expenditureHealthcare expenditure includes medical expenses from diagnosis is the driving factor this market.
                • treatment is the driving factor this market.
                • and post-treatment facilities is the driving factor this market.
                • where the costs are borne by the patients is the driving factor this market.
                • and in some cases is the driving factor this market.
                • a part of the medical bill is reimbursed as per insurance coverage. Due to numerous factors is the driving factor this market.
                • such as increased disposable income is the driving factor this market.
                • suitable reimbursement policies is the driving factor this market.
                • and the availability of affordable healthcare facilities is the driving factor this market.
                • healthcare expenditure varies across the globe. As a result of these factors is the driving factor this market.
                • people in developed countries such as the US is the driving factor this market.
                • Canada is the driving factor this market.
                • the UK is the driving factor this market.
                • Germany is the driving factor this market.
                • and France are capable of spending more on healthcare is the driving factor this market.
                • enabling them to avail the of sophisticated patient care as well as home-care services. The increased number of patient care services supported by the high disposable income of people is driving the sales of sophisticated mobility products like manual and powered wheelchairs. However is the driving factor this market.
                • the trend of rapid adoption and increased sales of mobility products is absent in the markets of APAC and MEA owing to the low healthcare expenditure of people in these regions. Low disposable income is the driving factor this market.
                • limited access to healthcare services is the driving factor this market.
                • and unstructured healthcare reimbursement policies are limiting the sales of wheelchairs and other mobility aids in these regions. In recent years is the driving factor this market.
                • the market scenario has changed in MEA countries. The availability of government healthcare centers and access to affordable is the driving factor this market.
                • high-end healthcare facilities with reasonable medical expenses are increasing the healthcare budget of individuals. Furthermore is the driving factor this market.
                • in countries like India and China is the driving factor this market.
                • many NGOs help people with limited mobility in terms of reimbursements and improved patient care is the driving factor this market.
                • resulting in an increase in healthcare expenditure.These NGOs collaborate with the government to provide better healthcare by increasing the scope of reimbursements for mobility products like wheelchairs. These initiatives are helping people with limited mobility to get manual wheelchairs at a subsidized or discounted rate is the driving factor this market.
                • thereby increasing product penetration in these countries. Hence is the driving factor this market.
                • growing healthcare expenditure is driving the growth of the global wheelchair market during the forecast period. is the driving factor this market.

                The Wheelchair market vendors should focus on grabbing business opportunities from the Manual wheelchair segment as it accounted for the largest market share in the base year.