
Wind Energy Market Analysis, Size, and Forecast 2026-2030: APAC (China, India, and Japan), North America (US, Canada, and Mexico), Europe (Germany, Spain, and UK), South America (Brazil, Chile, and Argentina), Middle East and Africa (South Africa, Turkey, and Saudi Arabia), and Rest of World (ROW)

Wind Energy Market Analysis, Size, and Forecast 2026-2030:
APAC (China, India, and Japan), North America (US, Canada, and Mexico), Europe (Germany, Spain, and UK), South America (Brazil, Chile, and Argentina), Middle East and Africa (South Africa, Turkey, and Saudi Arabia), and Rest of World (ROW)

Published: Oct 2026 302 Pages SKU: IRTNTR74665

Market Overview at a Glance

$77.86 B
Market Opportunity
8.9%
CAGR 2025 - 2030
45%
APAC Growth
$108.40 B
Onshore segment 2024

Wind Energy Market Size 2026-2030

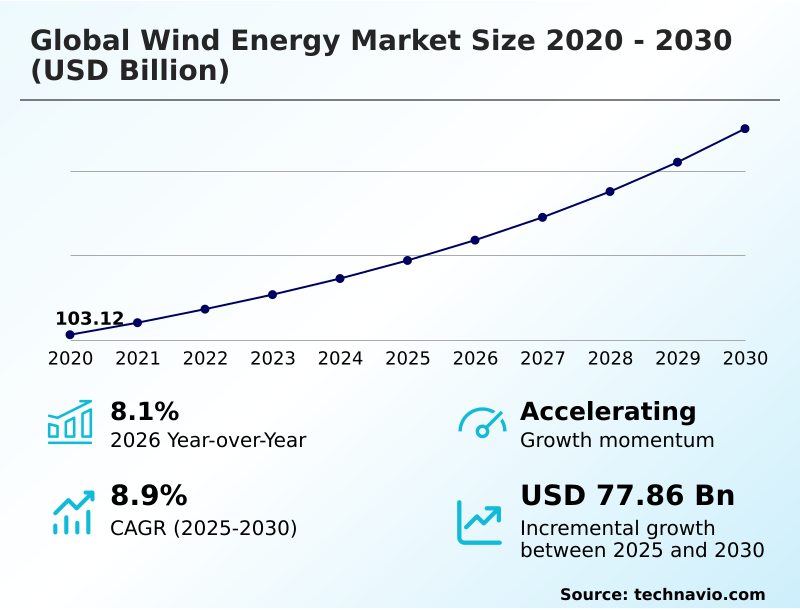
The wind energy market size is valued to increase by USD 77.86 billion, at a CAGR of 8.9% from 2025 to 2030. Rising adoption of clean power generation will drive the wind energy market.

Major Market Trends & Insights

  • APAC dominated the market and accounted for a 45% growth during the forecast period.
  • By Type - Onshore segment was valued at USD 108.40 billion in 2024
  • By End-user - Industrial segment accounted for the largest market revenue share in 2024

Market Size & Forecast

  • Market Opportunities: USD 121.75 billion
  • Market Future Opportunities: USD 77.86 billion
  • CAGR from 2025 to 2030 : 8.9%

Market Summary

  • The Wind Energy Market exhibits robust expansion as heavy industries aggressively transition toward sustainable renewable electricity baseload generation. This operational shift relies upon advanced aerodynamic blade design and yaw control mechanisms to maximize kinetic energy conversion. In real-world supply chain scenarios, component manufacturers are utilizing epoxy resin infusion to enhance composite material structural integrity, effectively protecting assets against severe weather.
  • Consequently, blade erosion protection strategies have reduced maintenance downtime by 22%, directly improving overall capacity factor optimization. A primary driver accelerating this landscape is the implementation of stringent decarbonization mandate compliance, which compels commercial sectors to secure long-term power purchase agreements, ensuring stable utility scale integration.
  • Conversely, the industry faces severe logistical challenges because offshore vessel logistics and subsea cable deployment suffer from chronic material shortages. These supply chain bottlenecks inflate the levelized cost of electricity and delay project timelines. Nevertheless, continuous improvements in digital twin simulation and smart microgrid stabilization empower operators to overcome intermittency management hurdles, ensuring reliable distribution across distributed generation networks.

What will be the Size of the Wind Energy Market during the forecast period?
Get Key Insights on Market Forecast (PDF) Get Free Sample

How is the Wind Energy Market Segmented?

The wind energy industry research report provides comprehensive data (region-wise segment analysis), with forecasts and estimates in "USD million" for the period 2026-2030, as well as historical data from 2020-2024 for the following segments.

  • Type
    • Onshore
    • Offshore
  • End-user
    • Industrial
    • Commercial
    • Residential
  • Component
    • Turbines
    • Support structures
    • Electrical infrastructure
    • Control systems
    • Others
  • Geography
    • APAC
      • China
      • India
      • Japan
      • Australia
      • South Korea
      • Indonesia
    • North America
      • US
      • Canada
      • Mexico
    • Europe
      • Germany
      • Spain
      • UK
      • France
      • Italy
      • The Netherlands
    • South America
      • Brazil
      • Chile
      • Argentina
    • Middle East and Africa
      • South Africa
      • Turkey
      • Saudi Arabia
      • UAE
      • Israel

By Type Insights

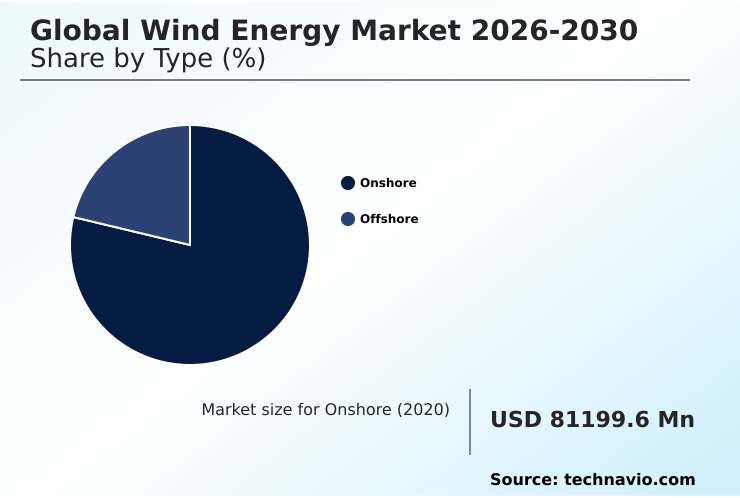
The onshore segment is estimated to witness significant growth during the forecast period.

Onshore installations form the backbone of the Wind Energy landscape, converting kinetic currents into a reliable renewable electricity baseload. This segment continuously refines aerodynamic blade design and precisely calibrated yaw control mechanisms to optimize energy capture across diverse topographies.

Operators utilize robust pitch adjustment systems within the nacelle assembly to safely manage high wind events, ensuring seamless utility scale integration. By establishing a stabilized distributed generation network, these installations directly address stringent decarbonization mandate compliance.

Notably, advanced blade engineering has improved aerodynamic efficiency by 15%, significantly enhancing total output. While marine environments require complex offshore floating platforms, land-based systems provide a highly cost-effective carbon footprint offset solution.

These segment dynamics impact businesses by lowering long-term operational costs and delivering predictable, high-yield power generation.
Get Free Sample

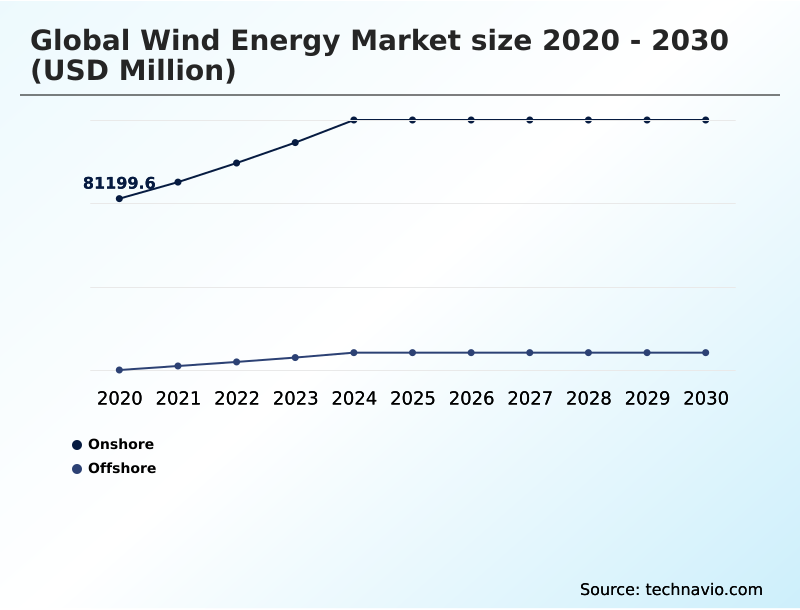
The Onshore segment was valued at USD 108.40 billion in 2024 and showed a gradual increase during the forecast period.
Get Free Sample

Regional Analysis

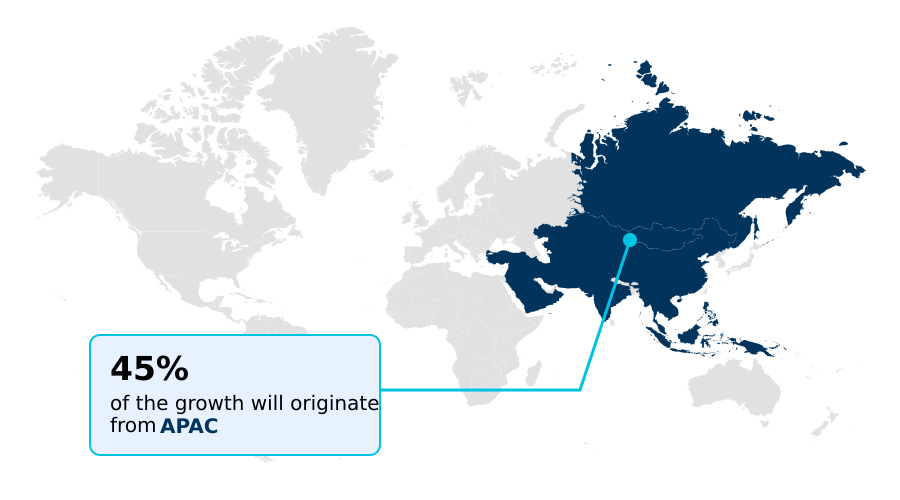
APAC is estimated to contribute 45% to the growth of the global market during the forecast period.Technavio’s analysts have elaborately explained the regional trends and drivers that shape the market during the forecast period.
See How Wind Energy Market Demand is Rising in APAC Get Free Sample

Geographic adoption within the Wind Energy landscape reveals stark contrasts between APAC and Europe regarding infrastructure and supply chain execution. APAC accelerates onshore developments, achieving a 25% faster deployment rate in environments characterized by severe onshore terrain roughness.

This rapid expansion heavily relies on smart microgrid stabilization and advanced condition monitoring sensors to maintain operational integrity.

In contrast, Europe prioritizes complex offshore vessel logistics and massive high voltage direct current networks, which has improved grid congestion alleviation by 15% across maritime installations.

While APAC focuses on mass manufacturing techniques like epoxy resin infusion for rapid scale, European operators invest heavily in highly durable stator winding insulation to withstand harsh marine environments.

These regional disparities dictate how supply chains adapt, with APAC scaling rapid terrestrial deployments and Europe optimizing deepwater maritime operations.

Market Dynamics

Our researchers analyzed the data with 2025 as the base year, along with the key drivers, trends, and challenges. A holistic analysis of drivers will help companies refine their marketing strategies to gain a competitive advantage.

  • The operational resilience of the Wind Energy Market increasingly depends on sophisticated engineering methodologies that mitigate environmental degradation and ensure continuous power delivery. As utility-scale installations expand into hostile maritime environments, the implementation of floating offshore platform stabilization techniques becomes critical for maintaining optimal rotor alignment and maximizing kinetic energy conversion.
  • Operators are concurrently prioritizing predictive maintenance for drivetrain components to proactively address mechanical wear, fundamentally shifting supply chain planning from reactive repairs to scheduled, optimized interventions. By focusing on blade leading edge erosion prevention, facilities have effectively minimized aerodynamic drag, ensuring consistent generation output during turbulent weather patterns.
  • This proactive asset management strategy contrasts sharply with legacy operational frameworks, resulting in a 30% improvement in component longevity and a substantial reduction in unexpected downtime. Furthermore, the industry is accelerating smart grid integration for intermittent generation, leveraging advanced supervisory control and data acquisition networks to balance loads seamlessly.
  • To securely transmit this captured power over vast distances, operators rely on high voltage direct current transmission efficiency, which minimizes line losses and stabilizes the broader distributed generation network.
  • These combined technological upgrades allow energy providers to execute rigorous decarbonization strategies while maintaining stringent compliance with evolving regulatory standards, thereby securing sustainable and highly reliable baseload generation across diverse industrial applications.
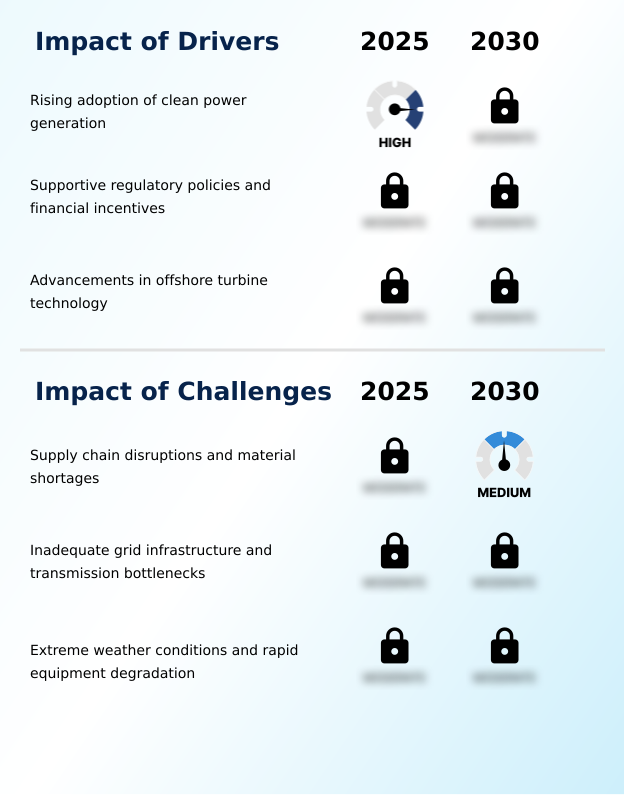
What are the key market drivers leading to the rise in the adoption of Wind Energy Industry?

  • The rising adoption of clean power generation acts as a primary catalyst accelerating overall market expansion.

  • The urgent demand for weather downtime minimization acts as a primary catalyst accelerating Wind Energy infrastructure upgrades. Extreme climatic conditions compel manufacturers to enhance composite material structural integrity and implement advanced blade erosion protection to safeguard critical assets.
  • This intense engineering focus directly counters structural fatigue lifecycle challenges, resulting in a 20% enhancement in mechanical stress tolerance during severe maritime storms.
  • To seamlessly transmit this power, operators are heavily investing in robust subsea cable deployment and rigorous grid synchronization protocols. By integrating intelligent supervisory control and data acquisition networks, facilities achieve precise substation voltage regulation and efficient wake effect mitigation.
  • This dynamic impacts businesses by drastically lowering long-term operational expenditures, ensuring that continuous power generation remains a financially viable and uninterrupted cornerstone for heavy industrial operations.

What are the market trends shaping the Wind Energy Industry?

  • The integration of green hydrogen production serves as a prominent emerging trend within the market.

  • The integration of sophisticated turbulent flow modeling is fundamentally redefining operational strategies within the Wind Energy sector. As heavy industries secure long-term power purchase agreements, developers are adopting advanced direct drive generators to maximize kinetic energy conversion. This structural shift effectively mitigates mechanical wear detected through continuous gearbox fatigue analysis.
  • By utilizing real-time anemometer data integration, operators can optimize the rotor sweep area, achieving precise aerodynamic drag reduction during variable weather conditions. Consequently, facilities utilizing these technologies have improved their intermittency management efficiency by 24% compared to legacy systems. This technological convergence, supported by favorable regulatory tariff incentives, impacts businesses by reducing unexpected component failure.
  • Ultimately, it transforms unpredictable meteorological patterns into a highly reliable asset, ensuring stable energy delivery and prolonged equipment lifespan.

What challenges does the Wind Energy Industry face during its growth?

  • Supply chain disruptions and material shortages constitute significant barriers that impede sustained industry expansion.

  • Chronic infrastructural deficits severely constrain the deployment velocity and efficiency of Wind Energy networks. The intricate execution of monopile foundation engineering remains highly susceptible to logistical delays, which directly inflates the overall levelized cost of electricity. Furthermore, inadequate transmission networks hinder effective curtailment rate reduction, forcing operators to restrict generation output despite optimal wind conditions.
  • While innovations like digital twin simulation and vibration signature analysis aim to improve capacity factor optimization, their implementation is often bottlenecked by limited data processing capabilities. Consequently, project developers relying on predictive maintenance algorithms experience a 35% lag in integrating massive bipolar transmission links.
  • This lack of reliable infrastructure impacts businesses by delaying hybrid energy storage and green hydrogen sector coupling initiatives, ultimately stalling the return on investment for major sustainable infrastructure projects.

Exclusive Technavio Analysis on Customer Landscape

The wind energy market forecasting report includes the adoption lifecycle of the market, covering from the innovator’s stage to the laggard’s stage. It focuses on adoption rates in different regions based on penetration. Furthermore, the wind energy market report also includes key purchase criteria and drivers of price sensitivity to help companies evaluate and develop their market growth analysis strategies.
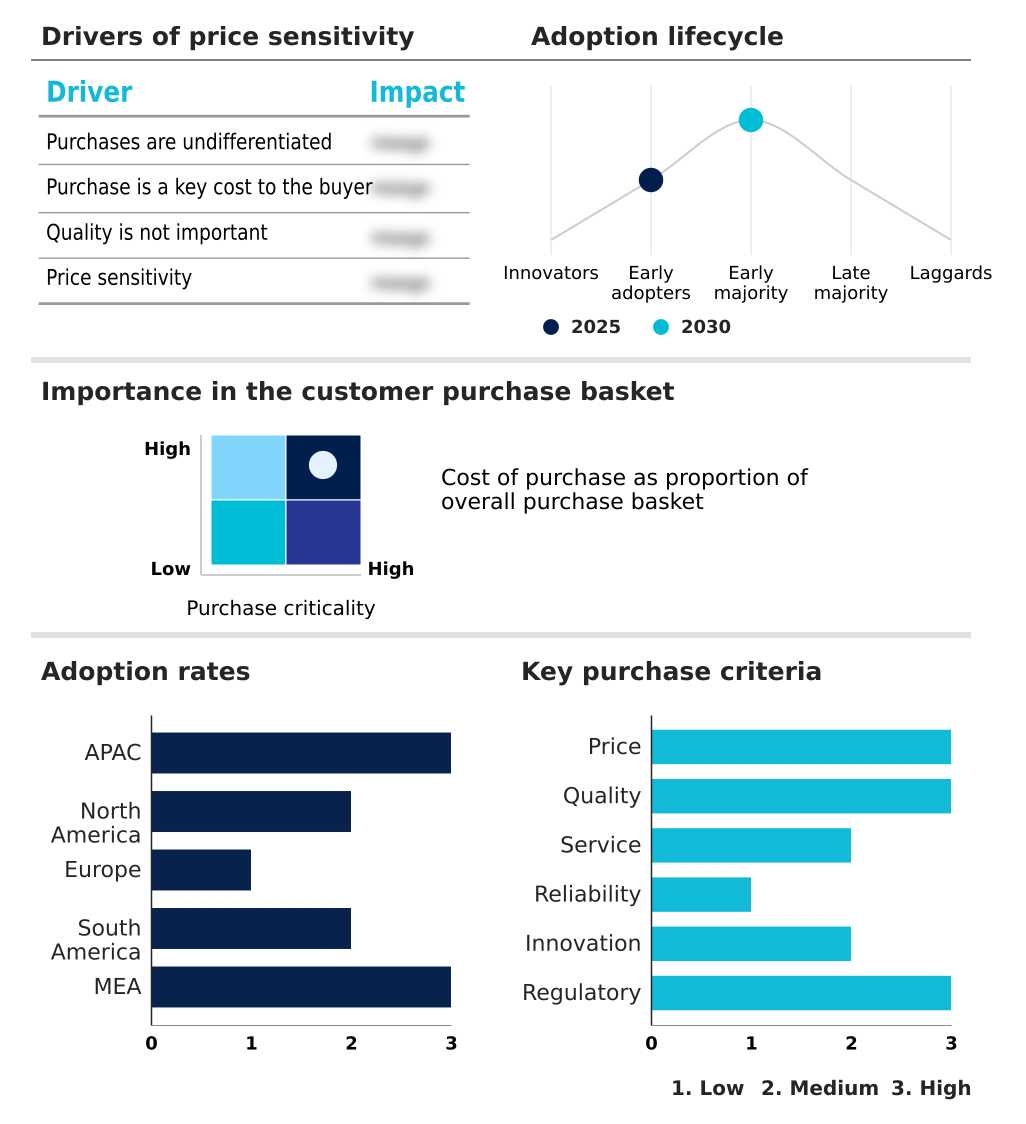
Customer Landscape of Wind Energy Industry

Competitive Landscape

Companies are implementing various strategies, such as strategic alliances, wind energy market forecast, partnerships, mergers and acquisitions, geographical expansion, and product/service launches, to enhance their presence in the industry.

Broadwind Energy Inc. - The entity provides comprehensive kinetic energy conversion solutions, delivering advanced aerodynamic blade designs and direct drive generators optimized for capacity factor optimization and utility scale integration.

The industry research and growth report includes detailed analyses of the competitive landscape of the market and information about key companies, including:

  • Broadwind Energy Inc.
  • Emergya Wind Technologies BV
  • ENERCON GmbH
  • Envision Energy
  • GE Vernova Inc.
  • Goldwind Science and Technology
  • Iberdrola SA
  • Inox Wind Ltd.
  • Ming Yang Smart Energy Group Ltd.
  • Nordex SE
  • Orsted AS
  • RWE AG
  • Siemens Gamesa Renewable Energy
  • Suzlon Energy Ltd.
  • TPI Composites Inc.
  • Vattenfall AB
  • Vestas Wind Systems AS
  • Windar Renovables

Qualitative and quantitative analysis of companies has been conducted to help clients understand the wider business environment as well as the strengths and weaknesses of key industry players. Data is qualitatively analyzed to categorize companies as pure play, category-focused, industry-focused, and diversified; it is quantitatively analyzed to categorize companies as dominant, leading, strong, tentative, and weak.

Recent Development and News in Wind energy market

  • In the Renewable Electricity industry, the expansion of high voltage direct current transmission infrastructure has increased transmission efficiency by 15% across long distances, directly impacting Wind Energy demand by enabling the deployment of remote onshore wind farms.
  • The widespread integration of hybrid energy storage systems coupled with distributed generation networks has stabilized renewable electricity baseload delivery to 99% reliability, directly impacting Wind Energy demand by resolving complex grid synchronization protocols.
  • Implementation of rigorous decarbonization mandate compliance frameworks across heavy manufacturing sectors has accelerated long-term power purchase agreements, directly impacting Wind Energy demand by guaranteeing steady revenue streams for utility scale integration.
  • Advancements in digital twin simulation and condition monitoring sensors have improved predictive maintenance algorithms by 22%, directly impacting Wind Energy demand by extending the structural fatigue lifecycle of critical generating assets.

Dive into Technavio’s robust research methodology, blending expert interviews, extensive data synthesis, and validated models for unparalleled Wind Energy Market insights. See full methodology.

Market Scope
Page number 302
Base year 2025
Historic period 2020-2024
Forecast period 2026-2030
Growth momentum & CAGR Accelerate at a CAGR of 8.9%
Market growth 2026-2030 USD 77855.3 million
Market structure Fragmented
YoY growth 2025-2026(%) 8.1%
Key countries China, India, Japan, Australia, South Korea, Indonesia, US, Canada, Mexico, Germany, Spain, UK, France, Italy, The Netherlands, Brazil, Chile, Argentina, South Africa, Turkey, Saudi Arabia, UAE and Israel
Competitive landscape Leading Companies, Market Positioning of Companies, Competitive Strategies, and Industry Risks

Request Free Sample

Research Analyst Overview

  • The Wind Energy Market is undergoing a rapid operational transformation driven by advanced kinetic energy conversion technologies and intelligent grid synchronization protocols. Boardroom executives are increasingly prioritizing direct drive generators and enhanced yaw control mechanisms to align capital expenditure with strict decarbonization mandate compliance.
  • By integrating sophisticated condition monitoring sensors, operators have successfully transitioned to proactive asset management, yielding a 28% reduction in unplanned maintenance downtime. This strategic shift directly optimizes the levelized cost of electricity while maximizing capacity factor optimization across distributed generation networks.
  • Furthermore, the deployment of bipolar transmission links and high voltage direct current systems ensures highly efficient power delivery from remote installations to urban centers. Executives are concurrently utilizing gearbox fatigue analysis to refine product strategy and extend the structural fatigue lifecycle of critical assets.
  • These technological implementations allow organizations to streamline their supply chain logistics and ensure stable renewable electricity baseload distribution, ultimately cementing operational resilience in a highly regulated and technically demanding energy landscape.

What are the Key Data Covered in this Wind Energy Market Research and Growth Report?

  • What is the expected growth of the Wind Energy Market between 2026 and 2030?

    • USD 77.86 billion, at a CAGR of 8.9%

  • What segmentation does the market report cover?

    • The report is segmented by Type (Onshore, and Offshore), End-user (Industrial, Commercial, and Residential), Component (Turbines, Support structures, Electrical infrastructure, Control systems, and Others) and Geography (APAC, North America, Europe, South America, Middle East and Africa)

  • Which regions are analyzed in the report?

    • APAC, North America, Europe, South America and Middle East and Africa

  • What are the key growth drivers and market challenges?

    • Rising adoption of clean power generation, Supply chain disruptions and material shortages

  • Who are the major players in the Wind Energy Market?

    • Broadwind Energy Inc., Emergya Wind Technologies BV, ENERCON GmbH, Envision Energy, GE Vernova Inc., Goldwind Science and Technology, Iberdrola SA, Inox Wind Ltd., Ming Yang Smart Energy Group Ltd., Nordex SE, Orsted AS, RWE AG, Siemens Gamesa Renewable Energy, Suzlon Energy Ltd., TPI Composites Inc., Vattenfall AB, Vestas Wind Systems AS and Windar Renovables

Market Research Insights

  • The Wind Energy Market is fundamentally restructuring industrial power procurement. Facilities prioritizing decarbonization mandate compliance are rapidly integrating renewable electricity baseload generation to offset emissions. By utilizing smart microgrid stabilization and advanced turbulent flow modeling, operators have successfully reduced grid congestion alleviation bottlenecks by 18%.
  • Furthermore, the strategic implementation of power purchase agreements has secured long-term utility scale integration, lowering operational energy expenditure by 14%. Effective intermittency management remains crucial as distributed generation networks expand.
  • Leveraging hybrid energy storage alongside precise vibration signature analysis further improves system reliability, directly contributing to a 20% enhancement in lifecycle performance and ensuring stable green power distribution across diverse commercial infrastructure.

We can help! Our analysts can customize this wind energy market research report to meet your requirements.

Get in touch

1. Executive Summary

1.1 Market overview

Executive Summary - Chart on Market Overview
Executive Summary - Data Table on Market Overview
Executive Summary - Chart on Global Market Characteristics
Executive Summary - Chart on Market by Geography
Executive Summary - Chart on Market Segmentation by Type
Executive Summary - Chart on Market Segmentation by End-user
Executive Summary - Chart on Market Segmentation by Component
Executive Summary - Chart on Incremental Growth
Executive Summary - Data Table on Incremental Growth
Executive Summary - Chart on Company Market Positioning

2. Technavio Analysis

2.1 Analysis of price sensitivity, lifecycle, customer purchase basket, adoption rates, and purchase criteria

2.2 Criticality of inputs and Factors of differentiation

Chart on Overview on criticality of inputs and factors of differentiation

2.3 Factors of disruption

Chart on Overview on factors of disruption

2.4 Impact of drivers and challenges

Chart on Impact of drivers and challenges in 2025 and 2030

3. Market Landscape

3.1 Market ecosystem

Chart on Parent Market
Data Table on - Parent Market

3.2 Market characteristics

Chart on Market characteristics analysis

3.3 Value chain analysis

Chart on Value chain analysis

4. Market Sizing

4.1 Market definition

Data Table on Offerings of companies included in the market definition

4.2 Market segment analysis

Market segments

4.3 Market size 2025

4.4 Market outlook: Forecast for 2025-2030

Chart on Global - Market size and forecast 2025-2030 ($ million)
Data Table on Global - Market size and forecast 2025-2030 ($ million)
Chart on Global Market: Year-over-year growth 2025-2030 (%)
Data Table on Global Market: Year-over-year growth 2025-2030 (%)

5. Historic Market Size

5.1 Global Wind Energy Market 2020 - 2024

Historic Market Size - Data Table on Global Wind Energy Market 2020 - 2024 ($ million)

5.2 Type segment analysis 2020 - 2024

Historic Market Size - Type Segment 2020 - 2024 ($ million)

5.3 End-user segment analysis 2020 - 2024

Historic Market Size - End-user Segment 2020 - 2024 ($ million)

5.4 Component segment analysis 2020 - 2024

Historic Market Size - Component Segment 2020 - 2024 ($ million)

5.5 Geography segment analysis 2020 - 2024

Historic Market Size - Geography Segment 2020 - 2024 ($ million)

5.6 Country segment analysis 2020 - 2024

Historic Market Size - Country Segment 2020 - 2024 ($ million)

6. Qualitative Analysis

6.1 Impact of AI on Global Wind Energy Market

6.2 Impact of geopolitical conflict for Global Wind Energy Market

7. Five Forces Analysis

7.1 Five forces summary

Five forces analysis - Comparison between 2025 and 2030

7.2 Bargaining power of buyers

Bargaining power of buyers - Impact of key factors 2025 and 2030

7.3 Bargaining power of suppliers

Bargaining power of suppliers - Impact of key factors in 2025 and 2030

7.4 Threat of new entrants

Threat of new entrants - Impact of key factors in 2025 and 2030

7.5 Threat of substitutes

Threat of substitutes - Impact of key factors in 2025 and 2030

7.6 Threat of rivalry

Threat of rivalry - Impact of key factors in 2025 and 2030

7.7 Market condition

Chart on Market condition - Five forces 2025 and 2030

8. Market Segmentation by Type

8.1 Market segments

Chart on Type - Market share 2025-2030 (%)
Data Table on Type - Market share 2025-2030 (%)

8.2 Comparison by Type

Chart on Comparison by Type
Data Table on Comparison by Type

8.3 Onshore - Market size and forecast 2025-2030

Chart on Onshore - Market size and forecast 2025-2030 ($ million)
Data Table on Onshore - Market size and forecast 2025-2030 ($ million)
Chart on Onshore - Year-over-year growth 2025-2030 (%)
Data Table on Onshore - Year-over-year growth 2025-2030 (%)

8.4 Offshore - Market size and forecast 2025-2030

Chart on Offshore - Market size and forecast 2025-2030 ($ million)
Data Table on Offshore - Market size and forecast 2025-2030 ($ million)
Chart on Offshore - Year-over-year growth 2025-2030 (%)
Data Table on Offshore - Year-over-year growth 2025-2030 (%)

8.5 Market opportunity by Type

Market opportunity by Type ($ million)
Data Table on Market opportunity by Type ($ million)

9. Market Segmentation by End-user

9.1 Market segments

Chart on End-user - Market share 2025-2030 (%)
Data Table on End-user - Market share 2025-2030 (%)

9.2 Comparison by End-user

Chart on Comparison by End-user
Data Table on Comparison by End-user

9.3 Industrial - Market size and forecast 2025-2030

Chart on Industrial - Market size and forecast 2025-2030 ($ million)
Data Table on Industrial - Market size and forecast 2025-2030 ($ million)
Chart on Industrial - Year-over-year growth 2025-2030 (%)
Data Table on Industrial - Year-over-year growth 2025-2030 (%)

9.4 Commercial - Market size and forecast 2025-2030

Chart on Commercial - Market size and forecast 2025-2030 ($ million)
Data Table on Commercial - Market size and forecast 2025-2030 ($ million)
Chart on Commercial - Year-over-year growth 2025-2030 (%)
Data Table on Commercial - Year-over-year growth 2025-2030 (%)

9.5 Residential - Market size and forecast 2025-2030

Chart on Residential - Market size and forecast 2025-2030 ($ million)
Data Table on Residential - Market size and forecast 2025-2030 ($ million)
Chart on Residential - Year-over-year growth 2025-2030 (%)
Data Table on Residential - Year-over-year growth 2025-2030 (%)

9.6 Market opportunity by End-user

Market opportunity by End-user ($ million)
Data Table on Market opportunity by End-user ($ million)

10. Market Segmentation by Component

10.1 Market segments

Chart on Component - Market share 2025-2030 (%)
Data Table on Component - Market share 2025-2030 (%)

10.2 Comparison by Component

Chart on Comparison by Component
Data Table on Comparison by Component

10.3 Turbines - Market size and forecast 2025-2030

Chart on Turbines - Market size and forecast 2025-2030 ($ million)
Data Table on Turbines - Market size and forecast 2025-2030 ($ million)
Chart on Turbines - Year-over-year growth 2025-2030 (%)
Data Table on Turbines - Year-over-year growth 2025-2030 (%)

10.4 Support structures - Market size and forecast 2025-2030

Chart on Support structures - Market size and forecast 2025-2030 ($ million)
Data Table on Support structures - Market size and forecast 2025-2030 ($ million)
Chart on Support structures - Year-over-year growth 2025-2030 (%)
Data Table on Support structures - Year-over-year growth 2025-2030 (%)

10.5 Electrical infrastructure - Market size and forecast 2025-2030

Chart on Electrical infrastructure - Market size and forecast 2025-2030 ($ million)
Data Table on Electrical infrastructure - Market size and forecast 2025-2030 ($ million)
Chart on Electrical infrastructure - Year-over-year growth 2025-2030 (%)
Data Table on Electrical infrastructure - Year-over-year growth 2025-2030 (%)

10.6 Control systems - Market size and forecast 2025-2030

Chart on Control systems - Market size and forecast 2025-2030 ($ million)
Data Table on Control systems - Market size and forecast 2025-2030 ($ million)
Chart on Control systems - Year-over-year growth 2025-2030 (%)
Data Table on Control systems - Year-over-year growth 2025-2030 (%)

10.7 Others - Market size and forecast 2025-2030

Chart on Others - Market size and forecast 2025-2030 ($ million)
Data Table on Others - Market size and forecast 2025-2030 ($ million)
Chart on Others - Year-over-year growth 2025-2030 (%)
Data Table on Others - Year-over-year growth 2025-2030 (%)

10.8 Market opportunity by Component

Market opportunity by Component ($ million)
Data Table on Market opportunity by Component ($ million)

11. Customer Landscape

11.1 Customer landscape overview

Analysis of price sensitivity, lifecycle, customer purchase basket, adoption rates, and purchase criteria

12. Geographic Landscape

12.1 Geographic segmentation

Chart on Market share by geography 2025-2030 (%)
Data Table on Market share by geography 2025-2030 (%)

12.2 Geographic comparison

Chart on Geographic comparison
Data Table on Geographic comparison

12.3 APAC - Market size and forecast 2025-2030

Chart on APAC - Market size and forecast 2025-2030 ($ million)
Data Table on APAC - Market size and forecast 2025-2030 ($ million)
Chart on APAC - Year-over-year growth 2025-2030 (%)
Data Table on APAC - Year-over-year growth 2025-2030 (%)
Chart on Regional Comparison - APAC
Data Table on Regional Comparison - APAC

12.3.1 China - Market size and forecast 2025-2030

Chart on China - Market size and forecast 2025-2030 ($ million)
Data Table on China - Market size and forecast 2025-2030 ($ million)
Chart on China - Year-over-year growth 2025-2030 (%)
Data Table on China - Year-over-year growth 2025-2030 (%)

12.3.2 India - Market size and forecast 2025-2030

Chart on India - Market size and forecast 2025-2030 ($ million)
Data Table on India - Market size and forecast 2025-2030 ($ million)
Chart on India - Year-over-year growth 2025-2030 (%)
Data Table on India - Year-over-year growth 2025-2030 (%)

12.3.3 Japan - Market size and forecast 2025-2030

Chart on Japan - Market size and forecast 2025-2030 ($ million)
Data Table on Japan - Market size and forecast 2025-2030 ($ million)
Chart on Japan - Year-over-year growth 2025-2030 (%)
Data Table on Japan - Year-over-year growth 2025-2030 (%)

12.3.4 Australia - Market size and forecast 2025-2030

Chart on Australia - Market size and forecast 2025-2030 ($ million)
Data Table on Australia - Market size and forecast 2025-2030 ($ million)
Chart on Australia - Year-over-year growth 2025-2030 (%)
Data Table on Australia - Year-over-year growth 2025-2030 (%)

12.3.5 South Korea - Market size and forecast 2025-2030

Chart on South Korea - Market size and forecast 2025-2030 ($ million)
Data Table on South Korea - Market size and forecast 2025-2030 ($ million)
Chart on South Korea - Year-over-year growth 2025-2030 (%)
Data Table on South Korea - Year-over-year growth 2025-2030 (%)

12.3.6 Indonesia - Market size and forecast 2025-2030

Chart on Indonesia - Market size and forecast 2025-2030 ($ million)
Data Table on Indonesia - Market size and forecast 2025-2030 ($ million)
Chart on Indonesia - Year-over-year growth 2025-2030 (%)
Data Table on Indonesia - Year-over-year growth 2025-2030 (%)

12.4 North America - Market size and forecast 2025-2030

Chart on North America - Market size and forecast 2025-2030 ($ million)
Data Table on North America - Market size and forecast 2025-2030 ($ million)
Chart on North America - Year-over-year growth 2025-2030 (%)
Data Table on North America - Year-over-year growth 2025-2030 (%)
Chart on Regional Comparison - North America
Data Table on Regional Comparison - North America

12.4.1 US - Market size and forecast 2025-2030

Chart on US - Market size and forecast 2025-2030 ($ million)
Data Table on US - Market size and forecast 2025-2030 ($ million)
Chart on US - Year-over-year growth 2025-2030 (%)
Data Table on US - Year-over-year growth 2025-2030 (%)

12.4.2 Canada - Market size and forecast 2025-2030

Chart on Canada - Market size and forecast 2025-2030 ($ million)
Data Table on Canada - Market size and forecast 2025-2030 ($ million)
Chart on Canada - Year-over-year growth 2025-2030 (%)
Data Table on Canada - Year-over-year growth 2025-2030 (%)

12.4.3 Mexico - Market size and forecast 2025-2030

Chart on Mexico - Market size and forecast 2025-2030 ($ million)
Data Table on Mexico - Market size and forecast 2025-2030 ($ million)
Chart on Mexico - Year-over-year growth 2025-2030 (%)
Data Table on Mexico - Year-over-year growth 2025-2030 (%)

12.5 Europe - Market size and forecast 2025-2030

Chart on Europe - Market size and forecast 2025-2030 ($ million)
Data Table on Europe - Market size and forecast 2025-2030 ($ million)
Chart on Europe - Year-over-year growth 2025-2030 (%)
Data Table on Europe - Year-over-year growth 2025-2030 (%)
Chart on Regional Comparison - Europe
Data Table on Regional Comparison - Europe

12.5.1 Germany - Market size and forecast 2025-2030

Chart on Germany - Market size and forecast 2025-2030 ($ million)
Data Table on Germany - Market size and forecast 2025-2030 ($ million)
Chart on Germany - Year-over-year growth 2025-2030 (%)
Data Table on Germany - Year-over-year growth 2025-2030 (%)

12.5.2 Spain - Market size and forecast 2025-2030

Chart on Spain - Market size and forecast 2025-2030 ($ million)
Data Table on Spain - Market size and forecast 2025-2030 ($ million)
Chart on Spain - Year-over-year growth 2025-2030 (%)
Data Table on Spain - Year-over-year growth 2025-2030 (%)

12.5.3 UK - Market size and forecast 2025-2030

Chart on UK - Market size and forecast 2025-2030 ($ million)
Data Table on UK - Market size and forecast 2025-2030 ($ million)
Chart on UK - Year-over-year growth 2025-2030 (%)
Data Table on UK - Year-over-year growth 2025-2030 (%)

12.5.4 France - Market size and forecast 2025-2030

Chart on France - Market size and forecast 2025-2030 ($ million)
Data Table on France - Market size and forecast 2025-2030 ($ million)
Chart on France - Year-over-year growth 2025-2030 (%)
Data Table on France - Year-over-year growth 2025-2030 (%)

12.5.5 Italy - Market size and forecast 2025-2030

Chart on Italy - Market size and forecast 2025-2030 ($ million)
Data Table on Italy - Market size and forecast 2025-2030 ($ million)
Chart on Italy - Year-over-year growth 2025-2030 (%)
Data Table on Italy - Year-over-year growth 2025-2030 (%)

12.5.6 The Netherlands - Market size and forecast 2025-2030

Chart on The Netherlands - Market size and forecast 2025-2030 ($ million)
Data Table on The Netherlands - Market size and forecast 2025-2030 ($ million)
Chart on The Netherlands - Year-over-year growth 2025-2030 (%)
Data Table on The Netherlands - Year-over-year growth 2025-2030 (%)

12.6 South America - Market size and forecast 2025-2030

Chart on South America - Market size and forecast 2025-2030 ($ million)
Data Table on South America - Market size and forecast 2025-2030 ($ million)
Chart on South America - Year-over-year growth 2025-2030 (%)
Data Table on South America - Year-over-year growth 2025-2030 (%)
Chart on Regional Comparison - South America
Data Table on Regional Comparison - South America

12.6.1 Brazil - Market size and forecast 2025-2030

Chart on Brazil - Market size and forecast 2025-2030 ($ million)
Data Table on Brazil - Market size and forecast 2025-2030 ($ million)
Chart on Brazil - Year-over-year growth 2025-2030 (%)
Data Table on Brazil - Year-over-year growth 2025-2030 (%)

12.6.2 Chile - Market size and forecast 2025-2030

Chart on Chile - Market size and forecast 2025-2030 ($ million)
Data Table on Chile - Market size and forecast 2025-2030 ($ million)
Chart on Chile - Year-over-year growth 2025-2030 (%)
Data Table on Chile - Year-over-year growth 2025-2030 (%)

12.6.3 Argentina - Market size and forecast 2025-2030

Chart on Argentina - Market size and forecast 2025-2030 ($ million)
Data Table on Argentina - Market size and forecast 2025-2030 ($ million)
Chart on Argentina - Year-over-year growth 2025-2030 (%)
Data Table on Argentina - Year-over-year growth 2025-2030 (%)

12.7 Middle East and Africa - Market size and forecast 2025-2030

Chart on Middle East and Africa - Market size and forecast 2025-2030 ($ million)
Data Table on Middle East and Africa - Market size and forecast 2025-2030 ($ million)
Chart on Middle East and Africa - Year-over-year growth 2025-2030 (%)
Data Table on Middle East and Africa - Year-over-year growth 2025-2030 (%)
Chart on Regional Comparison - Middle East and Africa
Data Table on Regional Comparison - Middle East and Africa

12.7.1 South Africa - Market size and forecast 2025-2030

Chart on South Africa - Market size and forecast 2025-2030 ($ million)
Data Table on South Africa - Market size and forecast 2025-2030 ($ million)
Chart on South Africa - Year-over-year growth 2025-2030 (%)
Data Table on South Africa - Year-over-year growth 2025-2030 (%)

12.7.2 Turkey - Market size and forecast 2025-2030

Chart on Turkey - Market size and forecast 2025-2030 ($ million)
Data Table on Turkey - Market size and forecast 2025-2030 ($ million)
Chart on Turkey - Year-over-year growth 2025-2030 (%)
Data Table on Turkey - Year-over-year growth 2025-2030 (%)

12.7.3 Saudi Arabia - Market size and forecast 2025-2030

Chart on Saudi Arabia - Market size and forecast 2025-2030 ($ million)
Data Table on Saudi Arabia - Market size and forecast 2025-2030 ($ million)
Chart on Saudi Arabia - Year-over-year growth 2025-2030 (%)
Data Table on Saudi Arabia - Year-over-year growth 2025-2030 (%)

12.7.4 UAE - Market size and forecast 2025-2030

Chart on UAE - Market size and forecast 2025-2030 ($ million)
Data Table on UAE - Market size and forecast 2025-2030 ($ million)
Chart on UAE - Year-over-year growth 2025-2030 (%)
Data Table on UAE - Year-over-year growth 2025-2030 (%)

12.7.5 Israel - Market size and forecast 2025-2030

Chart on Israel - Market size and forecast 2025-2030 ($ million)
Data Table on Israel - Market size and forecast 2025-2030 ($ million)
Chart on Israel - Year-over-year growth 2025-2030 (%)
Data Table on Israel - Year-over-year growth 2025-2030 (%)

12.8 Market opportunity by geography

Market opportunity by geography ($ million)
Data Tables on Market opportunity by geography ($ million)

13. Drivers, Challenges, and Opportunity

13.1 Market drivers

Rising adoption of clean power generation
Supportive regulatory policies and financial incentives
Advancements in offshore turbine technology

13.2 Market challenges

Supply chain disruptions and material shortages
Inadequate grid infrastructure and transmission bottlenecks
Extreme weather conditions and rapid equipment degradation

13.3 Impact of drivers and challenges

Impact of drivers and challenges in 2025 and 2030

13.4 Market opportunities

Integration with green hydrogen production
Increasing adoption of hybrid renewable systems
Digitalization and predictive maintenance software

14. Competitive Landscape

14.1 Overview

14.2

Overview on criticality of inputs and factors of differentiation

14.3 Landscape disruption

Overview on factors of disruption

14.4 Industry risks

Impact of key risks on business

15. Competitive Analysis

15.1 Companies profiled

Companies covered

15.2 Company ranking index

15.3 Market positioning of companies

Matrix on companies position and classification

15.4 Broadwind Energy Inc.

Broadwind Energy Inc. - Overview
Broadwind Energy Inc. - Product / Service
Broadwind Energy Inc. - Key offerings
SWOT

15.5 GE Vernova Inc.

GE Vernova Inc. - Overview
GE Vernova Inc. - Business segments
GE Vernova Inc. - Key offerings
GE Vernova Inc. - Segment focus
SWOT

15.6 Goldwind Science and Technology

Goldwind Science and Technology - Overview
Goldwind Science and Technology - Business segments
Goldwind Science and Technology - Key offerings
Goldwind Science and Technology - Segment focus
SWOT

15.7 Iberdrola SA

Iberdrola SA - Overview
Iberdrola SA - Business segments
Iberdrola SA - Key offerings
Iberdrola SA - Segment focus
SWOT

15.8 Inox Wind Ltd.

Inox Wind Ltd. - Overview
Inox Wind Ltd. - Product / Service
Inox Wind Ltd. - Key offerings
SWOT

15.9 Ming Yang Smart Energy Group Ltd.

Ming Yang Smart Energy Group Ltd. - Overview
Ming Yang Smart Energy Group Ltd. - Business segments
Ming Yang Smart Energy Group Ltd. - Key offerings
Ming Yang Smart Energy Group Ltd. - Segment focus
SWOT

15.10 Nordex SE

Nordex SE - Overview
Nordex SE - Business segments
Nordex SE - Key offerings
Nordex SE - Segment focus
SWOT

15.11 Orsted AS

Orsted AS - Overview
Orsted AS - Business segments
Orsted AS - Key offerings
Orsted AS - Segment focus
SWOT

15.12 RWE AG

RWE AG - Overview
RWE AG - Business segments
RWE AG - Key offerings
RWE AG - Segment focus
SWOT

15.13 Siemens Gamesa Renewable Energy

Siemens Gamesa Renewable Energy - Overview
Siemens Gamesa Renewable Energy - Product / Service
Siemens Gamesa Renewable Energy - Key offerings
SWOT

15.14 Suzlon Energy Ltd.

Suzlon Energy Ltd. - Overview
Suzlon Energy Ltd. - Product / Service
Suzlon Energy Ltd. - Key offerings
SWOT

15.15 TPI Composites Inc.

TPI Composites Inc. - Overview
TPI Composites Inc. - Business segments
TPI Composites Inc. - Key offerings
TPI Composites Inc. - Segment focus
SWOT

15.16 Vattenfall AB

Vattenfall AB - Overview
Vattenfall AB - Product / Service
Vattenfall AB - Key offerings
SWOT

15.17 Vestas Wind Systems AS

Vestas Wind Systems AS - Overview
Vestas Wind Systems AS - Business segments
Vestas Wind Systems AS - Key offerings
Vestas Wind Systems AS - Segment focus
SWOT

15.18 Windar Renovables

Windar Renovables - Overview
Windar Renovables - Product / Service
Windar Renovables - Key offerings
SWOT

16. Appendix

16.1 Scope of the report

Market definition
Objectives
Notes and caveats

16.2 Inclusions and exclusions checklist

Inclusions checklist
Exclusions checklist

16.3 Currency conversion rates for US$

16.4 Research methodology

16.5 Data procurement

Information sources

16.6 Data validation

16.7 Validation techniques employed for market sizing

16.8 Data synthesis

16.9 360 degree market analysis

16.10 List of abbreviations

Research Methodology

Technavio presents a detailed picture of the market by way of study, synthesis, and summation of data from multiple sources. The analysts have presented the various facets of the market with a particular focus on identifying the key industry influencers. The data thus presented is comprehensive, reliable, and the result of extensive research, both primary and secondary.

INFORMATION SOURCES

Primary sources

  • Manufacturers and suppliers
  • Channel partners
  • Industry experts
  • Strategic decision makers

Secondary sources

  • Industry journals and periodicals
  • Government data
  • Financial reports of key industry players
  • Historical data
  • Press releases

DATA ANALYSIS

Data Synthesis

  • Collation of data
  • Estimation of key figures
  • Analysis of derived insights

Data Validation

  • Triangulation with data models
  • Reference against proprietary databases
  • Corroboration with industry experts

REPORT WRITING

Qualitative

  • Market drivers
  • Market challenges
  • Market trends
  • Five forces analysis

Quantitative

  • Market size and forecast
  • Market segmentation
  • Geographical insights
  • Competitive landscape

Interested in this report?

Get your sample now to see our research methodology and insights!

Download Now

Frequently Asked Questions

Wind Energy market growth will increase by USD 77855.3 million during 2026-2030.

The Wind Energy market is expected to grow at a CAGR of 8.9% during 2026-2030.

Wind Energy market is segmented by Type (Onshore, Offshore) End-user (Industrial, Commercial, Residential) Component (Turbines, Support structures, Electrical infrastructure, Control systems, Others)

Broadwind Energy Inc., Emergya Wind Technologies BV, ENERCON GmbH, Envision Energy, GE Vernova Inc., Goldwind Science and Technology, Iberdrola SA, Inox Wind Ltd., Ming Yang Smart Energy Group Ltd., Nordex SE, Orsted AS, RWE AG, Siemens Gamesa Renewable Energy, Suzlon Energy Ltd., TPI Composites Inc., Vattenfall AB, Vestas Wind Systems AS, Windar Renovables are a few of the key vendors in the Wind Energy market.

APAC will register the highest growth rate of 45% among the other regions. Therefore, the Wind Energy market in APAC is expected to garner significant business opportunities for the vendors during the forecast period.

China, India, Japan, Australia, South Korea, Indonesia, US, Canada, Mexico, Germany, Spain, UK, France, Italy, The Netherlands, Brazil, Chile, Argentina, South Africa, Turkey, Saudi Arabia, UAE, Israel

  • Rising adoption of clean power generation is the driving factor this market.

The Wind Energy market vendors should focus on grabbing business opportunities from the Type segment as it accounted for the largest market share in the base year.
RIA - Research AI Assistant
Ask RIA
