Wind Turbine Composite Materials Market Size 2024-2028
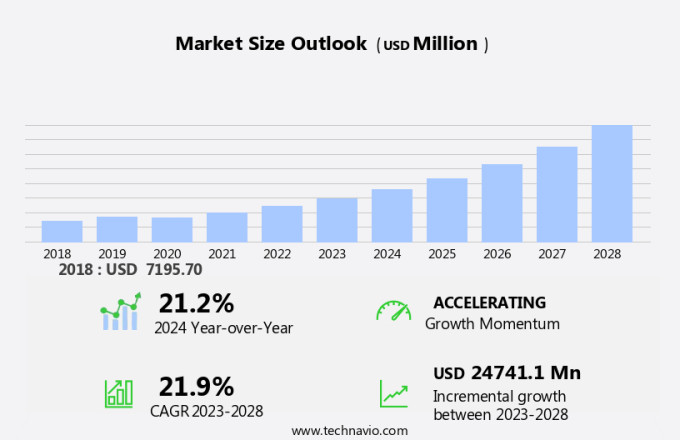
The wind turbine composite materials market size is forecast to increase by USD 24.74 billion at a CAGR of 21.9% between 2023 and 2028. The market is experiencing significant growth due to the advancement of solar-hydro hybrid power plants. Composite materials, including Aramid and Basalt fibers, are increasingly being used in wind turbine blades due to their superior strength-to-weight ratio and durability. However, the disposal of wind turbine blades poses a challenge, leading to a rising concern for recycling technologies. Thermoplastic and thermoset composites are popular choices for manufacturing wind turbine components through processes such as injection molding, compression molding, pultrusion, filament winding, and layup. These methods offer cost-effectiveness, efficiency, and flexibility in producing complex shapes. The market is expected to continue growing as the demand for renewable energy and clean energy sources increases and recycling technologies become more advanced.
What will be the Size of the Market During the Forecast Period?
The wind energy sector has gained significant traction in the United States as a sustainable and eco-friendly alternative to traditional fossil fuel-based energy sources. The increasing focus on energy security and sustainability, coupled with the circular economy concept, has led to the expansion of wind power generation. Among the critical components of wind turbines, composite materials play a pivotal role in enhancing wind turbine efficiency and reducing the overall weight of wind turbine structures. Composite materials, including carbon fiber, aramid fiber, basalt fiber, and various resins such as epoxy, polyester, vinyl ester, and polyurethane, are extensively used in the manufacturing of wind turbine components.
Moreover, these materials offer numerous advantages, such as a high strength-to-weight ratio, durability, and resistance to extreme weather conditions. Onshore wind capacity in the US has been growing steadily, with the demand for wind turbines and their components increasing accordingly. The use of composite materials in onshore wind turbines is predominantly focused on rotor blades, nacelles, and other structural parts. Lightweight components made from composite materials help reduce the overall weight of wind turbines, leading to lower transportation costs and easier installation. Offshore wind power is another promising area where composite materials are extensively used. The harsh marine environment necessitates the use of robust and durable materials for offshore wind turbines.
Composite materials, such as carbon fiber reinforced polymers (CFRP), are preferred for their high strength, corrosion resistance, and ability to withstand extreme weather conditions. The recyclability of composite materials is another crucial factor driving their adoption in the wind energy sector. As the industry moves towards a more sustainable and circular economy, the ability to recycle and reuse composite materials is becoming increasingly important. Research and development efforts are underway to develop effective methods for recycling composite materials, which will further boost their adoption in the wind energy sector. In conclusion, the composite materials market in the wind energy sector is expected to witness significant growth due to the increasing demand for wind power generation and the need for lightweight, durable, and recyclable materials for wind turbine components.
The use of composite materials, such as carbon fiber, aramid fiber, basalt fiber, and various resins, in wind turbines offers numerous advantages, including improved efficiency, reduced weight, and enhanced durability. As the wind energy sector continues to expand, the demand for composite materials is expected to grow, making it an attractive market for material suppliers and manufacturers.
Market Segmentation
The market research report provides comprehensive data (region-wise segment analysis), with forecasts and estimates in "USD million" for the period 2024-2028, as well as historical data from 2018-2022 for the following segments.
- Application
- Blades
- Nacelle
- Tower
- Others
- Material
- Fiberglass composites
- Carbonfiber composites
- Thermoplastic composites
- Others
- Geography
- Europe
- Germany
- UK
- France
- Spain
- Sweden
- North America
- US
- APAC
- China
- India
- Middle East and Africa
- South America
- Brazil
- Europe
By Application Insights
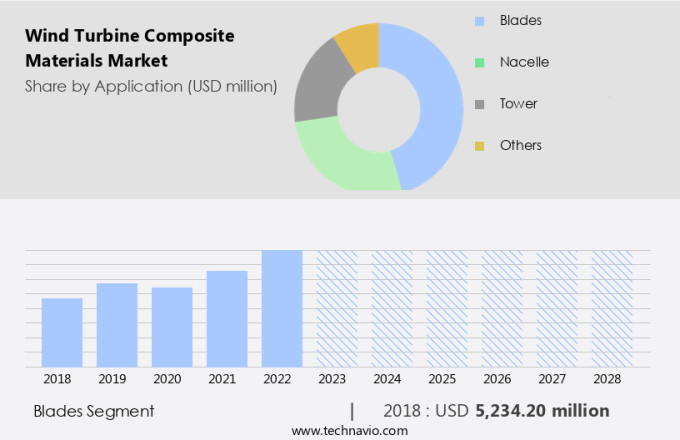
The blades segment is estimated to witness significant growth during the forecast period. The market is experiencing substantial growth, particularly in the production of wind turbine blades. With approximately 70,000 wind turbines in operation and projections indicating a significant expansion, the need for eco-friendly and efficient blade materials is crucial. By 2050, it is projected that over 2 million tons of wind turbine blade materials will be utilized in the U.S. Alone. Historically, wind turbine blades have been fabricated using resins derived from non-renewable resources, such as petroleum, which are energy-consuming to manufacture and difficult to recycle without compromising the material's integrity. In response, the industry is exploring sustainable alternatives to reduce carbon emissions and minimize waste.
Composite materials, such as those derived from high-strength, weather-resistant, and non-toxic materials, are gaining popularity for their durability and ability to withstand harsh weather conditions. Adhesives that ensure strong bonding between blade components are also essential.
Get a glance at the market share of various segments Request Free Sample
The Blades segment accounted for USD 5,234.20 million in 2018 and showed a gradual increase during the forecast period.
Regional Insights
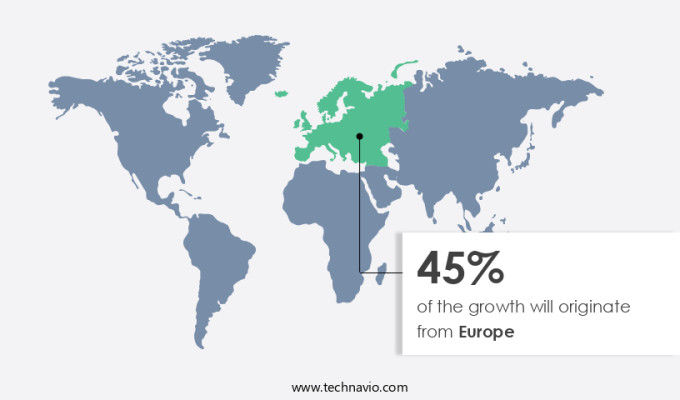
Europe is estimated to contribute 45% to the growth of the global market during the forecast period. Technavio's analysts have elaborately explained the regional trends and drivers that shape the market during the forecast period.
For more insights on the market share of various regions Request Free Sample
The market in Europe is experiencing significant growth and transformation, with a particular focus on the end-of-life management of wind farms. At the annual End of Life Issues and Strategies (EoLIS) event by WindEurope, industry experts discussed the importance of sustainable dismantling and disposal of old wind turbines. As Europe aims to double its wind energy capacity by 2030, repowering old wind farms is crucial for meeting climate and energy security goals. However, by 2030, Europe is projected to decommission more wind capacity than it repowers, with approximately 13 GW of existing capacity set to be decommissioned and only 9 GW of new, more efficient wind turbines anticipated to be installed.
Composite materials, such as carbon fiber, play a vital role in the production of wind turbine rotor blades, both for onshore and offshore wind power. The digital transformation of the wind energy sector is also driving innovation in the use of composite materials, improving efficiency and reducing the carbon footprint of wind power. Sustainability and the circular economy are key priorities in the wind energy industry, with a focus on reducing waste and maximizing the use of resources.
Our researchers analyzed the data with 2023 as the base year, along with the key drivers, trends, and challenges. A holistic analysis of drivers will help companies refine their marketing strategies to gain a competitive advantage.
Market Driver
Progress in solar-hydro hybrid plant development is the key driver of the market. The market is experiencing growth due to the increasing adoption of renewable energy sources, particularly in solar-hydro hybrid plants. One notable example is the Alqueva power plant in Portugal, which combines solar and hydro power. This European energy project, developed by EDP, showcases the potential of integrating different renewable energy production and storage technologies. The initiative, situated on Europe's largest artificial lake, serves as a testing ground for advanced composite materials like fiberglass reinforced plastics and eco-friendly alternatives, such as bio-based materials.
Moreover, the east-west orientation of the solar panels minimizes wind resistance, reducing the need for additional mooring lines and overall costs. The use of recyclable materials and eco-friendly composites in wind turbine manufacturing is a significant trend, contributing to the market's growth.
Market Trends
Advancements in recycling technologies for wind turbine blades is the upcoming trend in the market. The market is experiencing notable progress in recycling techniques, with a particular focus on wind turbine blades. In March 2024, researchers at the University of Maine received a USD 75,000 grant from the U.S. Department of Energy's Wind Energy Technologies Office to investigate innovative recycling methods. Led by the Advanced Structures and Composites Center (ASCC), this project, titled "Blades for Large-Format Additive Manufacturing," aims to recycle shredded wind turbine blade material as an affordable reinforcement and filler for large-scale 3D printing. This initiative marks a significant stride towards a circular wind energy economy. The team intends to replace short carbon fibers with shredded and milled wind blade material, pursuing mechanical recycling of 100% of the composite blade material.
Aramid fiber and basalt fiber, thermoplastic and thermoset composites, as well as manufacturing processes such as injection molding, compression molding, pultrusion, filament winding, and layup, are essential components of this industry's evolution. By adopting these advanced recycling solutions, the wind energy sector can minimize waste and reduce its environmental footprint.
Market Challenge
Rising concerns over wind turbine blade disposal is a key challenge affecting the market growth. The market is experiencing a pressing issue with the disposal of wind turbine components, particularly blades, which has emerged as an environmental dilemma. Approximately 800,000 tons of wind turbine blades, primarily made from fiberglass-reinforced polymer (FRP) and coated with durable epoxy resins, are disposed of in landfills each year. The epoxy coatings, essential for withstanding extreme weather conditions, hinder the recycling process due to their tenacious bond with the composite materials. The use of advanced technologies, such as digitalization and predictive analytics, can offer potential solutions to this challenge. These technologies can help optimize energy generation and identify potential issues before they become critical, reducing the need for blade replacements and subsequent disposal.
Furthermore, sustainability certifications play a crucial role in promoting the development and adoption of eco-friendly composite materials and recycling methods. Lightweight components, such as turbine blades, rotors, nacelles, wind propellers, and offshore wind energy structures, require robust and durable materials to ensure optimal performance and longevity. Structural parts, including turbine blades, are critical to the overall efficiency and effectiveness of wind energy systems. The industry's focus on utilizing high-performance composite materials, such as carbon fiber reinforced polymers (CFRP), can lead to lighter and stronger components, ultimately reducing the amount of waste generated during the disposal process. In conclusion, the market faces a significant challenge in addressing the disposal of wind turbine components, particularly blades.
Digitalization, predictive analytics, and sustainability certifications offer potential solutions to this issue. Additionally, the development and adoption of eco-friendly composite materials, such as CFRP, can lead to lighter and stronger components, reducing the amount of waste generated during the disposal process.
Exclusive Customer Landscape
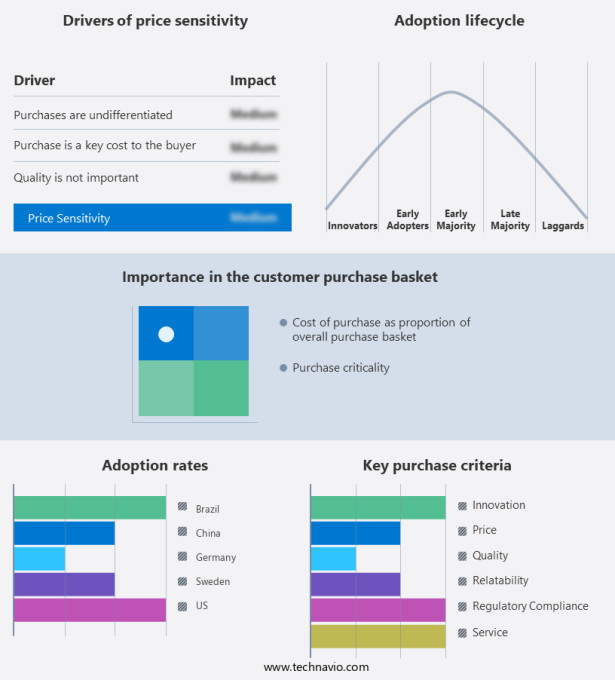
The market forecasting report includes the adoption lifecycle of the market, covering from the innovator's stage to the laggard's stage. It focuses on adoption rates in different regions based on penetration. Furthermore, the report also includes key purchase criteria and drivers of price sensitivity to help companies evaluate and develop their market growth analysis strategies.
Customer Landscape
Key Companies & Market Insights
Companies are implementing various strategies, such as strategic alliances, partnerships, mergers and acquisitions, geographical expansion, and product/service launches, to enhance their presence in the market.
AOC, LLC - The company specializes in producing high-performance composite materials, including carbon fiber-reinforced composites, polyesters, and resins, specifically designed for use in the wind energy industry in the United States.
The market research and growth report includes detailed analyses of the competitive landscape of the market and information about key companies, including:
- Arkema SA
- Covestro AG
- Exel Composites
- Gurit Holding AG
- Hexcel Corp.
- Huntsman Corp.
- Mitsubishi Chemical Corp.
- Nordex SE
- Owens Corning
- SGL Carbon SE
- Solvay SA
- TEIJIN Ltd
- Toray Industries Inc.
- TPI Composites Inc.
Qualitative and quantitative analysis of companies has been conducted to help clients understand the wider business environment as well as the strengths and weaknesses of key market players. Data is qualitatively analyzed to categorize companies as pure play, category-focused, industry-focused, and diversified; it is quantitatively analyzed to categorize companies as dominant, leading, strong, tentative, and weak.
Research Analyst Overview
The market is witnessing significant growth due to the increasing demand for renewable energy sources and the shift towards green energy. Wind power, as a key contributor to the global energy mix, is playing a crucial role in energy security and sustainability. Composite materials, including carbon fiber, fiberglass reinforced plastics, and advanced composites, are extensively used in the manufacturing of wind turbine components such as rotor blades, nacelles, hubs, and towers. The digital transformation in the wind energy sector is driving the adoption of composite materials. Digitalization, predictive analytics, and sustainability certifications are becoming essential for wind energy production.
The use of e-commerce platforms and recyclable materials, bio-based alternatives, and eco-friendly materials is gaining popularity. Manufacturing localization is another trend influencing the market. Local manufacturing of wind turbine components using recyclable materials, such as glass fiber, aramid fiber, basalt fiber, and thermoplastic composites, is reducing transportation costs and carbon footprint. The mechanical properties of composite materials, including high strength, durability, and weather resistance, make them ideal for wind turbine components. Adhesion, non-toxicity, and resistance to fungal growth and marine fouling are essential properties for wind turbine components. The use of lightweight materials, such as epoxy, polyester, vinyl ester, polyurethane, and vacuum injection molding, is increasing wind turbine efficiency while reducing greenhouse gas emissions.
Environmental regulations are driving the demand for wind energy and the use of lightweight and recyclable materials in wind turbine manufacturing. Composite materials are expected to continue playing a significant role in the wind energy sector due to their superior mechanical properties and environmental benefits.
|
Market Scope |
|
|
Report Coverage |
Details |
|
Page number |
221 |
|
Base year |
2023 |
|
Historic period |
2018-2022 |
|
Forecast period |
2024-2028 |
|
Growth momentum & CAGR |
Accelerate at a CAGR of 21.9% |
|
Market growth 2024-2028 |
USD 24.74 billion |
|
Market structure |
Fragmented |
|
YoY growth 2023-2024(%) |
21.2 |
|
Regional analysis |
Europe, North America, APAC, Middle East and Africa, and South America |
|
Performing market contribution |
Europe at 45% |
|
Key countries |
China, US, Germany, Brazil, Sweden, Finland, France, India, UK, and Spain |
|
Competitive landscape |
Leading Companies, Market Positioning of Companies, Competitive Strategies, and Industry Risks |
|
Key companies profiled |
AOC, LLC, Arkema SA, Covestro AG, Exel Composites, Gurit Holding AG, Hexcel Corp., Huntsman Corp., Mitsubishi Chemical Corp., Nordex SE, Owens Corning, SGL Carbon SE, Solvay SA, TEIJIN Ltd, Toray Industries Inc., and TPI Composites Inc. |
|
Market dynamics |
Parent market analysis, market growth inducers and obstacles, market forecast, fast-growing and slow-growing segment analysis, COVID-19 impact and recovery analysis and future consumer dynamics, market condition analysis for the forecast period |
|
Customization purview |
If our market report has not included the data that you are looking for, you can reach out to our analysts and get segments customized. |
What are the Key Data Covered in this Market Research and Growth Report?
- CAGR of the market during the forecast period
- Detailed information on factors that will drive the market growth and forecasting between 2024 and 2028
- Precise estimation of the size of the market and its contribution of the market in focus to the parent market
- Accurate predictions about upcoming market growth and trends and changes in consumer behaviour
- Growth of the market across Europe, North America, APAC, Middle East and Africa, and South America
- Thorough analysis of the market's competitive landscape and detailed information about companies
- Comprehensive analysis of factors that will challenge the growth of market companies
We can help! Our analysts can customize this market research report to meet your requirements. Get in touch


