
Europe Wind Turbine Services Market Size 2025-2029
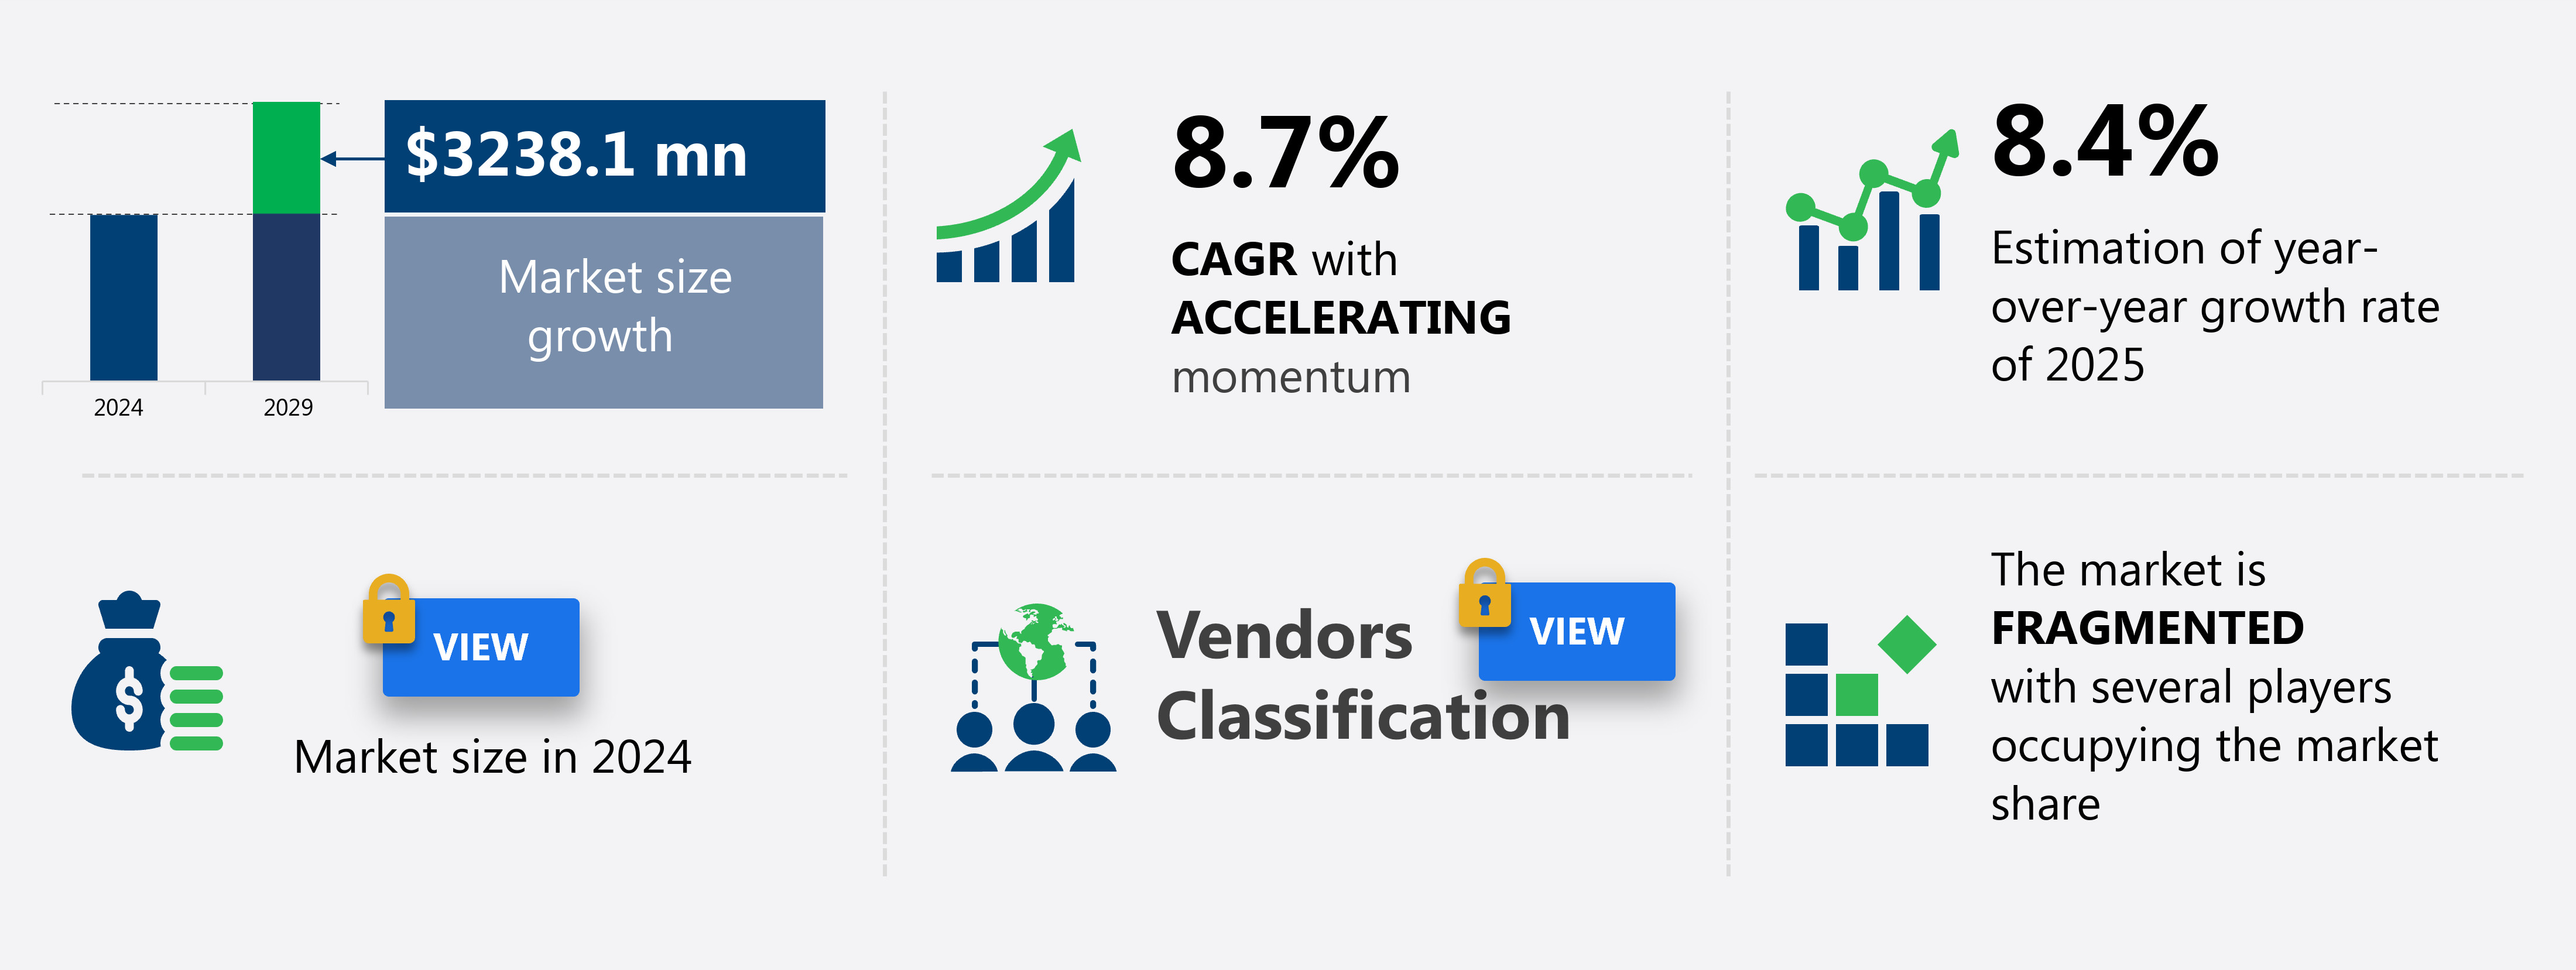
The Europe wind turbine services market size is forecast to increase by USD 3.24 billion at a CAGR of 8.7% between 2024 and 2029.
- The renewable energy sector, particularly wind energy, is witnessing significant growth due to increasing global focus on reducing carbon emissions and the depletion of conventional energy resources. Advanced energy technologies, such as wind turbines, inverters, and energy storage, are at the forefront of this transition. The market is driven by the rise in wind energy consumption and the development of hybrid models that combine wind power with other energy sources. However, the intermittency of wind power poses a challenge, necessitating the use of advanced technologies like artificial intelligence and sensors to optimize performance and ensure energy efficiency.
- Offshore wind turbines, which account for a substantial portion of the market, require specialized logistics and expertise for installation and maintenance. The wind tower, generator, and inverter are crucial components that require regular servicing to ensure optimal performance. Additionally, the use of sensors and energy storage systems is becoming increasingly important to mitigate the variability of wind power and ensure a consistent energy supply. Outsourcing wind turbine services to specialized companies can help reduce operational costs and improve efficiency.
What will be the Size of the market During the Forecast Period?
- The market is experiencing strong growth, driven by the increasing demand for renewable energy sources and the global shift towards reducing greenhouse gas emissions. Wind energy, as a significant contributor to electricity generation from clean and alternative sources, is witnessing substantial investment and expansion. The market encompasses various services, including rope access for turbine inspections and maintenance, surveillance, and collaborations for wind farm operations. Turbine components, such as gearboxes and generators, require scheduled and unscheduled maintenance to ensure optimal performance and productivity. Capital expenditures for wind turbines and wind farms continue to rise, necessitating a strong focus on production line efficiency and effective maintenance strategies. The market is also witnessing advancements in monitoring technologies and offshore turbine installations, further expanding its scope and complexity. Despite these opportunities, the wind turbine services market faces challenges, including a potential staff shortage and the need for continuous innovation to meet the evolving demands of the wind energy sector.
How is this market segmented and which is the largest segment?
The market research report provides comprehensive data (region-wise segment analysis), with forecasts and estimates in "USD million" for the period 2025-2029, as well as historical data from 2019-2023 for the following segments.
- Application
- On-shore
- Off-shore
- Type
- OEM
- ISP
- In-house
- End-user
- Wind farm operators
- Power generation companies
- Government and municipal bodies
- Service Type
- Operation and maintenance
- Monitoring and inspection
- Repair and refurbishment
- Installation and commissioning
- Geography
- Europe
- Germany
- UK
- Spain
- Sweden
- Europe
By Application Insights
- The on-shore segment is estimated to witness significant growth during the forecast period.
Wind turbine services play a crucial role in ensuring the optimal performance and longevity of onshore and offshore wind energy installations. Regular maintenance, inspections, and repairs are essential to address wear and tear, improve efficiency, and enhance reliability. Activities include cleaning, lubrication, electrical checks, and component replacement, such as rotor blades, gearboxes, and generators. Retrofitting and upgrading services modernize older turbines, enabling them to meet current standards and harness the benefits of advancements in wind energy technology. In 2022, onshore wind accounted for 87% of new installations in Europe, highlighting its significance in the wind energy sector. Wind turbine services encompass monitoring, maintenance, and repair, ensuring the continued distribution of clean, renewable electricity generation.
Additionally, collaborations between industry players and the integration of advanced sensors and monitoring systems facilitate proactive maintenance and reduce downtime.

Get a glance at the market report of share of various segments Request Free Sample
Market Dynamics
Our market researchers analyzed the data with 2024 as the base year, along with the key drivers, trends, and challenges. A holistic analysis of drivers will help companies refine their marketing strategies to gain a competitive advantage.
What are the key market drivers leading to the rise in adoption of Europe Wind Turbine Services Market?
Rise in wind energy consumption is the key driver of the market.
- Wind energy is gaining momentum as countries transition from reliance on non-renewable energy sources for electricity generation. Among renewable energy sources, wind power is considered the most effective.
- Wind turbine maintenance is crucial for optimal performance and includes scheduled maintenance, rope access for turbine components, and surveillance using sensors for gearboxes, brakes, towers, and inverters. Wind farms, both onshore and offshore, require collaborations for the installation, repair, and distribution of finished goods. Accessibility challenges for offshore turbines necessitate innovative solutions. The wind energy sector's growth is driven by the need to reduce greenhouse gas emissions and the increasing affordability of alternative energy.
What are the market trends shaping the Europe Wind Turbine Services Market?
Development of a hybrid model is the upcoming trend in the market.
- Wind turbine services involve the maintenance and repair of wind turbines and wind farms, utilizing advanced technologies such as rope access for hard-to-reach components. The wind energy sector contributes to reducing greenhouse gas emissions by generating electricity from clean, renewable sources. Turbine components, including gearboxes, brakes, rotor blades, inverters, and towers, require scheduled maintenance to ensure optimal performance. Offshore turbines present unique challenges due to their accessibility and installation costs. Contractual deals between wind farm owners and service providers ensure regular surveillance and maintenance. Advanced monitoring systems equipped with sensors enable early detection of potential issues, reducing downtime and repair costs.
- Collaborations between industry players and research institutions drive innovation in wind energy technology. Hybrid wind tower technology, combining wind and solar power, enhances energy production efficiency. These towers offer off-grid energy storage services, making them valuable for remote locations. The wind turbine industry faces a staff shortage, necessitating the adoption of advanced technologies and techniques for maintenance and repair. Overall, the market continues to grow as the demand for alternative energy sources increases.
What challenges does the Europe Wind Turbine Services Market face during the growth?
Intermittency of wind power is a key challenge affecting the market growth.
- The wind energy sector faces the challenge of intermittency, as wind availability is not consistent. However, advancements in technology have introduced backup solutions to mitigate this issue. For instance, wind turbines are complemented by energy storage systems, enabling the generation and distribution of electricity when wind conditions are unfavorable. Offshore wind turbines, in particular, require specialized maintenance due to their accessibility. Rope access techniques are commonly used for turbine component inspections and repairs.
- Contractual deals between wind farm owners and maintenance providers ensure scheduled maintenance, while surveillance using sensors and monitoring systems enable early detection of potential issues. Key components such as gearboxes, rotor blades, inverters, brakes, and towers require regular maintenance to ensure optimal performance. Collaborations between industry players and research institutions continue to drive innovation in wind energy, reducing installation costs and improving repair and distribution processes. The wind turbine industry is committed to reducing greenhouse gas emissions and contributing to the growth of clean energy and alternative energy sources.
Exclusive Customer Landscape
The market forecasting report includes the adoption lifecycle of the market, covering from the innovator's stage to the laggard's stage. It focuses on adoption rates in different regions based on penetration. Furthermore, the market report also includes key purchase criteria and drivers of price sensitivity to help companies evaluate and develop their market growth analysis strategies.

Customer Landscape
Key Companies & Market Insights
Companies are implementing various strategies, such as strategic alliances, market forecast, partnerships, mergers and acquisitions, geographical expansion, and product/service launches, to enhance their presence in the market.
The market research and growth report includes detailed analyses of the competitive landscape of the market and information about key companies, including:
ABB Ltd.- The company offers wind turbine services which includes efficiency improvement and production increase while improving reliability and reducing levelized cost of energy over the lifetime of turbine and wind farm.
- Acciona SA
- B9 Energy Ltd.
- Buss Energy Group GmbH
- Deutsche Windtechnik AG
- E.ON SE
- Emergya Wind Technologies BV
- Enercon Services Inc.
- Fassmer Industrial Service GmbH and Co. KG
- Fred. Olsen Ocean AS
- General Electric Co.
- Ingeteam Corp. S.A.
- Nordex SE
- Orsted AS
- P and A Renewable Services
- PNE AG
- Repower AG
- Siemens AG
- Suzlon Energy Ltd.
- Vestas Wind Systems AS
Qualitative and quantitative analysis of companies has been conducted to help clients understand the wider business environment as well as the strengths and weaknesses of key market players. Data is qualitatively analyzed to categorize companies as pure play, category-focused, industry-focused, and diversified; it is quantitatively analyzed to categorize companies as dominant, leading, strong, tentative, and weak.
Research Analyst Overview
The market is experiencing significant growth as the global shift towards clean energy sources continues to gain momentum. Wind energy, as an alternative to traditional electricity generation from fossil fuels, plays a crucial role in reducing greenhouse gas emissions and mitigating the impact of climate change. Wind turbines, a vital component of wind energy generation, require regular maintenance to ensure optimal performance and longevity. Turbine components, such as rotor blades, gearboxes, and inverters, undergo scheduled maintenance to maintain efficiency and prevent potential downtime. Rope access, a common method for accessing turbine components, enables maintenance personnel to reach hard-to-reach areas without the need for scaffolding or cranes.
Moreover, this method not only reduces costs but also increases accessibility, allowing for more frequent inspections and maintenance. Scheduled maintenance is essential to ensure the smooth operation of wind turbines. Wind farms, both onshore and offshore, require regular monitoring to detect any potential issues and prevent costly repairs. Advanced sensors and surveillance systems are used to monitor wind turbines, providing real-time data on their performance and identifying any anomalies. The wind turbine services market is facing a staff shortage, as the demand for skilled technicians and maintenance personnel continues to outpace supply. Collaborations between industry players and educational institutions are essential to address this issue and ensure a steady supply of qualified professionals.
Furthermore, offshore wind turbines present unique challenges due to their remote locations and harsh operating conditions. Installation costs for offshore wind farms are high, making it essential to ensure the reliability and longevity of the turbines. Repair and maintenance costs for offshore turbines can be significant, making preventative maintenance a priority. The wind turbine services market is dynamic, with ongoing advancements in technology driving innovation and efficiency. The market is expected to continue growing as the world transitions to renewable energy sources and the demand for clean energy increases. The distribution of finished goods and components in the wind turbine services market is critical to ensure timely and efficient maintenance and repair. Effective logistics and supply chain management are essential to minimize downtime and maintain the performance of wind turbines.
|
Market Scope |
|
|
Report Coverage |
Details |
|
Page number |
216 |
|
Base year |
2024 |
|
Historic period |
2019-2023 |
|
Forecast period |
2025-2029 |
|
Growth momentum & CAGR |
Accelerate at a CAGR of 8.7% |
|
Market growth 2025-2029 |
USD 3.24 billion |
|
Market structure |
Fragmented |
|
YoY growth 2024-2025(%) |
8.4 |
|
Key countries |
Germany, UK, Sweden, Spain, and Rest of Europe |
|
Competitive landscape |
Leading Companies, Market Positioning of Companies, Competitive Strategies, and Industry Risks |
What are the Key Data Covered in this Market Research and Growth Report?
- CAGR of the market during the forecast period
- Detailed information on factors that will drive the market growth and forecasting between 2025 and 2029
- Precise estimation of the size of the market and its contribution of the market in focus to the parent market
- Accurate predictions about upcoming market growth and trends and changes in consumer behaviour
- Growth of the market across Europe
- Thorough analysis of the market's competitive landscape and detailed information about companies
- Comprehensive analysis of factors that will challenge the growth of market companies
We can help! Our analysts can customize this market research report to meet your requirements. Get in touch